. 2022 Apr 12;39(2):110657.
doi: 10.1016/j.celrep.2022.110657.

TNF-α sculpts a maturation process in vivo by pruning tolerogenic dendritic cells

Affiliations

TNF-α sculpts a maturation process in vivo by pruning tolerogenic dendritic cells

Courtney A Iberg et al. Cell Rep. .

Abstract

It remains unclear how the pro-immunogenic maturation of conventional dendritic cells (cDCs) abrogates their tolerogenic functions. Here, we report that the loss of tolerogenic functions depends on the rapid death of BTLAhi cDC1s, which, in the steady state, are present in systemic peripheral lymphoid organs and promote tolerance that limits subsequent immune responses. A canonical inducer of maturation, lipopolysaccharide (LPS), initiates a burst of tumor necrosis factor alpha (TNF-α) production and the resultant acute death of BTLAhi cDC1s mediated by tumor necrosis factor receptor 1. The ablation of these individual tolerogenic cDCs is amplified by TNF-α produced by neighboring cells. This loss of tolerogenic cDCs is transient, accentuating the restoration of homeostatic conditions through biological turnover of cDCs in vivo. Therefore, our results reveal that the abrogation of tolerogenic functions during an acute immunogenic maturation depends on an ablation of the tolerogenic cDC population, resulting in a dynamic remodeling of the cDC functional landscape.

Keywords: BTLA; CP: Immunology; LPS; TNF-α; TNFR1; activation; cDC1; death; dendritic cells; maturation; tolerogenic.


Conflict of interest statement

Declaration of interests The authors declare no competing interests.

Figures

Figure 1.
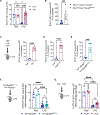
Figure 1.. Ablation of tolerogenic cDCs under pro-inflammatory conditions
(A–C) Wild-type mice were treated with PBS or LPS (1 μg/mouse) 24 h before analysis of splenocytes by flow cytometry. (A) Plots (representative of multiple independent experiments) show anti-XCR1 and anti-CD172a staining intensity in all cDCs (I-Ab+CD11c+—see gating strategy in Figure S1A). cDC1s are identified as XCR1+(CD172aneg), and cDC2s are identified as CD172a+(XCR1neg). Graphs shows percentages of cDC1s (B) or cDC2s (C) among all cDCs in the indicated groups (n = 4–6 mice per group pooled from two independent experiments). (D) Wild-type mice were treated with PBS or LPS (10 μg/mouse) 6 h before TUNEL analysis of splenocytes by flow cytometry. Graph shows percentages of TUNEL+ cells among cDC1s in the indicated groups (n = 2 samples of three mice pooled together per group from two independent experiments). (E and F) Wild-type mice were treated with PBS or LPS (1 μg/mouse) 24 h before analysis of splenocytes by flow cytometry. (E) Graph shows percentages of BTLAhi cells among cDC1s (see Figure S1B for the BTLAhi cutoff applied in all experiments; see also F) in the indicated groups (n = 4–6 mice per group pooled from two independent experiments). (F) Plots (representative of multiple independent experiments) show anti-XCR1 and anti-BTLA staining intensity in all cDCs. The BTLAhi cDC1s are indicated by the purple shaded regions. (G–J) Wild-type mice were treated with PBS or LPS (10 μg/mouse) 24 h before analysis of splenocytes by flow cytometry (n = 3–5 mice per group pooled from two independent experiments). Graphs show percentages of BTLAhi cDC1s among all cDCs (G) or among all leukocytes (H) or the absolute number of BTLAhi cDC1s per spleen (I) in the indicated groups. (J) Graph shows the percent of baseline (average of the corresponding PBS-treated mice) for BTLAhi cDC1s calculated as a percent among all cDCs, among all leukocytes, or as the absolute number of cells per spleen. (K) Wild-type mice were treated with PBS or the indicated doses of LPS 24 h before analysis of splenocytes by flow cytometry. Graph shows percentages of BTLAhi cDC1s among all cDCs (in the indicated groups; n = 4–6 mice per group pooled from two independent experiments). (L) Sorted Foxp3negCD25neg T cells from OT-II TCR tg Foxp3RFP mice were adoptively transferred into wild-type mice that were treated with anti-DEC-OVA only (PBS) or anti-DEC-OVA and 1 μg LPS (LPS) 14 days before analysis of splenocytes by flow cytometry. Graph shows percentages of Foxp3(RFP)+ cells among the Vα2+ Vβ5.1,5.2+ CD4+ T cells in the indicated groups of recipients (n = 5 mice per group pooled from two independent experiments). (A and F) Numbers next to outlined regions indicate corresponding percentages. (B–E and G–L) Graphs show mean ± standard deviation (SD). **p < 0.01, ***p < 0.001, and ****p < 0.0001 determined by unpaired two-tailed t test (B–E, G–I, and L), two-way ANOVA with Šídák’s multiple comparisons (J), or one-way ANOVA with Tukey’s multiple comparisons (K).
Figure 2.
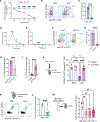
Figure 2.. BTLAhi cDC1s are ablated in trans
(A) Tlr4+/+ and Tlr4−/− mice were treated with PBS or LPS (10 μg/mouse) 24 h before analysis of splenocytes by flow cytometry. Graph shows percentages of BTLAhi cDC1s among all cDCs in the indicated groups (n = 3–6 mice per group pooled from three independent experiments). (B) Ripk3+/+Casp3+/+Casp8+/+ and Ripk3−/−Casp3−/−Casp8ΔCD11c mice were treated with PBS or LPS (10 μg/mouse) 24 h before analysis of splenocytes by flow cytometry. Graph shows percentages of BTLAhi cDC1s among all cDCs in LPS-treated mice as a percentage of the baseline (average of the corresponding PBS-treated mice) in the indicated groups (n = 6–8 mice per group pooled from three independent experiments). (C) Lethally irradiated Tlr4+/+ mice were reconstituted with congenically labeled Tlr4−/− or Tlr4+/+ bone marrow (BM). The reconstituted BM chimera mice were treated with PBS or LPS (10 μg/mouse) 24 h before analysis of splenocytes by flow cytometry. (Left) General experimental outline is shown. (Right) Graph shows percentages of BTLAhi cDC1s among all cDCs in LPS-treated mice as a percentage of the baseline (average of the corresponding PBS-treated mice) in the indicated groups (n = 3–6 mice per group pooled from two independent experiments). (D) Tlr4+/+ and Tlr4ΔCD11c mice were treated with PBS or LPS (10 μg/mouse) 24 h before analysis of splenocytes by flow cytometry. Graph shows percentages of BTLAhi cDC1s among all cDCs in LPS-treated mice as a percentage of the baseline (average of corresponding PBS-treated mice) in the indicated groups (n = 4–7 mice per group pooled from two independent experiments). (E) Trif+/+Myd88+/+ and Trif−/−Myd88ΔCD11c mice were treated with PBS or LPS (10 μg/mouse) 24 h before analysis of splenocytes by flow cytometry. Graph shows percentages of BTLAhi cDC1s among all cDCs in LPS-treated mice as a percentage of the baseline (average of corresponding PBS-treated mice) in the indicated groups (n = 4–6 per group pooled from two independent experiments). (F) Lethally irradiated Trif+/+Myd88+/+ mice were reconstituted with a 1:1 mix of congenically labeled Trif−/−Myd88ΔCD11c and Trif+/+Myd88+/+ BM. The reconstituted mixed BM chimera mice were treated with PBS or LPS (10 μg/mouse) 24 h before analysis of splenocytes by flow cytometry. (Left) General experimental outline is shown. (Right) Graph shows percentages of BTLAhi cDC1s among cDCs within the indicated genotype for each treatment (n = 3–8 mice per treatment pooled from two independent experiments). (G) Lethally irradiated Tlr4+/+ mice were reconstituted with a 1:1 mix of congenically labeled Tlr4−/− and Tlr4+/+ BM. The reconstituted mixed BM chimera mice were treated with PBS or LPS (10 μg/mouse) 24 h before analysis of splenocytes by flow cytometry. (Left) General experimental outline is shown. (Right) Graph shows percentages of BTLAhi cDC1s among cDCs within the indicated genotype for each treatment (n = 3–6 mice per treatment pooled from two independent experiments). (A–G) Graphs show mean ± SD. ns, not significant, ***p < 0.001, and ****p < 0.0001 determined by unpaired two-tailed t test (B–E) or one-way ANOVA with Tukey’s multiple comparisons (A, F, and G).
Figure 3.
Figure 3.. Rapid production of TNF-α mediates and amplifies the ablation of BTLAhi cDC1s
(A) Wild-type mice were treated with PBS or LPS (10 μg/mouse) at the indicated time points before analysis of splenocytes by flow cytometry. Graph shows percentages of BTLAhi cDC1s among all cDCs as a percentage of the baseline (average of PBS-treated mice for each time point) in the indicated groups (n = 4–6 mice per group pooled from two independent experiments per time point). Significance is shown for the comparison of PBS and LPS groups at each time point. (B and C) Wild-type mice were treated with PBS or LPS (10 μg/mouse) 1 h before analysis of splenocytes by flow cytometry. (B) Plots (representative of multiple independent experiments) show anti-XCR1 and anti-TNF-α intracellular staining intensity in all cDCs. (C) Graph shows percentages of TNF-α+ cells within the cDC1 (XCR1+ CD172aneg) and cDC2 (CD172a+XCR1neg) subsets, as indicated, from mice treated with LPS (n = 6 mice pooled from three independent experiments). (D and E) Wild-type mice were treated with PBS (0 h) or LPS (10 μg/mouse) at the indicated time points before analysis of splenocytes by flow cytometry. Graphs show percentages of TNF-α+ cells within cDC1 (D) or cDC2 (E) subsets for each time point (n = 2–6 mice per group pooled from three independent experiments). Significance is shown for each time point compared with the baseline (0 h). (F and G) Tlr4+/+ and Tlr4ΔCD11c were treated with LPS (10 μg) 1 h before analysis of splenocytes by flow cytometry. (F) Plots (representative of multiple independent experiments) show anti-XCR1 and anti-TNF-α intracellular staining intensity in all cDCs. (G) Graph shows percentages of TNF-α+ cells within the cDC1 subset in the indicated groups (n = 5–6 mice per group pooled from three independent experiments). (H) Wild-type mice were treated with PBS or LPS (10 μg/mouse) 1 h before analysis of splenocytes by flow cytometry. Graph shows percentages of TNF-α+ cells within the indicated populations of cDC1s (n = 6 mice pooled from three independent experiments). (I) Wild-type mice were treated with anti-TNF-α or isotype control antibody as indicated and LPS (10 μg/mouse) 24 h before analysis of splenocytes by flow cytometry. Graph shows percentages of BTLAhi cDC1s among all cDCs in the indicated groups (n = 5–6 mice per group pooled from two independent experiments). (J) Lethally irradiated Tlr4+/+ mice were reconstituted with a 1:1 mix of congenically labeled Tlr4−/− and Tlr4+/+ BM. The reconstituted mixed BM chimera mice were treated with anti-TNF-α or isotype control antibody and PBS or LPS (10 μg/mouse) as indicated 24 h before analysis of splenocytes by flow cytometry. (Left) General experimental outline is shown. (Right) Graph shows percentages of BTLAhi cDC1s among Tlr4−/− cDCs in the indicated groups (n = 3–7 mice per group pooled from two independent experiments). (K and L) Wild-type mice were treated with PBS or recombinant mouse TNF-α 24 h before analysis of splenocytes by flow cytometry. (K) (Top) General experimental outline is shown. (Bottom) Representative plots show anti-XCR1 and anti-BTLA staining intensity in all cDCs. (L) Graph shows percentages of BTLAhi cDC1s among all cDCs in the indicated groups. Results represent one of two similar experiments (n = 3–5 mice per group). (M) Lethally irradiated Tlr4+/+ mice were reconstituted with the indicated ratios of congenically labeled Tlr4−/− and Tlr4+/+ BM. The reconstituted mixed BM chimera mice were treated with LPS (10 μg/mouse) 24 h before analysis of splenocytes by flow cytometry. (Left) General experimental outline is shown. (Right) Graph shows percentages of BTLAhi cDC1s among Tlr4−/− cDCs in the indicated groups (n = 4–7 mice per group pooled from two independent experiments). (B, F, and K) Numbers next to outlined regions indicate corresponding percentages. (A, D, and E) Graphs show mean ± standard error of mean (SEM). (C, G–J, L, and M) Graphs show mean ± SD. *p < 0.05, **p < 0.01, and ****p < 0.0001 determined by two-way ANOVA with Šídák’s multiple comparisons (A), unpaired two-tailed t test (C, G–I, and L), or one-way ANOVA with Tukey’s multiple comparisons (D, E, J, and M).
Figure 4.
Figure 4.. TNF-α ablates BTLAhi(CCR7lo) cDC1s throughout peripheral lymphoid organs
(A) Wild-type mice were treated with PBS or LPS (10 μg/mouse) 24 h before analysis of splenocytes by flow cytometry. Graphs show percentages of BTLAhiCCR7lo cDC1s (gated as in Figure S4A) among all leukocytes in the indicated groups (n = 4–6 mice per group pooled from two independent experiments). (B and C) Wild-type mice were treated with PBS or LPS (10 μg/mouse) 48 h before analysis of peripheral lymph nodes by flow cytometry. Graph shows percentages of BTLAhiCCR7lo cDC1s (gated as in Figures S4C and S4D) among all cDCs (B) or among all leukocytes (C) in the indicated groups (n = 3 mice per group). Results represent one of two similar experiments. (D) Sorted Foxp3negCD25neg T cells from OT-II TCR tg Foxp3RFP mice were adoptively transferred into wild-type mice that were treated with anti-DEC-OVA only (PBS) or anti-DEC-OVA and 1 μg LPS (LPS) 14 days before analysis of peripheral lymph nodes by flow cytometry. Graphs show percentages of Foxp3(RFP)+ cells among Vα2+ Vβ5.1,5.2+ CD4+ T cells in the indicated groups (n = 5 mice per group pooled from two independent experiments). (E) Lethally irradiated Tlr4+/+ mice were reconstituted with a 1:1 mix of congenically labeled Tlr4−/− and Tlr4+/+ BM. The reconstituted mixed BM chimera mice were treated with anti-TNF-α or isotype control antibody and PBS or LPS (10 μg/mouse) 48 h before analysis of peripheral lymph nodes by flow cytometry. (Top) General experimental outline is shown. (Bottom) Graph shows percentages of BTLAhiCCR7lo cDC1s among Tlr4−/− cDCs in the indicated groups (n = 3–7 mice per group pooled from two independent experiments). (F) Wild-type mice were treated with PBS or recombinant mouse TNF-α 24 h before analysis of peripheral lymph nodes by flow cytometry. (Top) General experimental outline and diagram specifying the populations of cDC1s based on BTLA and CCR7 expression corresponding to populations gated as in Figures S4C and S4D is shown. (Bottom) Graphs show the percentages of the specified populations defined by specific BTLA and CCR7 expression in cDC1s among all cDCs in lymph nodes for the indicated groups. Results represent one of two similar experiments (n = 3–5 mice per group). (A–F) Graphs show mean ± SD. *p < 0.05, **p < 0.01, ***p < 0.001, and ****p < 0.0001 determined by unpaired two-tailed t test (A–D and F) or one-way ANOVA with Tukey’s multiple comparisons (E).
Figure 5.
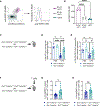
Figure 5.. TNFR1 orchestrates the ablation of tolerogenic BTLAhi cDC1s
(A and B) Spleens from untreated wild-type mice were analyzed by flow cytometry. (A) Plot (left) shows anti-XCR1 and anti-BTLA staining intensity in all cDCs. Shaded regions specify gating of populations denoted in the overlaid histograms (right) that show anti-TNFR1 staining intensity of the indicated populations. Results are representative of multiple independent experiments. (B) Graph shows median fluorescence intensity (MFI) of anti-TNFR1 staining in the indicated populations (gated as in A; n = 4 mice pooled from three independent experiments). (C–E) Lethally irradiated Tlr4+/+Tnfrsf1a+/+ mice were reconstituted with a 1:1 mix of congenically labeled Tlr4−/−Tnfrsf1a+/+ and Tlr4+/+Tnfrsf1a+/+ or Tlr4−/−Tnfrsf1a−/− and Tlr4+/+Tnfrsf1a+/+ BM. (C) General experimental outline for mixed BM chimeras. (D) Reconstituted mixed BM chimera mice were treated with PBS or LPS (10 μg/mouse) 24 h before analysis of splenocytes by flow cytometry. Graph shows percentages of BTLAhi cDC1s among cDCs within the indicated genotype for each treatment (n = 3–8 mice per group pooled from two independent experiments). (E) Reconstituted mixed BM chimera mice were treated with PBS or LPS (10 μg/mouse) 48 h before analysis of peripheral lymph nodes by flow cytometry. Graph shows percentages of BTLAhiCCR7lo cDC1s among cDCs within the indicated genotype for each treatment (n = 4–7 mice per group pooled from three independent experiments). (F–H) Lethally irradiated Tlr4+/+Tnfrsf1a+/+ mice were reconstituted with a 2:1 mix of congenically labeled Tlr4−/−Tnfrsf1a+/+ and Tlr4+/+Tnfrsf1a+/+ or Tlr4−/−Tnfrsf1a−/− and Tlr4+/+Tnfrsf1a+/+ BM. Sorted Foxp3negCD25neg T cells from OT-II TCR tg Foxp3RFP mice were adoptively transferred into the reconstituted mixed BM chimera mice that were treated with anti-DEC-OVA and LPS (10 μg/mouse) 14 to 15 days before analysis of spleens and peripheral lymph nodes by flow cytometry. (F) General experimental outline for adoptive transfers into reconstituted mixed BM chimeras. (G and H) Graphs show percentages of Foxp3(RFP)+ cells among Vα2+ Vβ5.1,5.2+ CD4+ T cells in the indicated groups of recipients among splenocytes (G) or lymph node cells (H) (n = 10–12 mice per group pooled from three independent experiments). (B, D, E, G, and H) Graphs show mean ± SD. *p < 0.05, **p < 0.01, and ****p < 0.0001 determined by one-way ANOVA with Tukey’s multiple comparisons (B, D, and E) or unpaired two-tailed t test (G and H).
Figure 6.
Figure 6.. Return to the homeostatic baseline by BTLAhi cDC1s
(A) Wild-type mice were treated with PBS or LPS (10 μg/mouse) at the indicated time points before analysis of splenocytes by flow cytometry. Graph shows percentages of BTLAhi cDC1s among all cDCs as a percentage of the baseline (average of PBS-treated mice for each time point) at the indicated time points (n = 4–7 mice per group pooled from two independent experiments per time point). Significance is shown for the comparison of PBS and LPS groups at each time point. (B) Wild-type mice were treated with PBS or LPS (10 μg/mouse) 12 days before analysis of splenocytes by flow cytometry. Plots (representative of multiple independent experiments) show anti-XCR1 and anti-BTLA staining intensity in all cDCs. Numbers next to outlined regions indicate corresponding percentages. Graph shows percentages of BTLAhi cDC1s among all cDCs in the indicated groups (n = 4 mice per group pooled from two independent experiments). (C and D) Wild-type mice were treated with PBS or LPS (10 μg/mouse) 9 days before analysis of splenocytes by flow cytometry. (C) Overlaid histograms (representative of two independent experiments) show anti-TNFR1 staining intensity of the indicated populations (gated as in Figure 5A) from PBS-treated mice and 9 days post-LPS treatment. Corresponding graphs show MFI of anti-TNFR1 staining in the indicated populations for the indicated treatments (n = 4–5 mice per group pooled from two independent experiments). (D) Overlaid histogram (representative of two independent experiments) shows anti-TNFR1 staining intensity of BTLAhi cDC1s from PBS-treated mice and 9 days post-LPS treatment as indicated. Corresponding graph shows MFI of anti-TNFR1 staining in BTLAhi cDC1s for the indicated treatments (n = 4–5 mice per group pooled from two independent experiments). (E) Wild-type mice were treated with PBS or LPS (10 μg/mouse) 8 days before re-challenge with either PBS or LPS (10 μg/mouse). Splenocytes were analyzed by flow cytometry 1 day later. (Left) General experimental outline is shown. (Right) Graph shows percentages of BTLAhi cells among cDC1s in the indicated groups (n = 3 mice per group). (A) Graph shows mean ± SEM. (B–E) Graphs show mean ± SD. ***p < 0.001 and ****p < 0.0001 determined by two-way ANOVA with Šídák’s multiple comparisons (A), one-way ANOVA with Tukey’s multiple comparisons (C), or unpaired two-tailed t test (B, D, and E).

References

    1. Abram CL, Roberge GL, Hu Y, and Lowell CA (2014). Comparative analysis of the efficiency and specificity of myeloid-Cre deleting strains using ROSA-EYFP reporter mice. J. Immunol. Methods 408, 89–100. - PMC - PubMed
    1. Albert ML, Pearce SF, Francisco LM, Sauter B, Roy P, Silverstein RL, and Bhardwaj N (1998). Immature dendritic cells phagocytose apoptotic cells via alphavbeta5 and CD36, and cross-present antigens to cytotoxic T lymphocytes. J. Exp. Med 188, 1359–1368. - PMC - PubMed
    1. Anderson AE, Swan DJ, Sayers BL, Harry RA, Patterson AM, von Delwig A, Robinson JH, Isaacs JD, and Hilkens CM (2009). LPS activation is required for migratory activity and antigen presentation by tolerogenic dendritic cells. J. Leukoc. Biol 85, 243–250. - PMC - PubMed
    1. Ardouin L, Luche H, Chelbi R, Carpentier S, Shawket A, Montanana Sanchis F, Santa Maria C, Grenot P, Alexandre Y, Gregoire C, et al. (2016). Broad and largely concordant molecular changes characterize tolerogenic and immunogenic dendritic cell maturation in thymus and periphery. Immunity 45, 305–318. - PubMed
    1. Arpaia N, Campbell C, Fan X, Dikiy S, van der Veeken J, Deroos P, Liu H, Cross JR, Pfeffer K, Coffer PJ, et al. (2013). Metabolites produced by commensal bacteria promote peripheral regulatory T-cell generation. Nature 504, 451–455. - PMC - PubMed

Publication types

Substances