. 2022 Apr 12;39(2):110652.
doi: 10.1016/j.celrep.2022.110652.

A particle size threshold governs diffusion and segregation of PAR-3 during cell polarization

Affiliations

A particle size threshold governs diffusion and segregation of PAR-3 during cell polarization

Yiran Chang et al. Cell Rep. .

Abstract

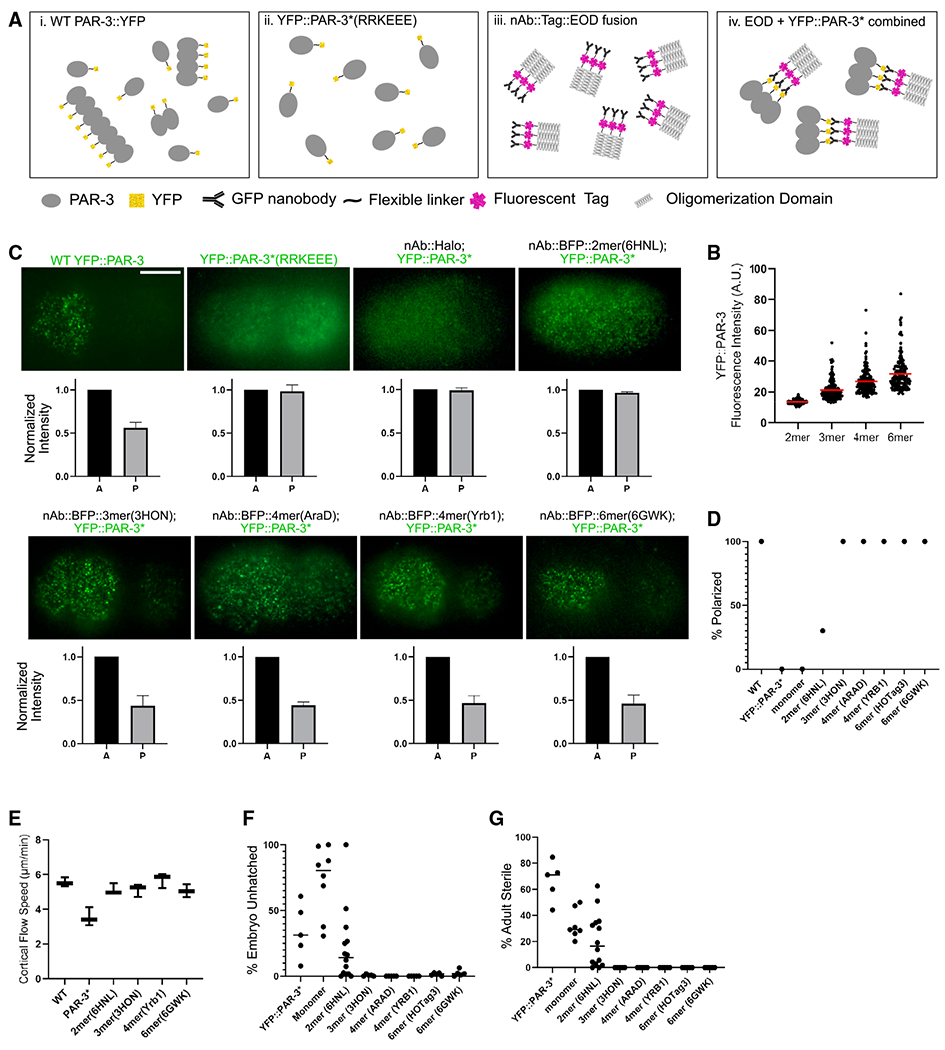
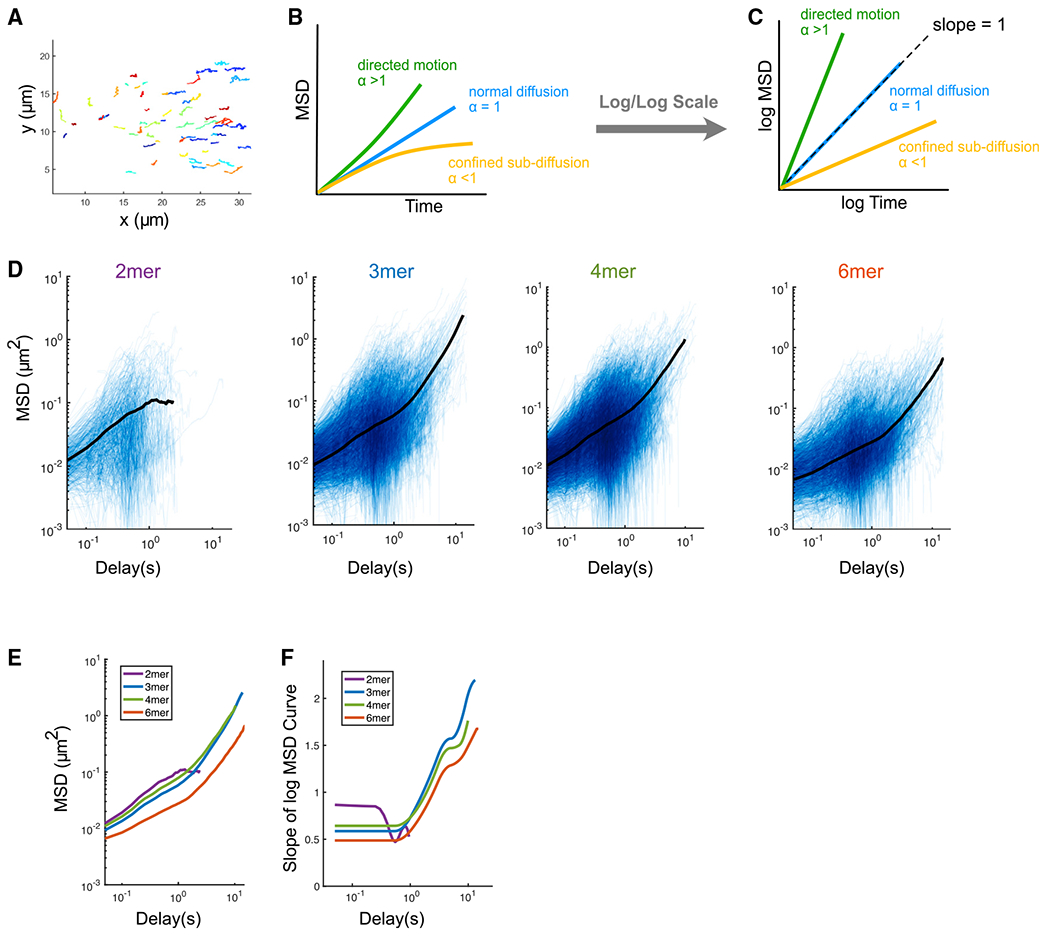
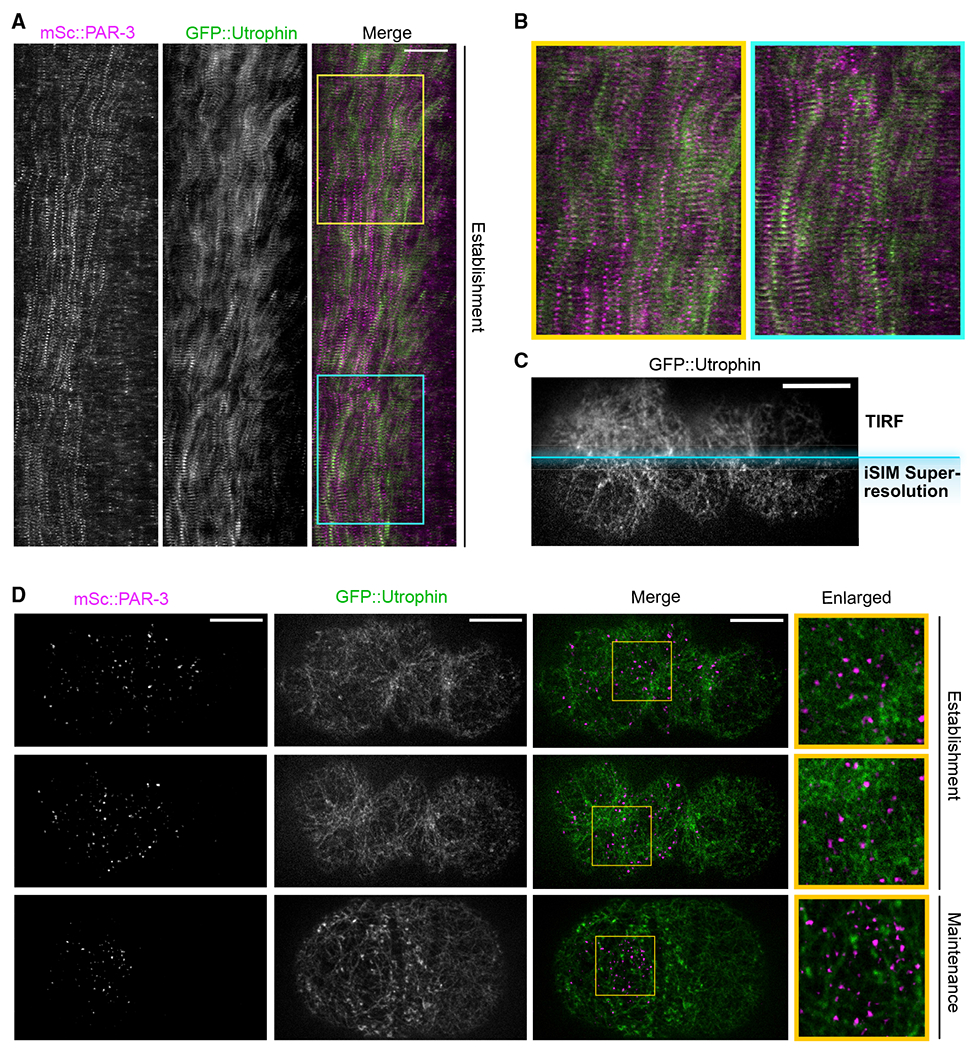
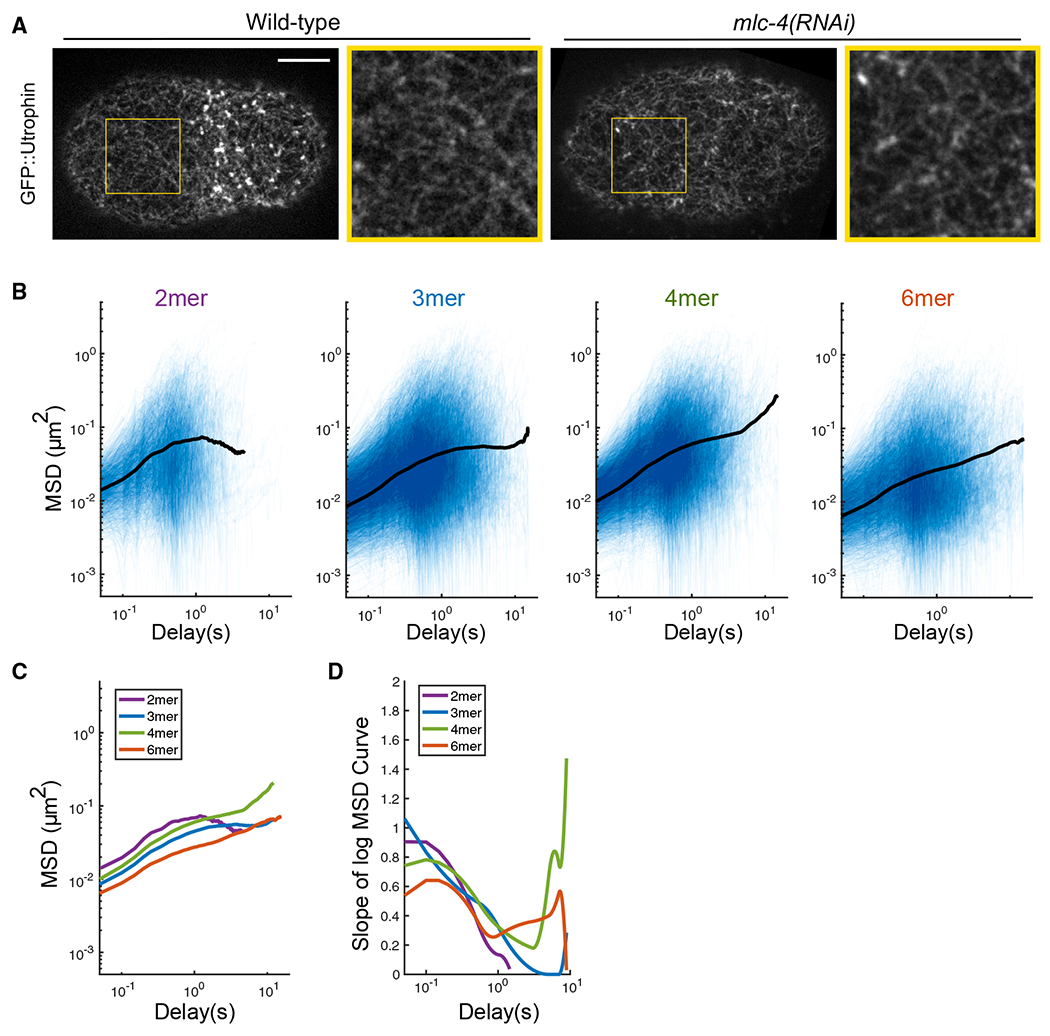
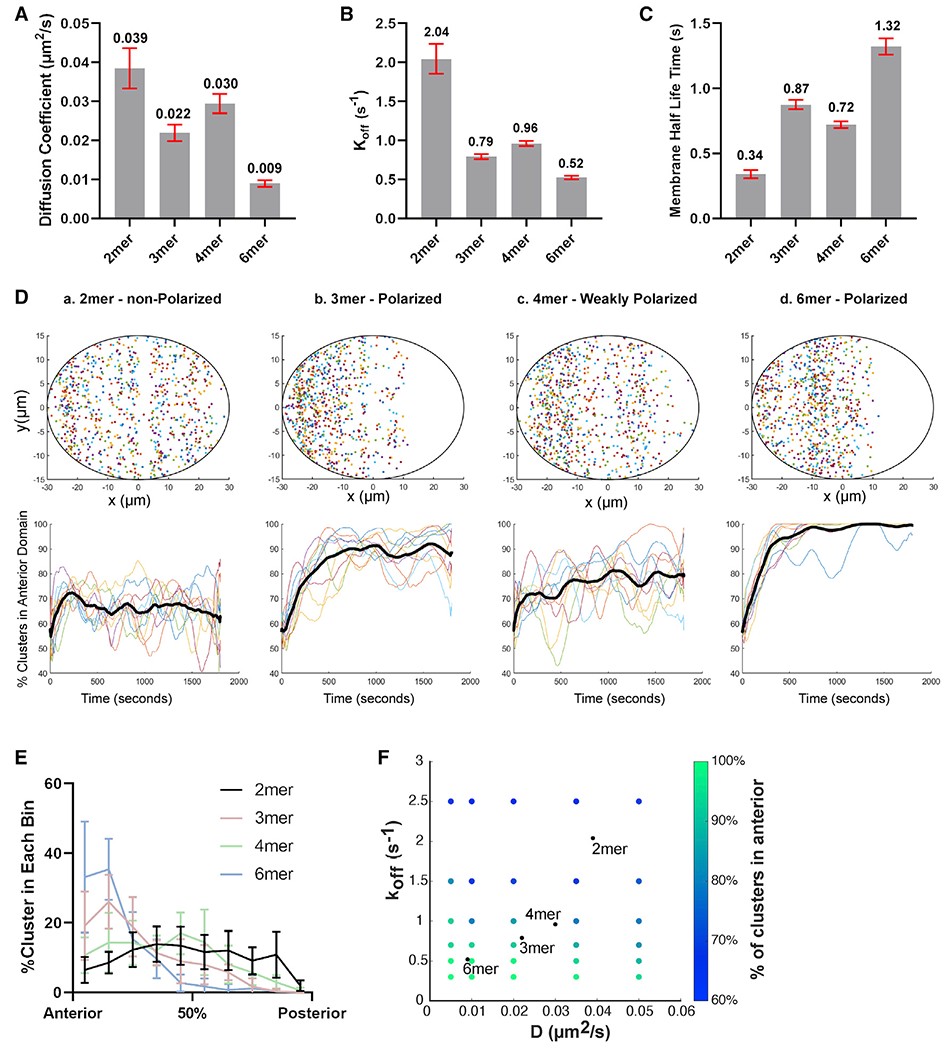
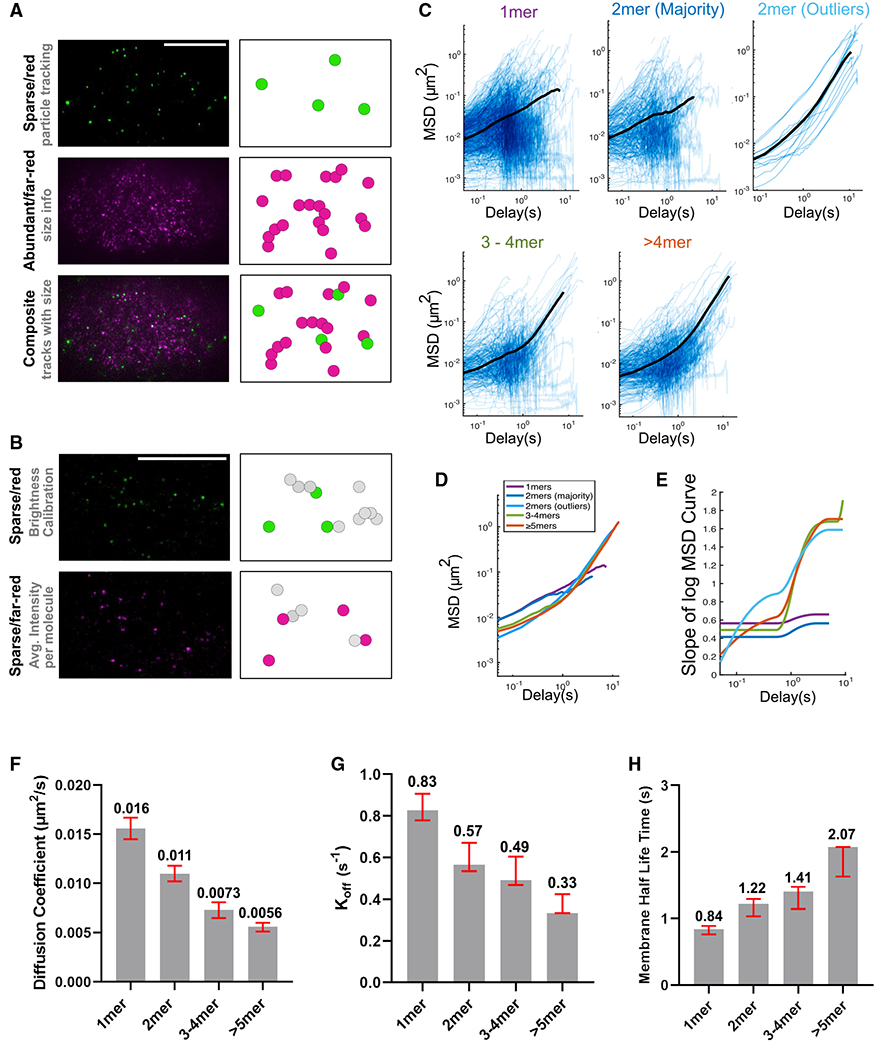
The actomyosin cortex regulates the localization and function of proteins at the plasma membrane. Here, we study how membrane binding, cortical movements, and diffusion determine membrane protein distribution. In Caenorhabditis elegans zygotes, actomyosin flows transport PAR polarity proteins to establish the anterior-posterior axis. Oligomerization of a key scaffold protein, PAR-3, is required for polarization. PAR-3 oligomers are a heterogeneous population of many different sizes, and it remains unclear how oligomer size affects PAR-3 segregation. To address this question, we engineered PAR-3 to defined sizes. We report that PAR-3 trimers are necessary and sufficient for PAR-3 function during polarization and later embryo development. Quantitative analysis of PAR-3 diffusion shows that a threshold size of three subunits allows PAR-3 clusters to stably bind the membrane, where they are corralled and transported by the actomyosin cortex. Our study provides a quantitative model for size-dependent protein transportation of peripheral membrane proteins by cortical flow.

Keywords: C. elegans; CP: Cell biology; CP: Developmental biology; PAR-3; actomyosin; cell polarity; cortical flow.


Conflict of interest statement

Declaration of interests The authors declare no competing interests.

Figures

Figure 1.
Figure 1.. Engineered PAR-3 trimers are sufficient for aPAR segregation and normal development
(A) Illustration of our strategy to engineer PAR-3 to specific sizes. (i) During polarity establishment, PAR-3 clusters exist as a heterogeneous population of various sizes. (ii) PAR-3* monomers in which the oligomerization domain is disrupted are shown. (iii) Transgenic nAb::EOD constructs contain the EOD (trimer is shown as an example), a fluorescent label, and a GFP-binding nanobody. (iv) PAR-3 of controlled oligomer size was generated by combining YFP::PAR-3*(RRKEEE) and EOD constructs. (B) YFP fluorescence intensity cortical YFP::PAR-3* in EOD-expressing embryos dissected from mlc-4 RNAi-treated worms. mlc-4 RNAi was used for these measurements to prevent crowding of PAR-3 clusters into the anterior domain, which makes accurately measuring intensity more difficult. Data show only clusters that are stabilized on the cortex for more than 10 frames (0.5 s), because these are the particle tracks we used in the quantitative analysis below. We obtained equivalent results with or without the track-length filter (Figure S1F). Red bars indicate means. (C) Upper panels: live images of cortical YFP::PAR-3* in the indicated EOD strains. Scale bar: 10 μm. Lower panels: quantification of fluorescence intensity in anterior and posterior is shown. n = 3 embryos of each strain. (D) Percentage of embryos from each EOD strain that displays effective PAR-3 polarization. n = 10 embryos of each strain. (E) Cortical flow speed measured from DIC videos of live embryos dissected from wild-type, YFP::PAR-3*(RRKEEE), and YFP::PAR-3*; nAB::BFP::EOD strains. n = 3 embryos from each strain. Horizontal bars indicate means. (F) Embryo lethality of each EOD strain. “Monomer” is a control construct comprising the nanobody and fluorescent tag but no EOD. Horizontal bars indicate means. (G) Adult sterility of each EOD strain. Monomer is a control construct comprising the nanobody and fluorescent tag but no EOD. Horizontal bars indicate means.
Figure 2.
Figure 2.. PAR-3 trimers and larger oligomers undergo directed motion due to cortical flow, while PAR-3 dimers do not
(A) Tracks of engineered PAR-3 trimers imaged at the cortex during polarity establishment. Anterior is to the left. Different colors are only used for better visualization. t = 15 s. (B) Illustration of the interpretation of anomalous parameters. (C) Illustration of the interpretation of the MSD curve on log/log scales. (D) Log/log scale MSD curves for dimer, trimer, tetramer, and hexamer, each curve describing the motion of a single PAR-3 cluster. For each plot, data were acquired and pooled from three embryos. Averaged MSD curves are shown for time lags defined by at least 20 data points. (E) Comparison of the averaged MSD curves for dimer, trimer, tetramer, and hexamer. (F) Slopes of the averaged MSD curves for dimer, trimer, tetramer, and hexamer, estimated by fitting a smoothing spline to each curve and then taking its derivative.
Figure 3.
Figure 3.. Super-resolution imaging reveals that PAR-3 moves in tandem with the actomyosin cortex despite not being physically associated with actin
(A) Kymograph of cortical mSc::PAR-3 and utrophin::GFP during the first cell cycle. Embryos were imaged using TIRF at 3 s/frame. Anterior is to the left. Scale bar represents 10 μm. Yellow and blue boxes indicate regions enlarged in (B). (B) Enlarged sections of kymograph (boxes) in (A). (C) Comparison between TIRF imaging and high-resolution iSIM imaging. A mSc::PAR-3; GFP::UTRO zygote at polarization stage was imaged. Only the GFP::utrophin channel is shown. Scale bar represents 10 μm. (D) Maximum projected z stacks of images of mSc::PAR-3; GFP::utrophin zygote, imaged using super-resolution iSIM imaging centered at the cortical region. Anterior is to the left. Scale bars represent 10 μm. Yellow box, region enlarged in right column.
Figure 4.
Figure 4.. PAR-3 clusters are loosely confined by the transient physical interactions with the actomyosin cortex
(A) Super-resolution iSIM images of GFP::utrophin zygotes at pronuclear meeting, with or without mlc-4 RNAi. The structure of the actin network is intact under mlc-4 RNAi. Yellow box, region enlarged to the right of each image. Scale bar represents 10 μm. (B) log/log scale MSD curves for dimer, trimer, tetramer, and hexamer with mlc-4 RNAi treatment, each curve describing the motion of a single PAR-3 cluster. For each plot, data were acquired and pooled from three embryos. Averaged MSD curves are shown for time lags defined by at least 20 data points. (C) Comparison of the averaged MSD curves for dimer, trimer, tetramer, and hexamer. (D) Slopes of the averaged MSD curves for dimer, trimer, tetramer, and hexamer, estimated by fitting a smoothing spline to each curve and then taking its derivative.
Figure 5.
Figure 5.. Simulations reveal that the different behaviors of dimers and larger oligomers can be explained by measured diffusion and membrane binding
(A) The diffusion coefficient of PAR-3 in engineered EOD::PAR-3 strains (wild-type background). Red bars indicated 95% confidence interval (CI). Data points were pooled from three embryos for each strain. n = 4,237, 10,587, 12,619, and 6,724 particles for dimer, trimer, tetramer, and hexamer, respectively. (B) The koff of PAR-3 in engineered EOD::PAR-3 strains (wild-type background). Red bars indicated 95% CI. Data points were pooled from three embryos for each strain. n = 4,237, 10,587, 12,619, and 6,724 particles for dimer, trimer, tetramer, and hexamer, respectively. (C) The membrane binding half-life time of PAR-3 in engineered EOD::PAR-3 strains. Red bars indicated 95% CI. Data points were pooled from three embryos for each strain. n = 4,237, 10,587, 12,619, and 6,724 particles for dimer, trimer, tetramer, and hexamer, respectively. (D) Upper panels: final cluster positions after simulating particle movement for 15 min. Ellipse, boundary of simulated embryo. x and y units, μm. Lower panels: percentage of particles in the anterior domain over time in simulated embryos is shown. Each line describes an independent repeat of the simulation. Black line, average. (E) The number of clusters in each 6-μm-wide bin along the AP axis in simulated EOD embryos. n = 10 for each set of conditions. (F) Dependence of the simulation outcomes on parameter values. Each point represents the average results of 10 simulation runs. The parameter values used in (D) and (E) are indicated by black points.
Figure 6.
Figure 6.. The PAR-3 size threshold in an endogenous setting
(A) TIRF images and cartoon illustrations of the dual-labeling experiment. Magenta represents far-red/abundant channel and green represents red/sparse channel. Scale bar represents 10 μm. (B) TIRF images and cartoon illustrations of the calibration double dilution experiment, where the dyes for both channels are diluted to single-molecule levels. Scale bar represents 10 μm. (C) Log/log scale MSD curves for each cluster group binned by estimated size, each curve describing the motion of a single PAR-3 cluster. For each plot, data were acquired and pooled from five embryos. Averaged MSD curves are shown for time lags defined by at least 20 data points except for the dimer outlier curves (top right), for which the average is over all 13 particles observed. (D) Comparison of the averaged MSD curves for each cluster group binned by estimated size. (E) Slopes of the averaged MSD curves for each cluster group binned by estimated size. Slopes were estimated by fitting a smoothing spline to each curve and then taking its derivative. (F) The diffusion coefficient measured in a dual-labeling experiment. Red bars indicated 95% CI. Data points were pooled from three embryos for each strain. n = 672, 297, 244, and 322 particles for monomers, dimers, trimers to tetramers, and greater than pentamers, respectively. (G) The koff measured in a dual-labeling experiment. Red bars indicated 95% CI. Data points were pooled from three embryos for each strain. n = 672, 297, 244, and 322 particles for monomers, dimers, trimers to tetramers, and greater than pentamers, respectively. (H) The membrane binding lifetime measured in a dual-labeling experiment. Red bars indicated 95% CI. Data points were pooled from three embryos for each strain. n = 672, 297, 244, and 322 particles for monomers, dimers, trimers to tetramers, and greater than pentamers, respectively.

References

    1. Allen NS, and Allen RD (1978). Cytoplasmic streaming in green plants. Annu. Rev. Biophys. Bio 7, 497–526. - PubMed
    1. Ananthakrishnan R, and Ehrlicher A (2007). The forces behind cell movement. Int. J. Biol. Sci 3, 303–317. - PMC - PubMed
    1. Arata Y, Hiroshima M, Pack C-G, Ramanujam R, Motegi F, Nakazato K, Shindo Y, Wiseman PW, Sawa H, Kobayashi TJ, et al. (2016). Cortical polarity of the RING protein PAR-2 is maintained by exchange rate kinetics at the cortical-cytoplasmic boundary. Cell Rep. 16, 2156–2168. - PubMed
    1. Benton R, and Johnston DSt. (2003).A conserved oligomerization domain in Drosophila bazooka/PAR-3 is important for apical localization and epithelial polarity. Curr. Biol 13, 1330–1334. - PubMed
    1. Bolten M, Delley CL, Leibundgut M, Boehringer D, Ban N, and Weber-Ban E (2016). Structural analysis of the bacterial proteasome activator bpa in complex with the 20S proteasome. Structure 24, 2138–2151. - PubMed

MeSH terms

Substances

LinkOut - more resources