. 2022 Apr 12;39(2):110669.
doi: 10.1016/j.celrep.2022.110669.

An evolutionary gap in primate default mode network organization

Affiliations

An evolutionary gap in primate default mode network organization

Clément M Garin et al. Cell Rep. .

Abstract

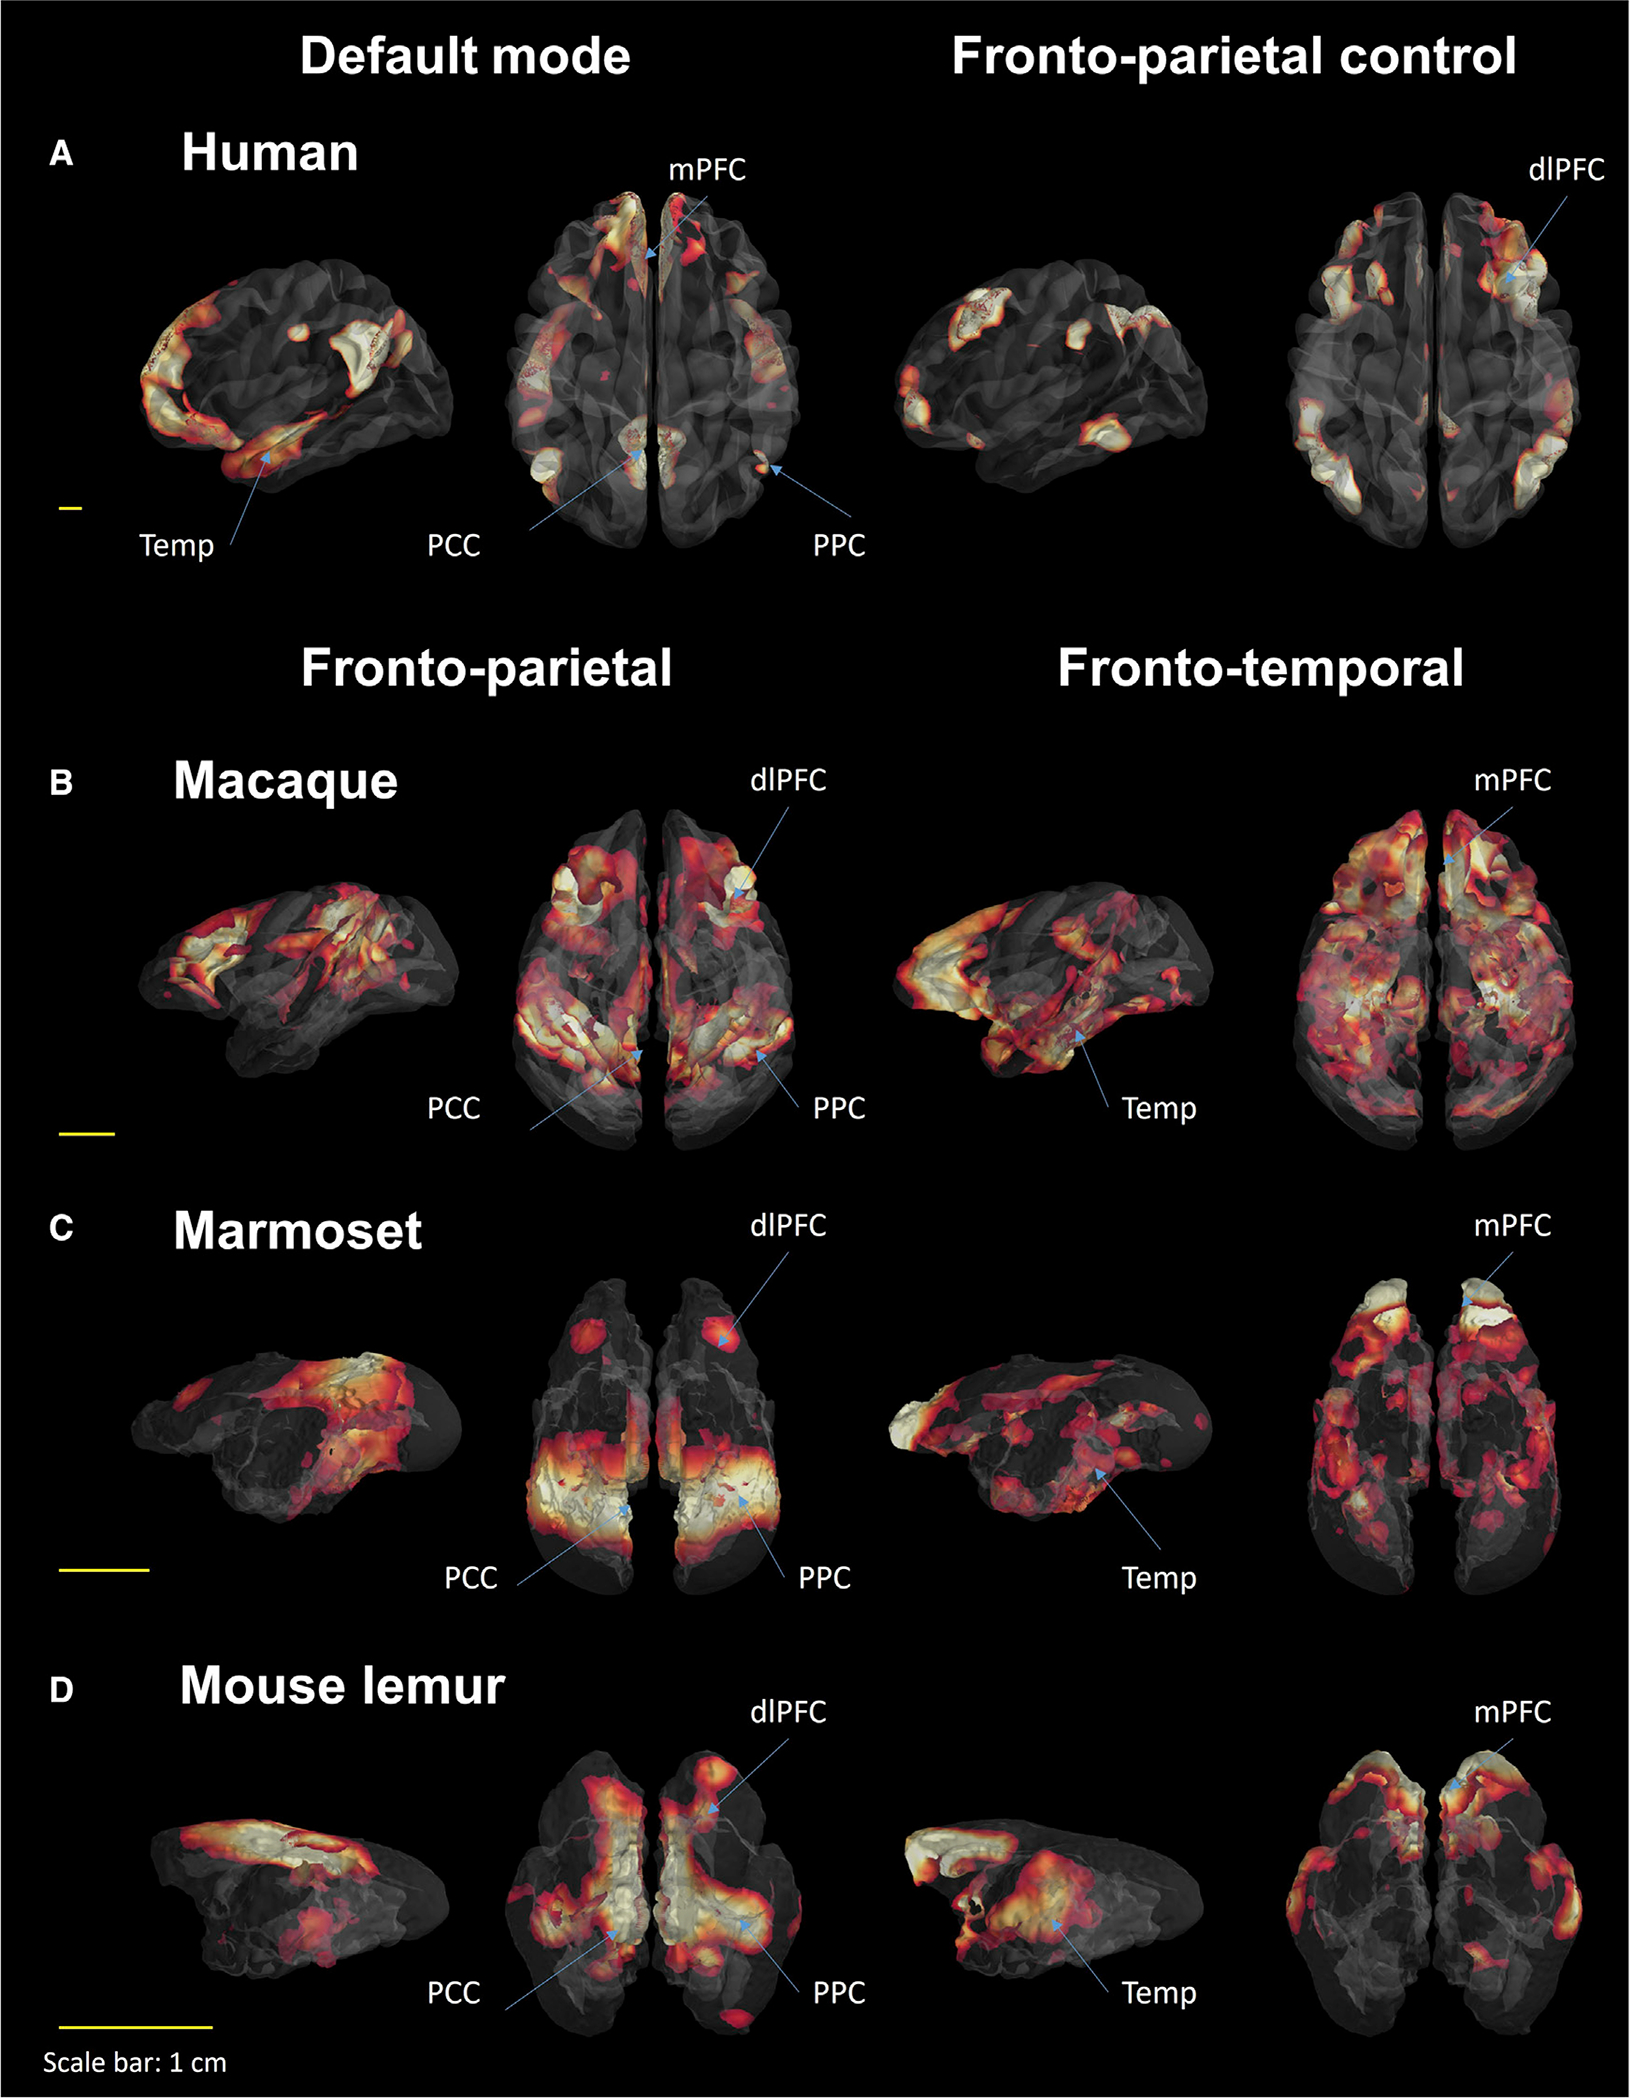
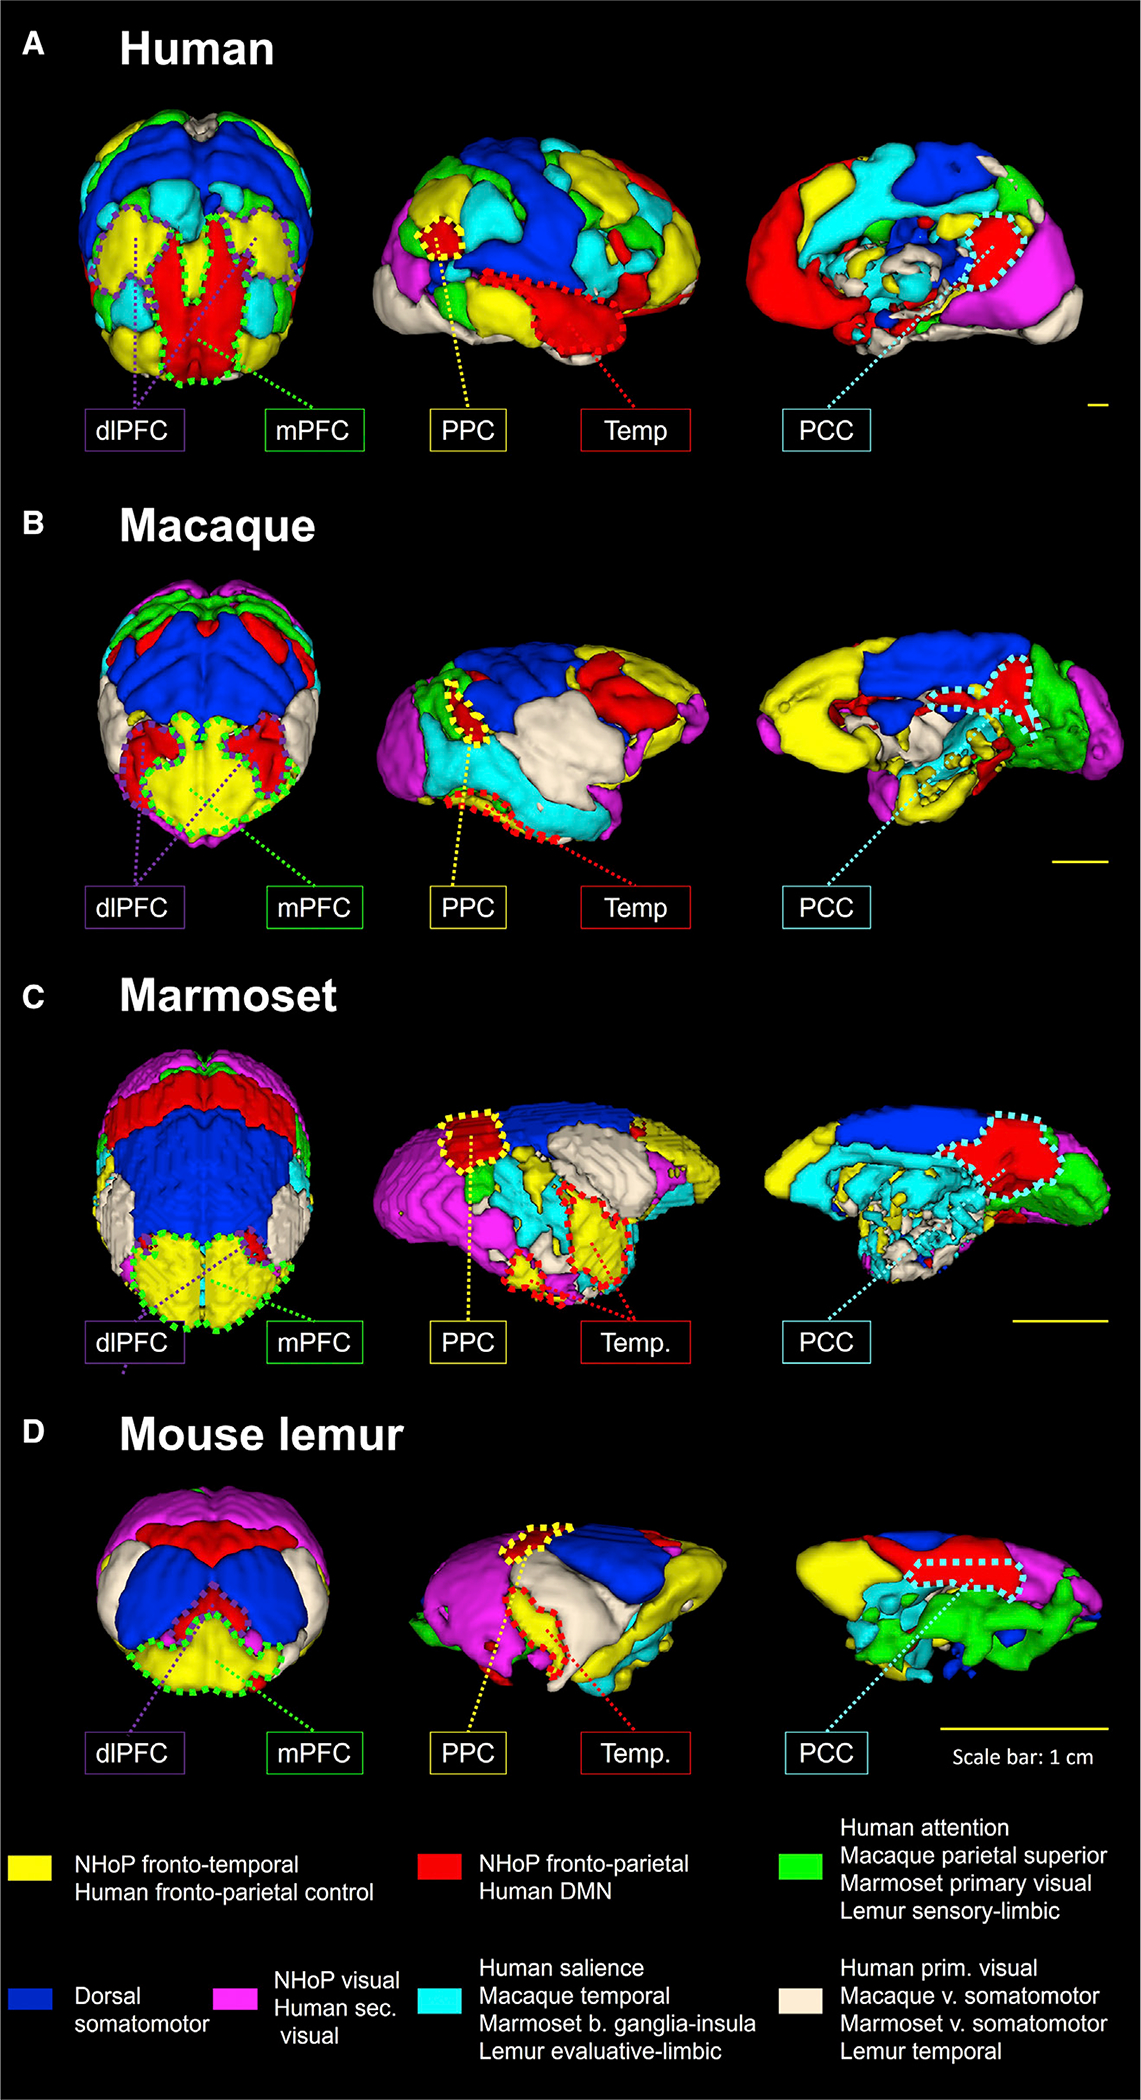
The human default mode network (DMN) is engaged at rest and in cognitive states such as self-directed thoughts. Interconnected homologous cortical areas in primates constitute a network considered as the equivalent. Here, based on a cross-species comparison of the DMN between humans and non-hominoid primates (macaques, marmosets, and mouse lemurs), we report major dissimilarities in connectivity profiles. Most importantly, the medial prefrontal cortex (mPFC) of non-hominoid primates is poorly engaged with the posterior cingulate cortex (PCC), though strong correlated activity between the human PCC and the mPFC is a key feature of the human DMN. Instead, a fronto-temporal resting-state network involving the mPFC was detected consistently across non-hominoid primate species. These common functional features shared between non-hominoid primates but not with humans suggest a substantial gap in the organization of the primate's DMN and its associated cognitive functions.

Keywords: BOLD; CP: Neuroscience; DMN; evolution; fMRI; macaque; marmoset; medial prefrontal cortex; mouse lemur; primates; resting-state.


Conflict of interest statement

Declaration of interests The authors declare no competing interests.

Figures

Figure 1.
Figure 1.. Dictionary learning statistical map of resting-state large-scale networks in four primate species using seven components
Two high-order networks are illustrated for each species: Human (A): default mode and fronto-parietal control networks. Macaque (B), Marmoset (C), Mouse lemur (D): fronto-parietal and fronto-temporal networks. dlPFC, dorso-lateral prefrontal cluster; mPFC, medial prefrontal cluster; PPC, posterior parietal cluster; Temp, temporal cluster; PCC, posterior cingulate cluster.
Figure 2.
Figure 2.. Large-scale network functional atlas of the primate brains
Seven components of the dictionary learning analysis were concatenated and labeled based on their anatomical features in four species: Human functional atlas (A), Macaque (B), Marmoset (C), and Mouse lemur (D). Cerebral clusters were spatially separate (colored dashed line) and were then used to extract their correlation strength with other clusters of interest. dlPFC, dorso-lateral prefrontal cluster; mPFC, medial prefrontal cluster; PPC, posterior parietal cluster; Temp, temporal cluster; PCC, posterior cingulate cluster; prim, primary; sec, secondary, v, ventral, b, basal.
Figure 3.
Figure 3.. Fingerprint analysis between key functional regions of the fronto-parietal network/DMN in humans, macaques, marmosets, and mouse lemurs
Average connectivity pattern of five clusters—PCC (A), mPFC (B), dlPFC (C), PPC (D), and Temporal (E)—was extracted and transformed for fingerprint visualization. To allow comparability between species, correlations were normalized between 0 and 1. The analysis reveals regions in which connectivity was strong in humans and low in NHoPs (as for mPFC-PCC) and regions with high connectivity in NHoPs and low connectivity in humans (as for PCC-dlPFC). For each couple of species, cosine similarity between two fingerprints is evaluated and plotted in matrix form (F). Statistical analysis was performed using permutation tests and plotted in matrix form (G). A low cosine similarity associated to low p value (p < 0.05) suggests differences in connectivity profile. Human PCC, PPC, and mPFC clusters display the lowest cosine values when compared with macaques, marmosets, and mouse lemurs. Globally, fewer profile differences were observed between NHoPs than when any NHoPs were compared to humans. dlPFC, dorso-lateral prefrontal cluster; mPFC, medial prefrontal cluster; PPC, posterior parietal cluster; Temp, temporal cluster; PCC, posterior cingulate cluster.
Figure 4.
Figure 4.. Functional connectivity between key clusters of the fronto-parietal network/DMN in four different primate species
Box plots represent median and interquartile range of correlation coefficients computed between different clusters while the whiskers extend to show the rest of the distribution, except for points that are determined to be outliers. Cerebral clusters were segmented using the functional atlas of each primate species (Figure 2). BOLD signal time course was extracted, and correlation coefficient strengths between PCC or PPC and dlPFC or mPFC functional clusters were reported (each line corresponding to one run). Connectivity between PCC and dlPFC was higher than between PCC and mPFC in macaques, marmosets, and mouse lemurs (A, Macaque; Marmoset; Mouse lemur). The opposite relationship was observed in humans (A, Human). We obtained a similar result by replacing PCC by PPC (B, Human; Macaque; Marmoset; Mouse lemur). Homolog regions were extracted from the human atlas (Glasser et al., 2016), the D99 macaque atlas (Reveley et al., 2017), and the marmoset atlas (Liu et al., 2018): BOLD signal time course was extracted and correlation coefficient strengths between 23b or PG(i) (PCC and PPC region) and area 8Ad (dlPFC) or area 9m (dlPFC and mPFC region) were reported. Connectivity between PCC and 8Ad was higher than between PCC and area 9m in macaques and marmosets (C, Macaque; Marmoset). No difference was observed in humans (C, Human). Connectivity between area PG and 8Ad was higher than between area PG and area 9m in macaques and marmosets (D, Macaque; Marmoset). No difference was observed in humans (D, Human). Anesthesia effect on pairwise correlations in marmosets: the differences between area 23b-8A and 23b-9 or PG-8A and PG-9 connections were preserved in anesthetized conditions (E). Direct comparison of the correlation coefficients between 23b and 8A and 23b-9 in awake and anesthetized conditions (F). Isoflurane decreases the connectivity between both anatomical regions (23b-8A, 23b-9). dlPFC, dorso-lateral prefrontal cluster; mPFC, medial prefrontal cluster; PCC, posterior cingulate cluster; PPC, posterior parietal cluster. *p < 0.05; **p < 0.01, ***p < 0.001, ****p < 0.0001.

References

    1. Anticevic A, Repovs G, Shulman GL, and Barch DM (2010). When less is more: TPJ and default network deactivation during encoding predicts working memory performance. NeuroImage 49, 2638–2648. 10.1016/j.neuroimage.2009.11.008. - DOI - PMC - PubMed
    1. Arsenault JT, Caspari N, Vandenberghe R, and Vanduffel W (2018). Attention shifts recruit the monkey default mode network. J. Neurosci. 38, 1202–1217. 10.1523/JNEUROSCI.1111-17.2017. - DOI - PMC - PubMed
    1. Autio JA, Zhu Q, Li X, Glasser MF, Schwiedrzik CM, Fair DA, Zimmermann J, Yacoub E, Menon RS, Van Essen DC, et al. (2021). Minimal specifications for non-human primate MRI: challenges in standardizing and harmonizing data collection. NeuroImage 236, 118082. 10.1016/j.neuroimage.2021.118082. - DOI - PMC - PubMed
    1. Barks SK, Parr LA, and Rilling JK (2015). The default mode network in chimpanzees (Pan troglodytes) is similar to that of humans. Cereb. Cortex 25, 538–544. 10.1093/cercor/bht253. - DOI - PMC - PubMed
    1. Barttfeld P, Uhrig L, Sitt JD, Sigman M, Jarraya B, and Dehaene S (2015). Signature of consciousness in the dynamics of resting-state brain activity. Proc. Natl. Acad. Sci. U S A. 112, 887–892. 10.1073/pnas.1418031112. - DOI - PMC - PubMed

Publication types

LinkOut - more resources