. 2022 Apr 12;39(2):110649.
doi: 10.1016/j.celrep.2022.110649.

Acute and persistent effects of commonly used antibiotics on the gut microbiome and resistome in healthy adults

Affiliations

Acute and persistent effects of commonly used antibiotics on the gut microbiome and resistome in healthy adults

Winston E Anthony et al. Cell Rep. .

Abstract

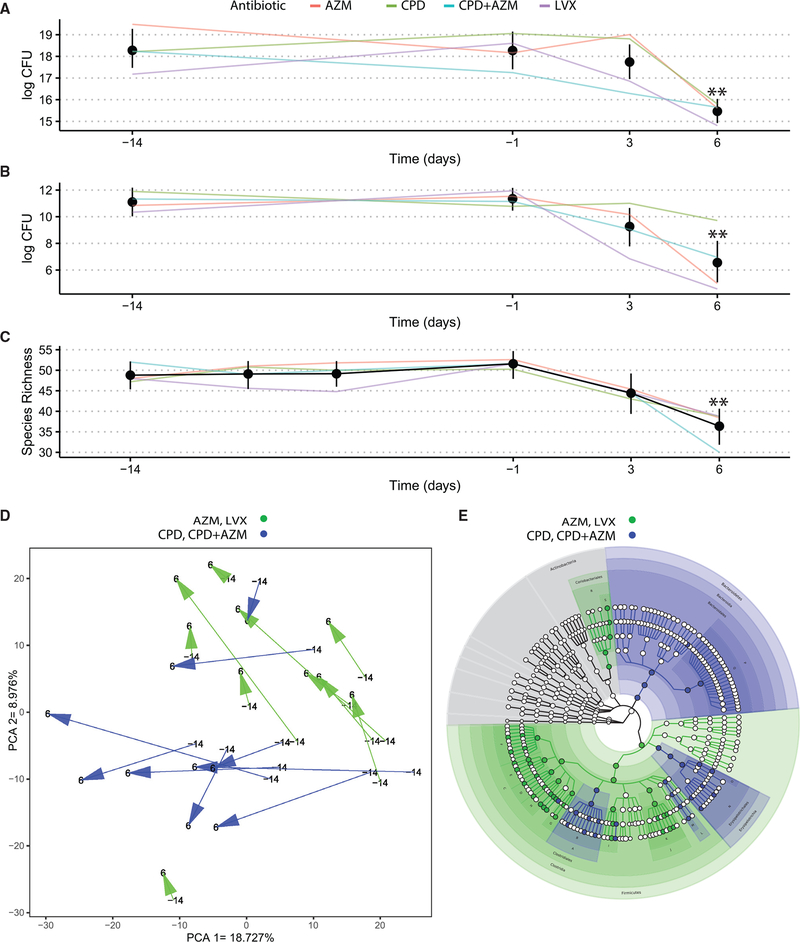
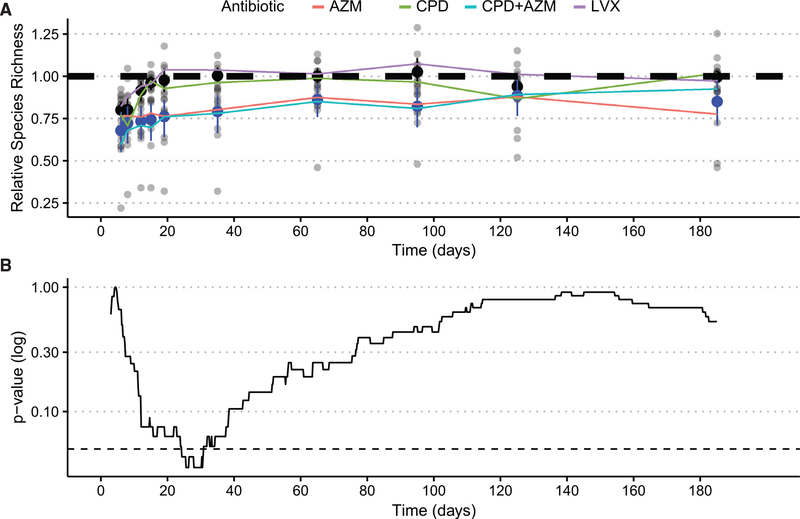
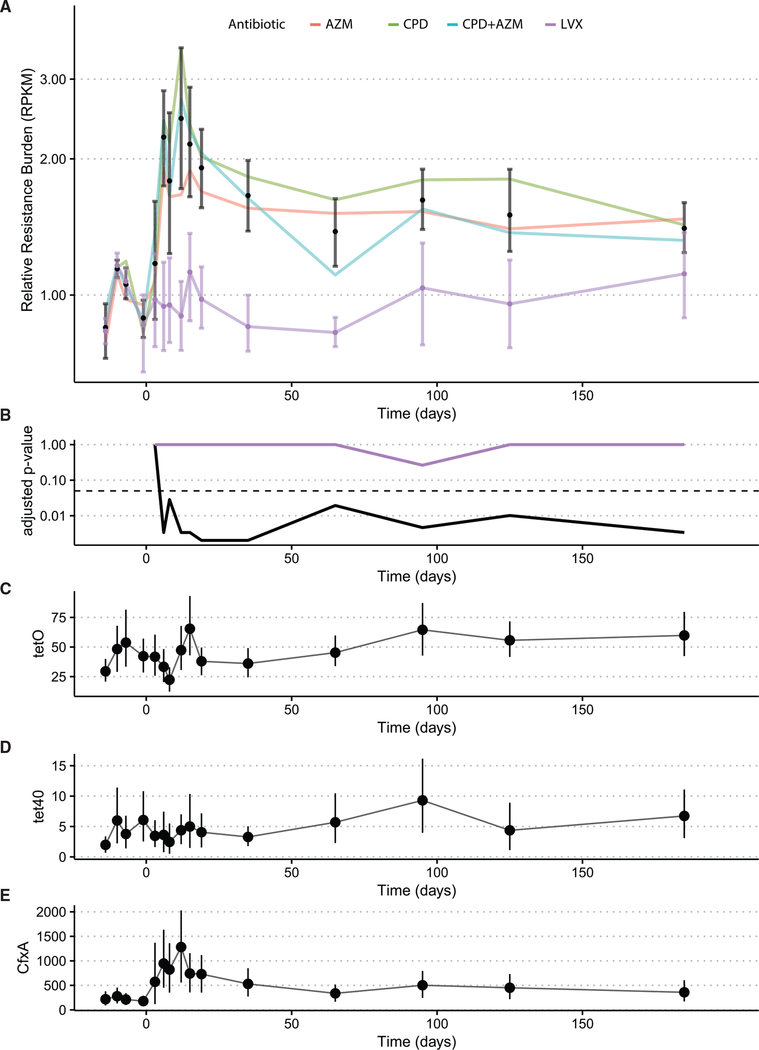
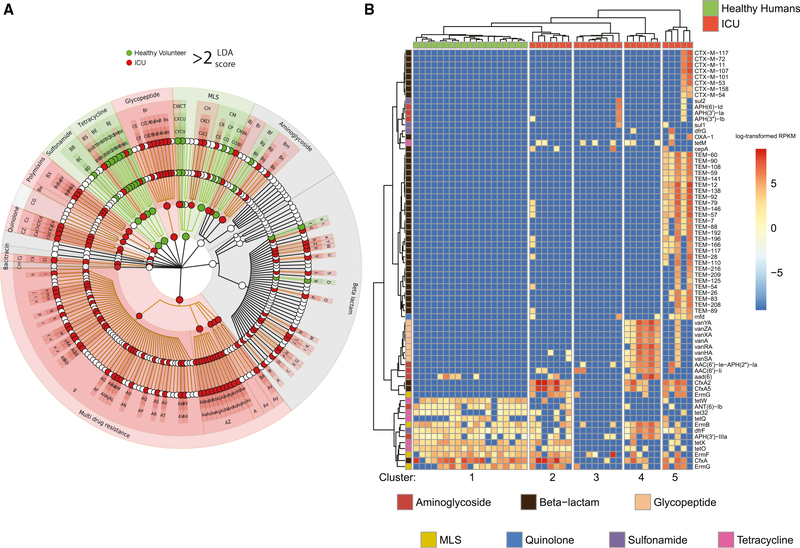
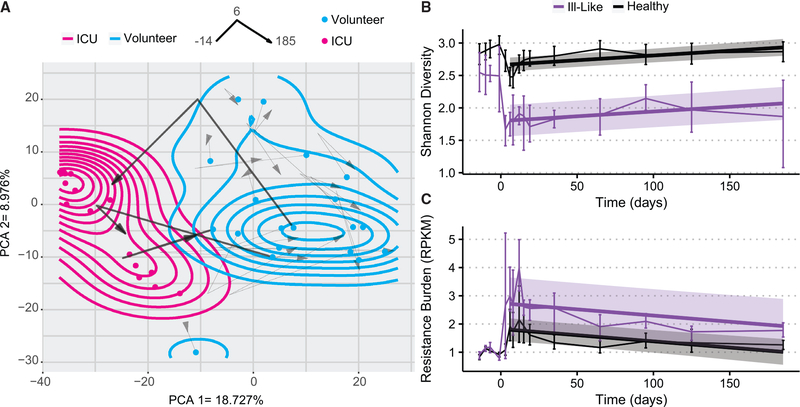
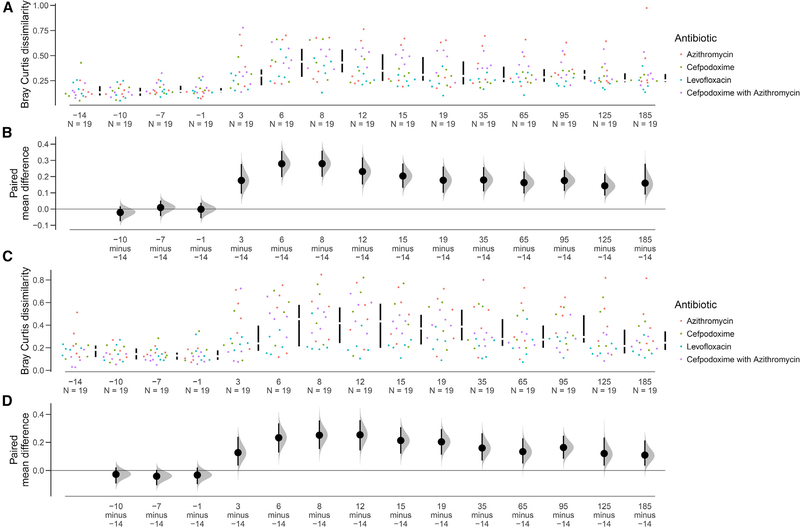
Antibiotics are deployed against bacterial pathogens, but their targeting of conserved microbial processes means they also collaterally perturb the commensal microbiome. To understand acute and persistent effects of antibiotics on the gut microbiota of healthy adult volunteers, we quantify microbiome dynamics before, during, and 6 months after exposure to 4 commonly used antibiotic regimens. We observe an acute decrease in species richness and culturable bacteria after antibiotics, with most healthy adult microbiomes returning to pre-treatment species richness after 2 months, but with an altered taxonomy, resistome, and metabolic output, as well as an increased antibiotic resistance burden. Azithromycin delays the recovery of species richness, resulting in greater compositional distance. A subset of volunteers experience a persistent reduction in microbiome diversity after antibiotics and share compositional similarities with patients hospitalized in intensive care units. These results improve our quantitative understanding of the impact of antibiotics on commensal microbiome dynamics, resilience, and recovery.

Keywords: CP: Microbiology; antibiotic resistance; host-microbe dynamics; microbial pathogenesis; microbiome; population dynamics; therapeutics.


Conflict of interest statement

Declaration of interests The authors declare no competing interests.

Figures

Figure 1.
Figure 1.. Healthy microbiomes are perturbed by antibiotic treatment
(A) Longitudinal tracking of changes in semi-quantitative culturing of aerobic bacteria. All confidence intervals are bootstrapped 95% CI of the mean. Asterisks represent significantly different timepoints (See Tables S3–S5 for p values). (B) Longitudinal tracking of changes in semi-quantitative culturing of anaerobic bacteria. All confidence intervals are bootstrapped 95% CI of the mean. Asterisks represent significantly different timepoints (See Tables S3–S5 for p values). (C) Longitudinal tracking of metagenomic species richness. All confidence intervals are bootstrapped 95% CI of the mean. Asterisks represent significantly different timepoints (See Tables S3–S5 for p values.) (D) The trajectory of the stool samples through the PCA space before and at the end of antibiotic administration. The PCA was generated using all of the sample points, with arrows illustrating volunteer microbiome movement through the PCA space starting at day 14 to day 6. Samples are color-coded by antibiotic—blue for CPD or CPD + AZM and green for AZM or LVX. (E) A cladogram overlaying colors representing significant effect sizes found at each taxonomic level (blue for CPD/CPD + AZM and green for AZM/LVX). See Table S7 for the biomarker legend. Each node denotes a taxonomic unit within the bacterial hierarchy, and when colored, were found to be significantly enriched in the treatment group represented by that color. White nodes represent taxonomic units that were present, but not significantly enriched in either group. See also Figures S1 and S2.
Figure 2.
Figure 2.. The microbiome recovers but is delayed by AZM
(A) Longitudinal recovery of relative species richness after AP. Black confidence intervals in metagenomic data represent bootstrapped 95% confidence intervals for the average of CPD and LVX volunteers at each time point, and blue confidence intervals represent 95% bootstrapped confidence intervals for AZM and XPD + AZM volunteers at each timepoint. The dashed line represents the pre-treatment average species richness. (B) p value significance tests over imputed intervals between LVX and CDP and the AZM and CPD + AZM groups after antibiotic administration. The dashed line represents 0.05 p value significance threshold. See also Figures S3 and S4.
Figure 3.
Figure 3.. Resistance gene burden increases up to 2 months after antibiotic perturbation
(A) Resistance gene burden measured as total reads per kilobase of transcript, per million mapped reads (RPKM) of all resistance markers increases significantly immediately after antibiotic perturbation and then again at day 65. All confidence intervals are bootstrapped 95% CI of the mean. (B) p value compared to first sample point at all time points. Long-term increases in tetracycline resistance after all of the treatments. The dashed line represents the 0.05 p value threshold (see Table S6 for p values). The black line represents the p value over time for AZM-, AZM+CPD-, and CPD-treated volunteers. The purple line represents the p value over time for LVX-treated volunteers. (C–E) Average RPKM with bootstrapped 95% confidence intervals of the genes found to be significantly increased over time. The y axis represents average RPKM. See also Figure S4.
Figure 4.
Figure 4.. The healthy volunteer resistome after AP is distinct from the ICU patient resistome
(A) Cladogram of the antibiotic resistance genes found to be discriminatory between healthy volunteers at day 6 and ICU remnant microbiomes. The ICU microbiomes were highly enriched for multi-drug resistance and efflux pump complexes. The healthy microbiomes were enriched for cfxA resistance and the 23S ribosomal RNA methyltransferase mechanism of macrolide resistance (Au). See Table S8 for the biomarker legend. (B) Heatmap of the 70 most highly variable resistance markers for the same sample set. The healthy volunteer samples cluster together and are largely depleted of the markers representative of the ICU microbiomes. The ICU microbiomes have 4 distinct clusters, which were dominated by distinct sets of variable markers. The scale represents log-transformed RPKM values.
Figure 5.
Figure 5.. A subset of ill-like individuals were heavily perturbed during the study
(A) A 6-month longitudinal analysis of healthy volunteer microbiomes through the PCA space. The red dots are the ICU remnant microbiomes, while the blue dots represent the starting locations of all of the volunteer microbiomes. The arrows represent passage over time of the microbiomes, with the starting point samples at day −14, the inflection point is their location at day 6, and the arrowhead is their location at day 185. All of the volunteer trajectories are present, but the 3 that ended in ICU space are bold. The blue density contour was estimated using the starting coordinates of the volunteer microbiomes and overlaid onto the PCA space, and the magenta contour represents the density of the ICU microbiomes. (B) Longitudinal analysis of overall resistance burden for the ICU-like subset of 3 healthy volunteers (represented in purple) and the rest of the volunteers. The error bar confidence intervals represent 95% bootstrapped confidence intervals of the mean, and a linear model estimate was fit to both groups starting after the end of antibiotic administration. Shaded regions represent 95% confidence interval for the linear fit for each group. (C) The changes over time in species diversity for the ICU-like volunteers and the rest of the volunteers, with a linear model fit to both starting after the end of antibiotic administration. The error bar confidence intervals represent 95% bootstrapped confidence intervals of the mean. Shaded regions represent 95% confidence interval for the linear fit for each group. See also Figure S1.
Figure 6.
Figure 6.. Antibiotic perturbation in the healthy volunteer microbiome
(A and C) Bray-Curtis dissimilarity of each time point to the median of the pre-antibiotic composition. Within-patient Bray-Curtis dissimilarity for all healthy volunteers was compared to the first time point. All time points for the pre-antibiotic period exhibit low dissimilarity, but this increases immediately starting with antibiotic administration and remains high until the end of the study (day 185). This analysis was conducted for species composition (A) and for resistance gene composition (C). (B and D) Bootstrapped 95% confidence intervals generated for data at each time point.

References

    1. Andremont A, Cervesi J, Bandinelli P-A, Vitry F, and De Gunzburg J (2021). Spare and repair the gut microbiota from antibiotic-induced dysbiosis: state-of-the-art. Drug Discov. Today 26, 2159–2163. - PubMed
    1. Angell IL, and Rudi K (2020). A game theory model for gut bacterial nutrient utilization strategies during human infancy. Proc. R. Soc. B: Biol. Sci. 287, 20200824. - PMC - PubMed
    1. Anthony WE, Burnham C-AD, Dantas G, and Kwon JH (2020). The gut microbiome as A reservoir for antimicrobial resistance. J. Infect. Dis. 223, S209–S213. - PMC - PubMed
    1. Araos R, Battaglia T, Ugalde JA, Rojas-Herrera M, Blaser MJ, and D’agata EMC (2019). Fecal microbiome characteristics and the resistome associated with acquisition of multidrug-resistant organisms among elderly subjects. Front. Microbiol. 10, 2260. - PMC - PubMed
    1. Asnicar F, Weingart G, Tickle TL, Huttenhower C, and Segata N (2015). Compact graphical representation of phylogenetic data and metadata with GraPhlAn. PeerJ 3, e1029. - PMC - PubMed

Publication types

Substances