. 2022 Apr 14;20(1):156.
doi: 10.1186/s12916-022-02318-z.

Predicting the earliest deviation in weight gain in the course towards manifest overweight in offspring exposed to obesity in pregnancy: a longitudinal cohort study

Affiliations

Predicting the earliest deviation in weight gain in the course towards manifest overweight in offspring exposed to obesity in pregnancy: a longitudinal cohort study

Delphina Gomes et al. BMC Med. .

Abstract

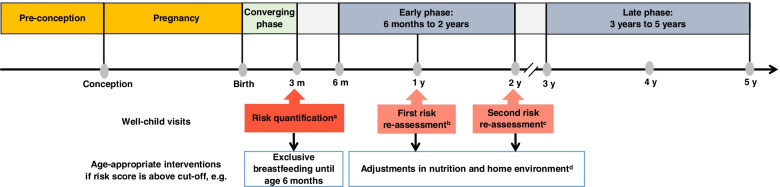
Background: Obesity in pregnancy and related early-life factors place the offspring at the highest risk of being overweight. Despite convincing evidence on these associations, there is an unmet public health need to identify "high-risk" offspring by predicting very early deviations in weight gain patterns as a subclinical stage towards overweight. However, data and methods for individual risk prediction are lacking. We aimed to identify those infants exposed to obesity in pregnancy at ages 3 months, 1 year, and 2 years who likely will follow a higher-than-normal body mass index (BMI) growth trajectory towards manifest overweight by developing an early-risk quantification system.

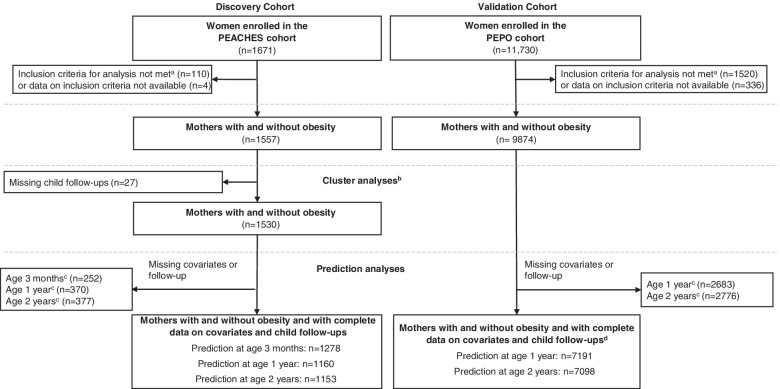
Methods: This study uses data from the prospective mother-child cohort study Programming of Enhanced Adiposity Risk in CHildhood-Early Screening (PEACHES) comprising 1671 mothers with pre-conception obesity and without (controls) and their offspring. Exposures were pre- and postnatal risks documented in patient-held maternal and child health records. The main outcome was a "higher-than-normal BMI growth pattern" preceding overweight, defined as BMI z-score >1 SD (i.e., World Health Organization [WHO] cut-off "at risk of overweight") at least twice during consecutive offspring growth periods between age 6 months and 5 years. The independent cohort PErinatal Prevention of Obesity (PEPO) comprising 11,730 mother-child pairs recruited close to school entry (around age 6 years) was available for data validation. Cluster analysis and sequential prediction modelling were performed.

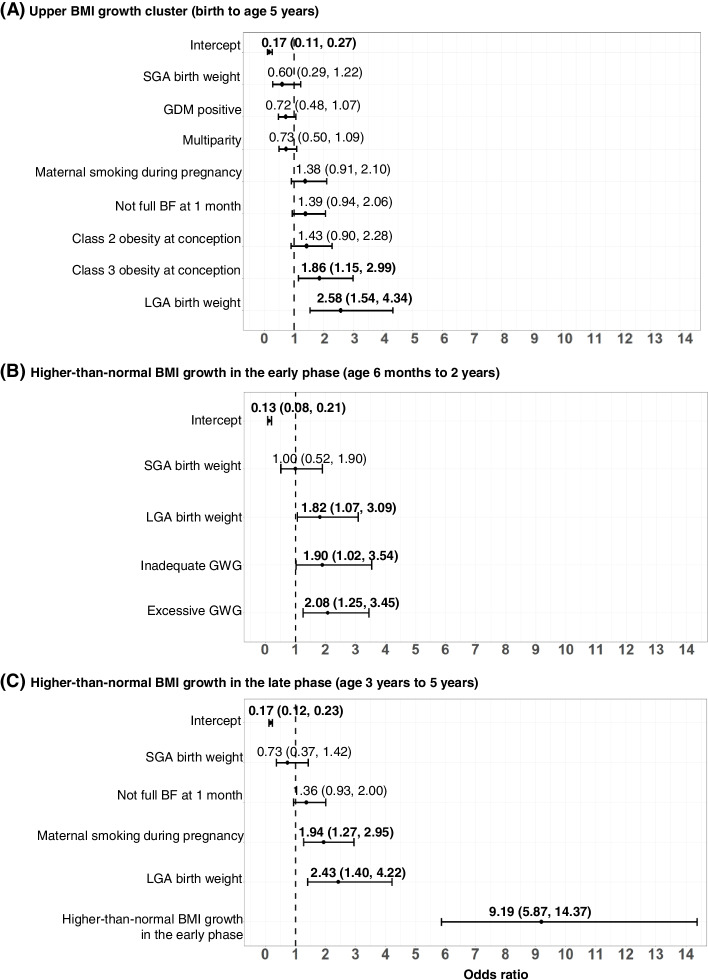
Results: Data of 1557 PEACHES mother-child pairs and the validation cohort were analyzed comprising more than 50,000 offspring BMI measurements. More than 1-in-5 offspring exposed to obesity in pregnancy belonged to an upper BMI z-score cluster as a distinct pattern of BMI development (above the cut-off of 1 SD) from the first months of life onwards resulting in preschool overweight/obesity (age 5 years: odds ratio [OR] 16.13; 95% confidence interval [CI] 9.98-26.05). Contributing early-life factors including excessive weight gain (OR 2.08; 95% CI 1.25-3.45) and smoking (OR 1.94; 95% CI 1.27-2.95) in pregnancy were instrumental in predicting a "higher-than-normal BMI growth pattern" at age 3 months and re-evaluating the risk at ages 1 year and 2 years (area under the receiver operating characteristic [AUROC] 0.69-0.79, sensitivity 70.7-76.0%, specificity 64.7-78.1%). External validation of prediction models demonstrated adequate predictive performances.

Conclusions: We devised a novel sequential strategy of individual prediction and re-evaluation of a higher-than-normal weight gain in "high-risk" infants well before developing overweight to guide decision-making. The strategy holds promise to elaborate interventions in an early preventive manner for integration in systems of well-child care.

Keywords: BMI growth; Early prevention; Early weight gain; Infancy; Maternal pre-conception obesity; Repeated risk assessment; Sequential prediction; Subclinical stage.


Conflict of interest statement

The authors declare that they have no competing interests.

Figures

Fig. 1
Fig. 1
Flow chart of the study populations. aDid not meet inclusion criteria for analysis, i.e., pre-conception obesity, overweight, or normal weight, full-term (≥37 weeks 0 days of gestation) singleton live birth, or absence of T1D/T2D. bIdentification of BMI growth clusters was not performed in the PEPO cohort due to limited offspring follow-up time points. BMI growth clusters identified in the PEACHES cohort were validated in the PEPO cohort. cMissing information on at least one of the potential prenatal and postnatal predictors including maternal pre-conception BMI group, total GWG, GDM, parity, smoking during pregnancy, sex, birth weight category for gestational age and sex, SES, breastfeeding status at 1, 3, and 6 months, and/or on offspring BMI status at the respective prediction time point. dExternal validation of prediction models at age 3 months was not performed due to unavailability of offspring BMI data at age 3 months in the PEPO cohort. BMI, body mass index; GDM, gestational diabetes; GWG, gestational weight gain; PEACHES, Programming of Enhanced Adiposity Risk in CHildhood–Early Screening; PEPO, PErinatal Prevention of Obesity; SES, socioeconomic status; T1D, type 1 diabetes; T2D, type 2 diabetes
Fig. 2
Fig. 2
BMI growth patterns in young offspring of mothers with and without obesity. Shown are individual BMI z-score growth curves from birth to age 5 years in offspring of mothers with obesity (panel A) and without (panel B) enrolled in the PEACHES cohort study. Mean BMI z-score growth clusters along with their 95% CI are presented for offspring of mothers with obesity (panel C) and without (panel D). BMI, body mass index; PEACHES, Programming of Enhanced Adiposity Risk in CHildhood–Early Screening
Fig. 3
Fig. 3
Effects of prenatal and postnatal factors on BMI growth outcomes in offspring of mothers with obesity. Shown are ORs and 95% CI of the influence of prenatal and postnatal factors on the development of an upper cluster of BMI growth (birth to age 5 years, panel A) and a “higher-than-normal BMI growth pattern,” defined as BMI z-score >1 SD [51] at least twice, during early phase (6 months to 2 years, panel B) and late phase (3 to 5 years, panel C) in offspring of mothers with obesity enrolled in the PEACHES cohort study. Values were derived from multivariable logistic regression with stepwise backward selection. Only final models based on the lowest Akaike information criterion are presented. Included variables in all initial models were maternal pre-conception BMI group, total GWG, GDM, parity, smoking during pregnancy, sex, birth weight category for gestational age and sex, SES, breastfeeding status at 1 month. Additionally, for associations shown in panel C, “higher-than-normal BMI growth pattern” in the early phase was also included as an explanatory variable in the initial model. BMI, body mass index; BF, breastfeeding; CI, confidence interval; GDM, gestational diabetes; GWG, gestational weight gain; LGA, large-for-gestational-age; OR, odds ratio; PEACHES, Programming of Enhanced Adiposity Risk in CHildhood–Early Screening; SES, socioeconomic status; SGA, small-for-gestational-age
Fig. 4
Fig. 4
Prediction-guided prevention strategy for the risk of developing a “higher-than-normal BMI growth pattern” preceding overweight. “Higher-than-normal BMI growth pattern” defined as BMI z-score >1 SD [51] at least twice in relevant growth phases from 6 months to 5 years. aInitial risk quantification is performed at the 3-month well-child visit for “higher-than-normal BMI growth pattern” during the early phase (6 months to 2 years). bFirst risk re-assessment is performed at the 1-year visit for “higher-than-normal BMI growth pattern” during the late phase (3 to 5 years). cSecond risk re-assessment is performed at the 2-year visit for “higher-than-normal BMI growth pattern” during the late phase (3 to 5 years). dOverweight-preventive measures such as healthier complementary and family food choices, reduced screen time, increased physical activity, and a sleep duration of 10 to 14 h per day. If a risk score is above or equal to the respective cut-off score value (Table 2, Additional file 1: Table S4), the child is at risk of developing a “higher-than-normal BMI growth pattern,” and age-appropriate obesity-preventive measures should be initiated by the pediatrician. BMI, body mass index; h, hours; m, months; y, year(s)

References

    1. NCD Risk Factor Collaboration (NCD-RisC). Worldwide trends in body-mass index, underweight, overweight, and obesity from 1975 to 2016: a pooled analysis of 2416 population-based measurement studies in 128.9 million children, adolescents, and adults. Lancet. 2017;390(10113):2627-42. - PMC - PubMed
    1. Llewellyn A, Simmonds M, Owen CG, Woolacott N. Childhood obesity as a predictor of morbidity in adulthood: a systematic review and meta-analysis. Obes Rev. 2016;17(1):56–67. doi: 10.1111/obr.12316. - DOI - PubMed
    1. Geserick M, Vogel M, Gausche R, Lipek T, Spielau U, Keller E, et al. Acceleration of BMI in early childhood and risk of sustained obesity. N Engl J Med. 2018;379(14):1303–1312. doi: 10.1056/NEJMoa1803527. - DOI - PubMed
    1. Gillman MW. Early infancy - a critical period for development of obesity. J Dev Orig Health Dis. 2010;1(5):292–299. doi: 10.1017/S2040174410000358. - DOI - PMC - PubMed
    1. Zheng M, Lamb KE, Grimes C, Laws R, Bolton K, Ong KK, et al. Rapid weight gain during infancy and subsequent adiposity: a systematic review and meta-analysis of evidence. Obes Rev. 2018;19(3):321–332. doi: 10.1111/obr.12632. - DOI - PMC - PubMed

Publication types