. 2022 Apr 13;13(1):1983.
doi: 10.1038/s41467-022-29516-w.

PD-L1 and ICOSL discriminate human Secretory and Helper dendritic cells in cancer, allergy and autoimmunity

Affiliations

PD-L1 and ICOSL discriminate human Secretory and Helper dendritic cells in cancer, allergy and autoimmunity

Caroline Hoffmann et al. Nat Commun. .

Abstract

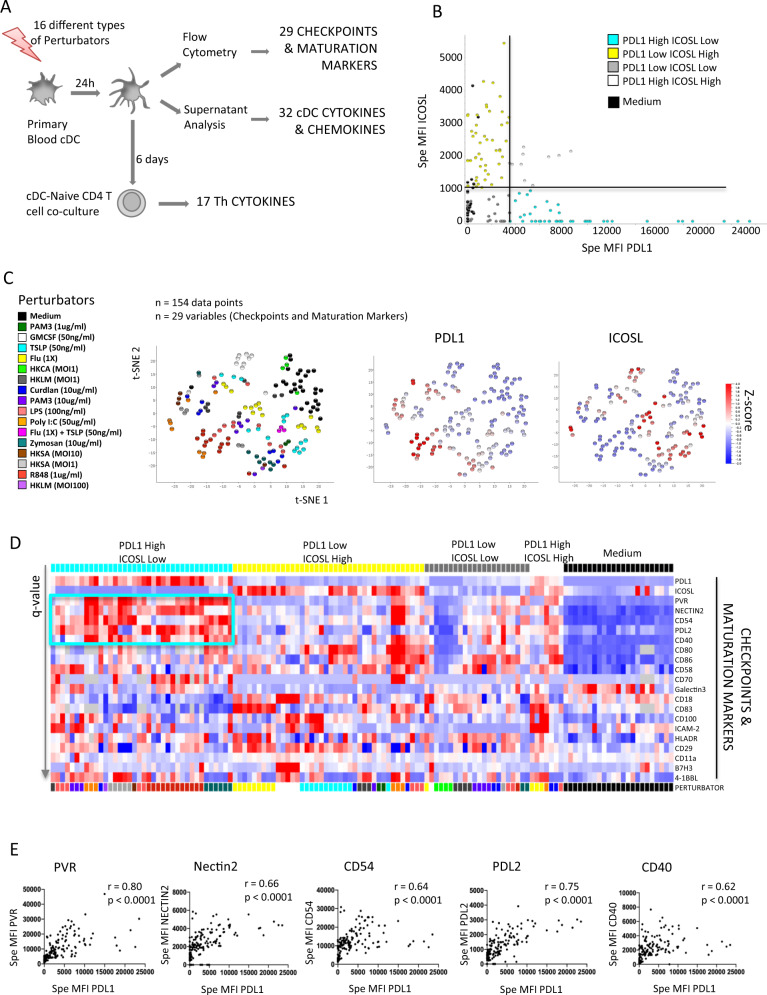
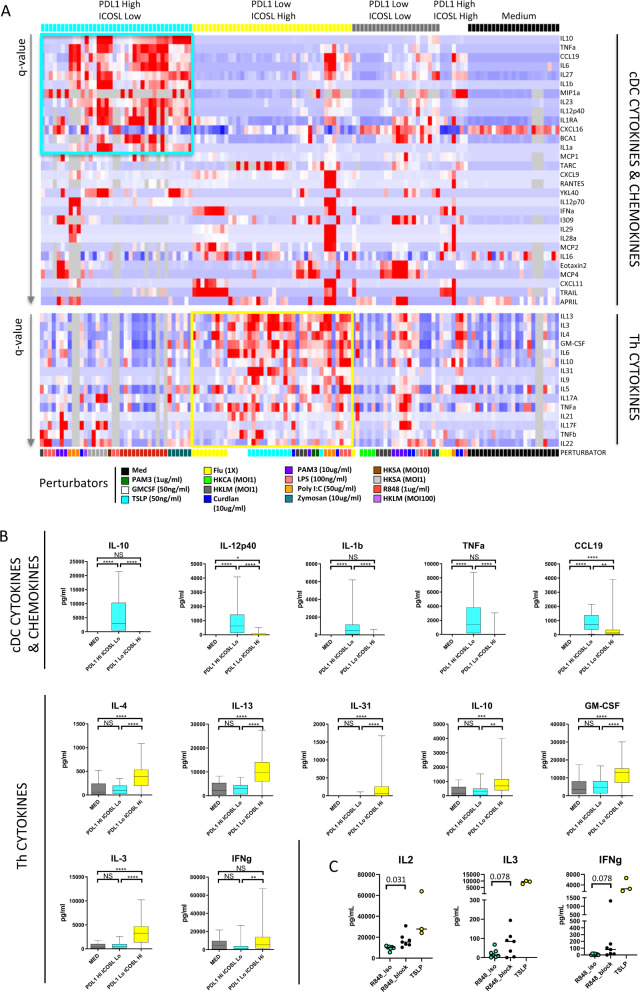
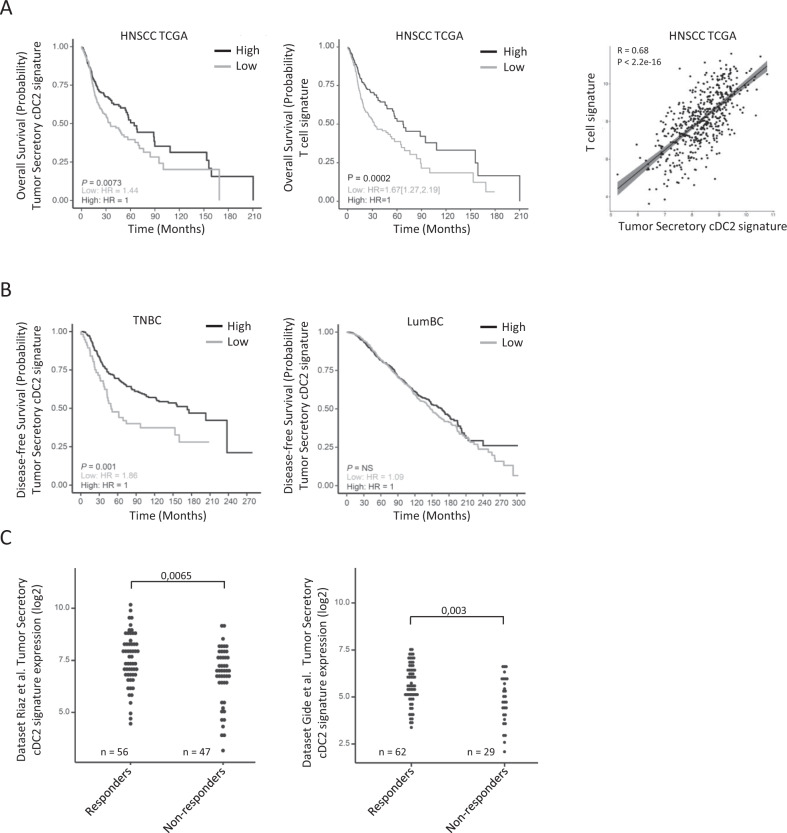
Dendritic cells (DC) are traditionally classified according to their ontogeny and their ability to induce T cell response to antigens, however, the phenotypic and functional state of these cells in cancer does not necessarily align to the conventional categories. Here we show, by using 16 different stimuli in vitro that activated DCs in human blood are phenotypically and functionally dichotomous, and pure cultures of type 2 conventional dendritic cells acquire these states (termed Secretory and Helper) upon appropriate stimuli. PD-L1highICOSLlow Secretory DCs produce large amounts of inflammatory cytokines and chemokines but induce very low levels of T helper (Th) cytokines following co-culturing with T cells. Conversely, PD-L1lowICOSLhigh Helper DCs produce low levels of secreted factors but induce high levels and a broad range of Th cytokines. Secretory DCs bear a single-cell transcriptomic signature indicative of mature migratory LAMP3+ DCs associated with cancer and inflammation. Secretory DCs are linked to good prognosis in head and neck squamous cell carcinoma, and to response to checkpoint blockade in Melanoma. Hence, the functional dichotomy of DCs we describe has both fundamental and translational implications in inflammation and immunotherapy.

Trial registration: ClinicalTrials.gov NCT03017573.


Conflict of interest statement

M.G. is currently employed by the company Generate Biomedicines. The remaining authors declare no competing interests.

Figures

Fig. 1
Fig. 1. T-cell-inflamed head and neck squamous cell carcinoma are enriched in cDC expressing PD-L1high and ICOSLlow/neg.
Phenotypic characterization of 22 human head and neck squamous cell carcinoma (HNSCC) primary tumor-infiltrating cells. A Multicolor flow cytometry (FC) analysis scheme. B Myeloid cell panel gating strategy for the CD45+CD3CD16CD19 (Lin) compartment (initial gates in Supplementary Fig. 2A). MMAC monocytes and macrophages, DN DC/MMAC double negative population. C Percentage of CD3-positive cells among live cells, bar represents median. D Heatmap representing the normalized values of the parameters (columns) with a Spearman correlation coefficient (r) over 0.3 (left) or under −0.3 (right) for the 22 tumors (rows) ordered from top to bottom by decreasing CD3/Live normalized value. Dark gray cells represent missing values. T T cells, pDC plasmacytoid DC, DR HLA-DR, Neutrophils_e neutrophils enriched, DN MAIT, NKT, T CD4CD8 MAIT, Natural Killer T, and T cells, respectively. E Representative staining of PD-L1 (left), ICOSL (center), and PD-L1 versus ICOSL (right) in CD11c+DR+ cells in a CD3 high tumor (top), CD3 low tumor (middle) from the cohort in D, and blood from a healthy donor (bottom); the percentage of positive cells was measured based on antibody (Ab) as compared to isotype (Iso).
Fig. 2
Fig. 2. PD-L1 and ICOSL expression on mature blood cDC are exclusive and PD-L1high DC overexpress PVR, Nectin2, CD54, CD40, and PD-L2.
A Methods for the in vitro analysis of primary blood cDC. B Expression of PD-L1(x) vs ICOSL(y) on cDC at H24. 154 individual tests were annotated according to their expression of PD-L1 as high/low and ICOSL high/low with the thresholds of specific mean fluorescence intensity (MFI) at 3500 and 1000, respectively. C T-SNE of the 29 surface markers colored by stimuli (left), PD-L1 specific MFI (center), and ICOSL-specific MFI (right) using Qlucore software, n = 154. D Heatmap representing the expression of the 29 surface markers in the four groups defined by PD-L1 and ICOSL in “B”, and in Medium condition. Multigroup comparison by Kruskal–Wallis test and Tukey post-hoc test. Only the variables significant at a p-value < 0.05 are represented and ordered by increasing q-value (max q-value = 0.046), among 130 individual experiments, ordered as in Fig. 3A. E Correlation of PD-L1 (x) with PVR, Nectin2, CD54, PD-L2, and CD40 (y). ≪r≫ values are Spearman correlation coefficients, p-value are for two-sided statistical analyses, n = 154. TSLP thymic stromal lymphopoietin, Flu influenza, HKCA heat-killed Candida albicans, HKLM heat-killed Listeria monocytogenes, HKSA heat-killed Staphylococcus aureus, LPS lipopolysaccharide.
Fig. 3
Fig. 3. PD-L1 and ICOSL expression pattern characterize Secretory and Helper cDC.
A Heatmaps representing the cytokines and chemokines secreted by the cDC measured in H24 supernatants (top), and the CD4 Th cell cytokines measured after co-culture (bottom) in the 4 groups defined by PD-L1 and ICOSL expression and Medium condition. Only the variables significant at a p-value < 0.05 after Kruskal–Wallis test on the 5 groups and Tukey post-hoc tests are represented and ordered by increasing q-value (max q-value = 0.035 (top) and 0.055 (bottom)), among 130 individual experiments, ordered as in Fig. 2D. Cells in gray are missing values. Abbreviations for the perturbators: see Fig. 2. B Quantification of cytokines and chemokines secreted by the DC (top row) and of the CD4 Th cell cytokines (2 bottom rows) in the Medium (n = 23), PD-L1high ICOSLlow (n = 38), and PD-L1low ICOSLhigh (n = 40) conditions (two-sided Kruskal–Wallis test on the 3 groups and Dunn’s multiple comparison test). Central line represents median, box represents quartiles, whiskers represent min to max. p values are represented by range: *<0.05, **<0.01, ***<0.001, ****<0.0001. NS not significant. MED medium, Hi high, Lo low. C Quantification of cytokines secreted by the CD4 Th cytokines after co-culture with pure cDC2 sorted as in Supplementary Fig. 5A and treated with R848 (Secretory) or Thymic stromal lymphopoietin (TSLP) (Helper, n = 3). For the R848-cDC2 the co-culture was performed in the presence of PD-1; IL-10; IL-10R; IL-4R; TIGIT multiple blockings “R848_block” or the corresponding isotypes “R848_Iso” (n = 7, two-sided Wilcoxon test). Bar represents median. Source data are provided as a Source Data file.
Fig. 4
Fig. 4. RNAseq of tumor and blood cDC2 confirms that T-cell-inflamed HNSCC are infiltrated by Secretory DC.
A Analysis of differentially expressed genes (DEG) by DESeq2 between HNSCC tumor (n = 6) and blood cDC2 (n = 3). B Analysis of DEG from dataset GS87442 by DESeq2 between unstimulated cell and pRNA, a TLR7/8 ligand (left) or GM-CSF (center) and pRNA vs GM-CSF (right). C Venn diagram of upregulated genes identified in “B”. The blue and the yellow-colored area contain the genes of the Secretory and Helper signatures, respectively. D Venn diagram of the 639 tumor cDC2 upregulated genes with the Secretory and Helper signatures defined in “C”. E Supervised analysis of the 135 genes shared between tumor and pRNA “secretory” signature (light blue), 440 tumor specific genes (black), and the 64 genes shared between tumor and GM-CSF (yellow), using 3 gene lists: checkpoint and maturation markers (left, 148 genes), cytokines and chemokines (center, 169 genes), NFkB pathway (right, 100 genes). F Expression of selected genes in cDC2 from tumors and blood of HNSCC patients, central lines represent mean.
Fig. 5
Fig. 5. Tumor secretory cDC2 are associated to good prognosis in inflamed cancers and to response to immunotherapy.
A Survival analysis among patients expressing high (black) and low (gray) levels of the 36-gene tumor secretory cDC2 signature (left) and T cell signature (center) (cutoff at median, log-rank test), among 500 non-metastatic HNSCC patients from The Cancer Genome Atlas (TCGA). Right: Pearson correlation between the 2 signatures in the same dataset. Line represents linear regression; grey zone represents 95% confidence interval. p-value is for two-sided statistical analysis. B Survival analysis as in A left for 318 triple negative breast cancer (TNBC) patients (left) and 1407 luminal breast cancer (LumBC) patients (right) from METABRIC dataset. A, B: HR hazard ratio, NS not significant. C Tumor secretory cDC2 signature expression among responders and non-responders melanoma patients treated by immune checkpoint blockade from previous studies (left) and (right), two-sided Mann–Whitney tests.
Fig. 6
Fig. 6. Tumor secretory cDC align with the mature migratory cDC subset in HNSCC.
A UMAP of the 10,503 cells analyzed by single-cell RNA sequencing displayed in 24 clusters. B, C Analysis of the 6 cDC/MMAC clusters as per 6A. B UMAP per cluster and expression of selected genes and antibody-derived tags (ADT). ADT staining was not present in all samples, see Methods for details. C Expression of the Tumor Secretory cDC2 signature. CD4 CD4 T cells, Conv conventional, TReg regulatory T cells, CD8 CD8 T cells, NK natural killer cells, pDC plasmacytoid DC, MMAC monocytes and macrophages.
Fig. 7
Fig. 7. HNSCC secretory cDC have an increased cell–cell communication network.
Cell–cell communication analysis using ICELLNET of cluster #7 and #20 as central cells in relation to other cell subsets of the tumor microenvironment. Cluster #19 of red blood cell was excluded from the analysis. A Networks. Interactions scores were normalized in a 0–10 scale represented by arrows. B Bar plots per interaction types. Bars are paired with the left bar being cluster #7 and the right cluster #20 that interact with the clusters numbered on the x-axis. Scores represent the sum of each individual interaction for each cluster–cluster interaction. C Table of selected interactions. Abbreviations: same as in Fig. 6.
Fig. 8
Fig. 8. Secretory cDC but not helper cDC infiltrate tissues in cancer and autoimmunity.
A UMAP of 6504 cDC merged from 6 datasets, (see Supplementary Data 15). B Heatmap of selected maturation genes per log2FC values. C Cluster annotation and distribution per sample type. PBMC peripheral blood mononuclear cells, HD healthy donor, HNSCC head and neck squamous cell carcinoma, Juxta juxtatumor, Tum tumor, NSCLC non-small cell lung cancer, LBC luminal breast cancer, AD atopic dermatitis. D Expression of the Tumor Secretory cDC2 (left), pRNA Secretory DC (middle), and GM-CSF Helper DC (right) signatures (n = 6504 cDC; ANOVA results are in Supplementary Data 22). E Pearson correlation between the Mature Migratory cDC signature derived from single-cell data and the T cell signature, among 500 non-metastatic HNSCC patients from the The Cancer Genome Atlas (TCGA). Line represents linear regression; gray zone represents 95% confidence interval, p-value is for two-sided statistical analyses. F Pseudotime analysis using Monocle 3 plotted on UMAP from A, with cluster #2 as origin, and excluding clusters #3, 5, 9, 10.

References

    1. Banchereau J, Steinman RM. Dendritic cells and the control of immunity. Nature. 1998;392:245–252. - PubMed
    1. Gaurav R, Agrawal DK. Clinical view on the importance of dendritic cells in asthma. Expert. Rev. Clin. Immunol. 2013;9:899–919. - PMC - PubMed
    1. Dudek AM, Martin S, Garg AD, Agostinis P. Immature, semi-mature, and fully mature dendritic cells: toward a DC-cancer cells interface that augments anticancer immunity. Front. Immunol. 2013;4:438. - PMC - PubMed
    1. Li Q, Guo Z, Xu X, Xia S, Cao X. Pulmonary stromal cells induce the generation of regulatory DC attenuating T-cell-mediated lung inflammation. Eur. J. Immunol. 2008;38:2751–2761. - PubMed
    1. Gardner A, de Mingo Pulido Á, Ruffell B. Dendritic cells and their role in immunotherapy. Front. Immunol. 2020;11:924. - PMC - PubMed

Publication types

Associated data