. 2022 Apr 13;13(1):1985.
doi: 10.1038/s41467-022-29659-w.

Sympathetic axonal sprouting induces changes in macrophage populations and protects against pancreatic cancer

Affiliations

Sympathetic axonal sprouting induces changes in macrophage populations and protects against pancreatic cancer

Jérémy Guillot et al. Nat Commun. .

Abstract

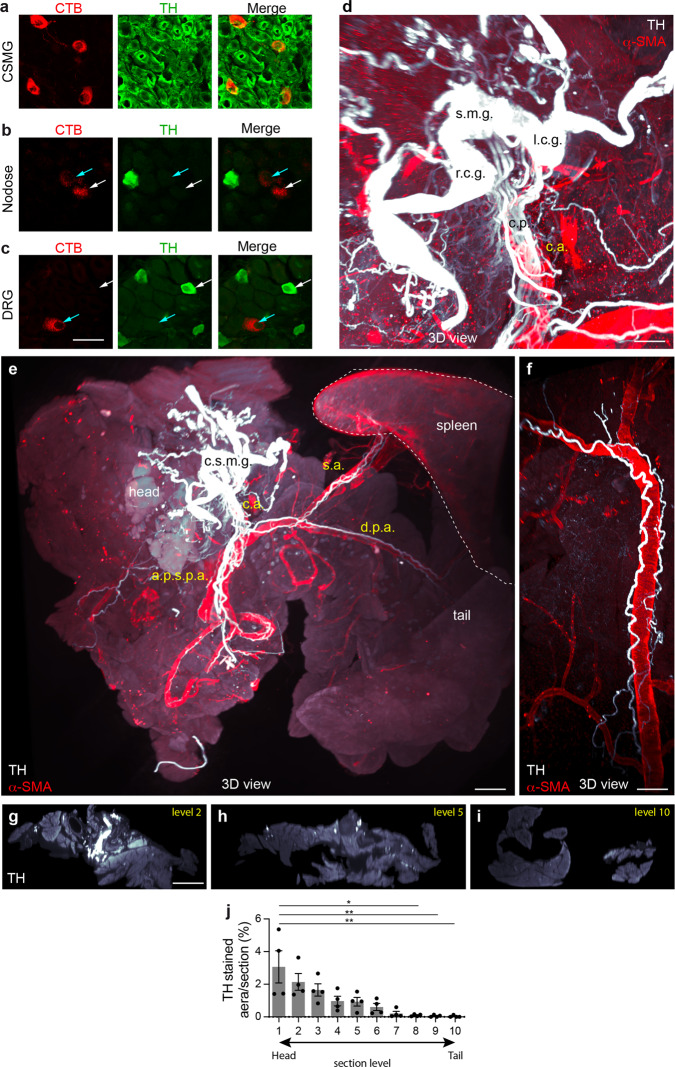
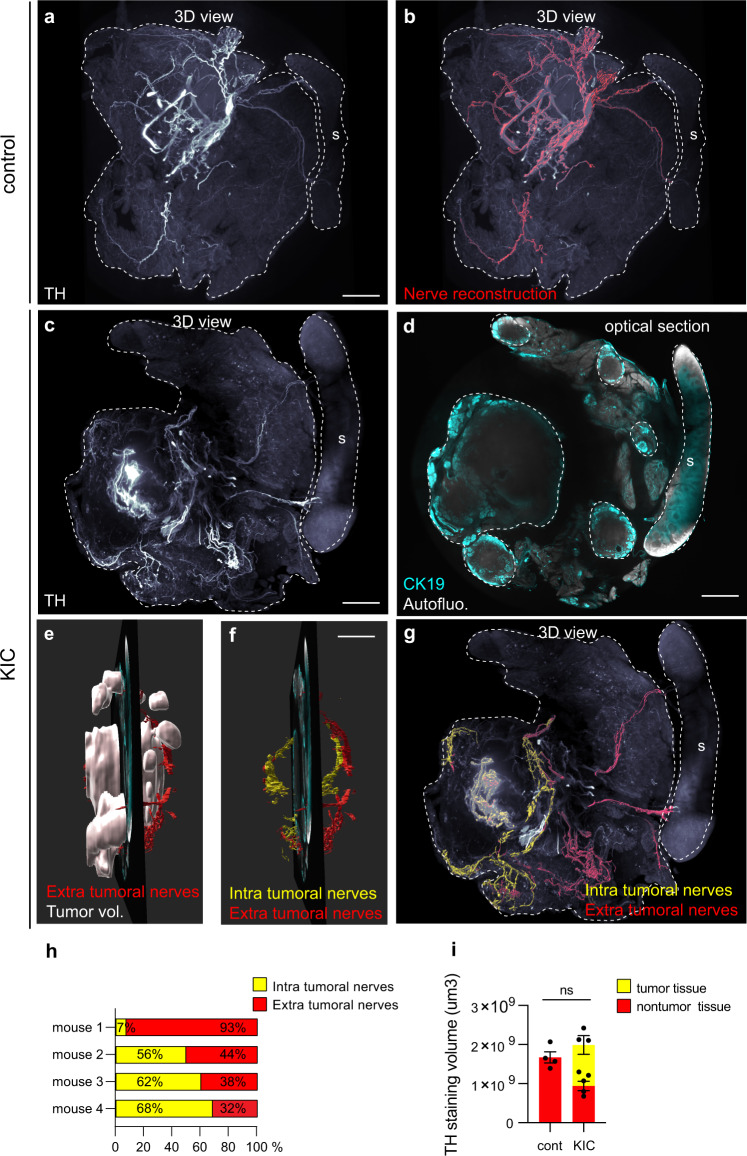
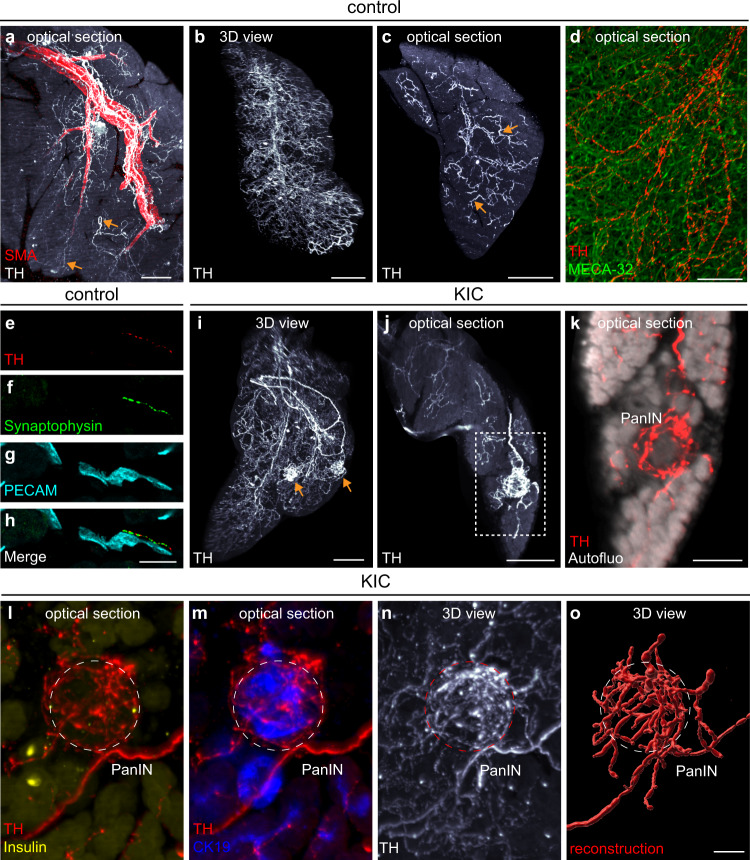
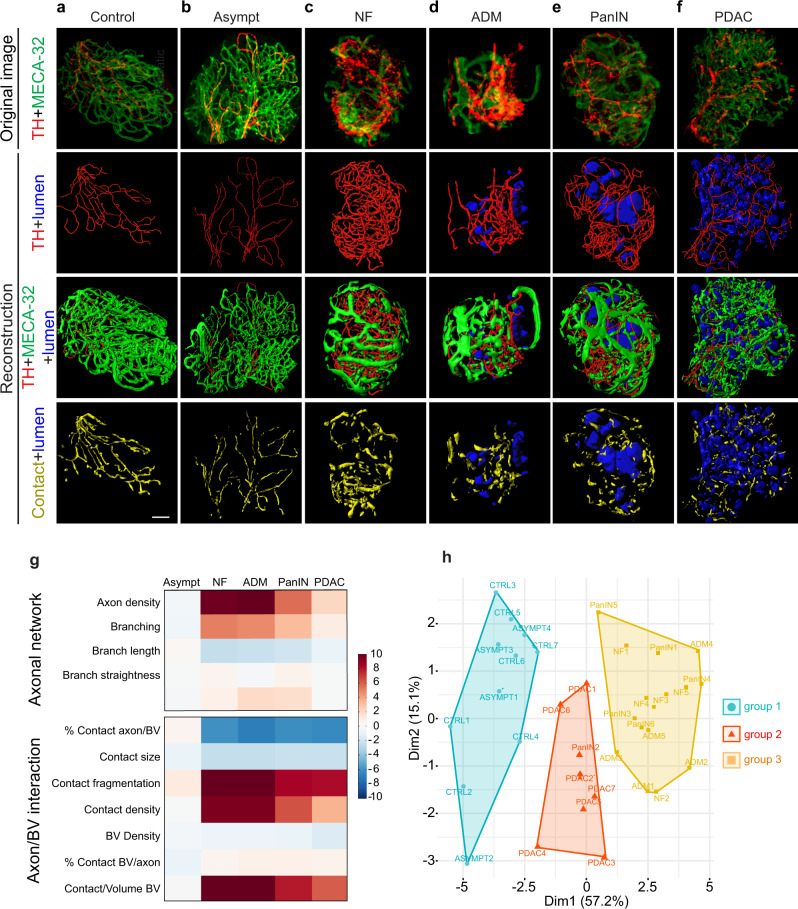
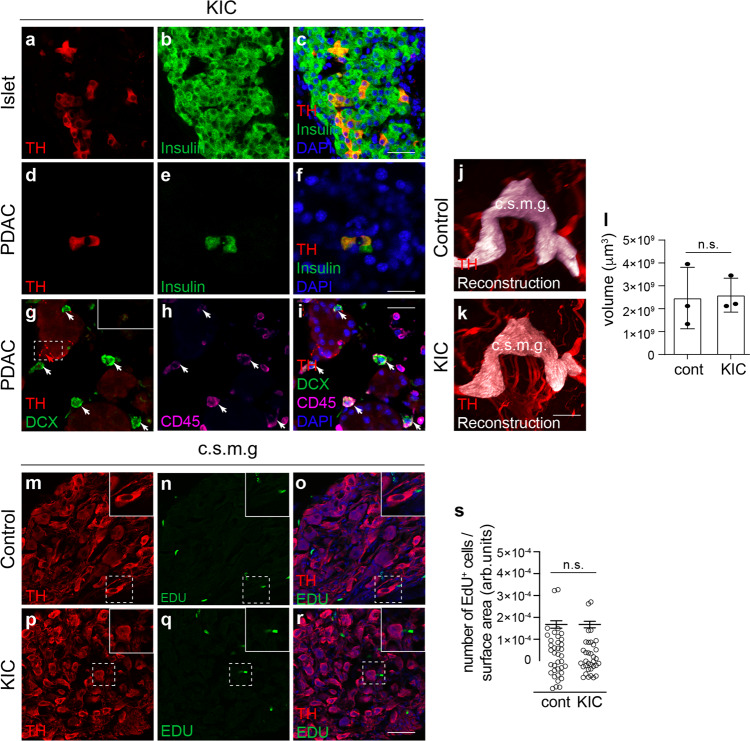
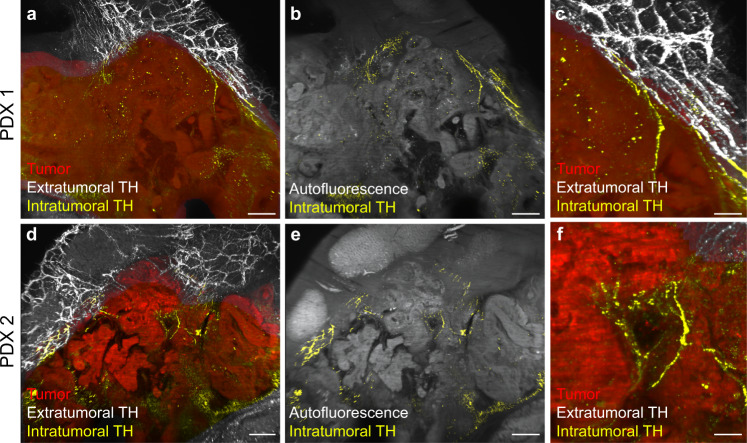
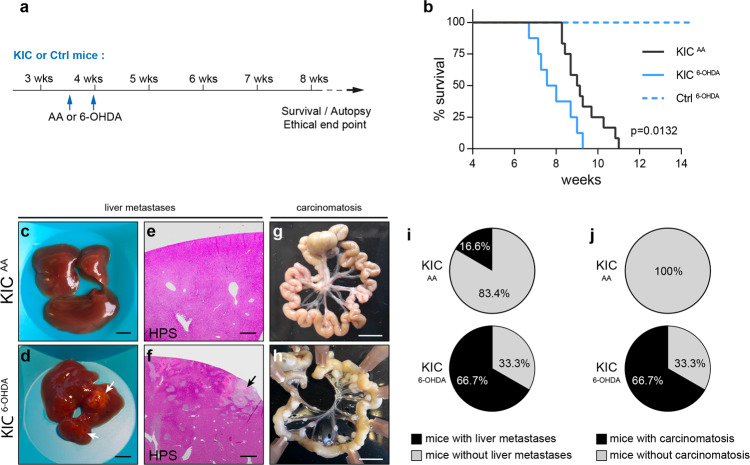
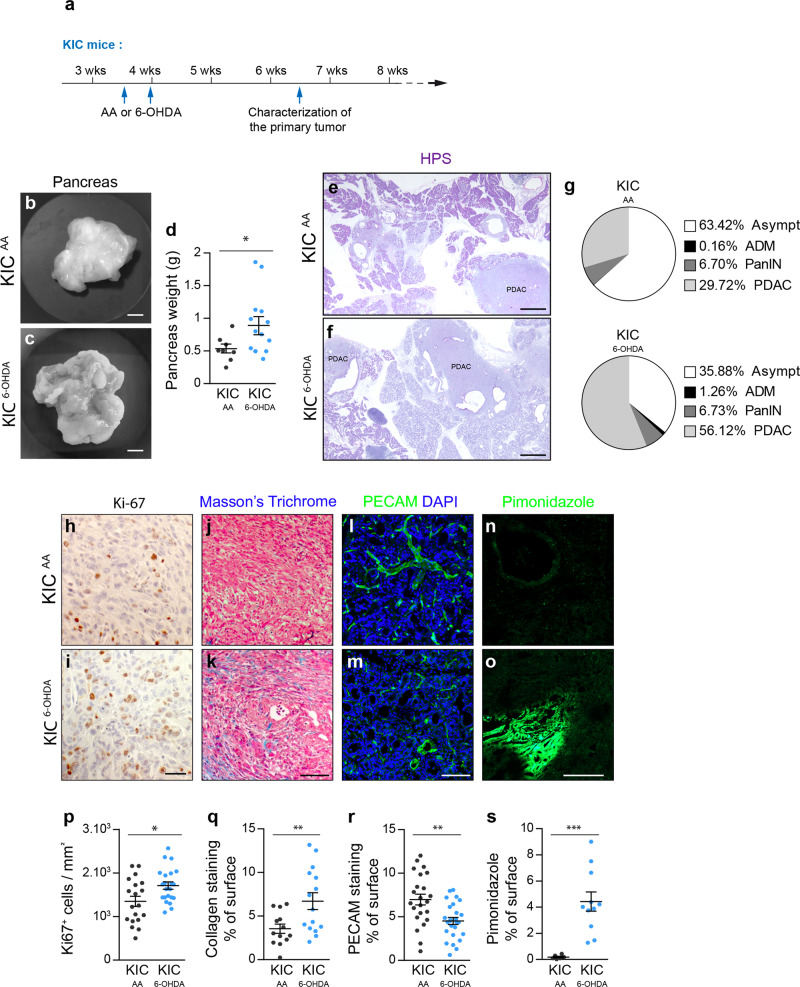
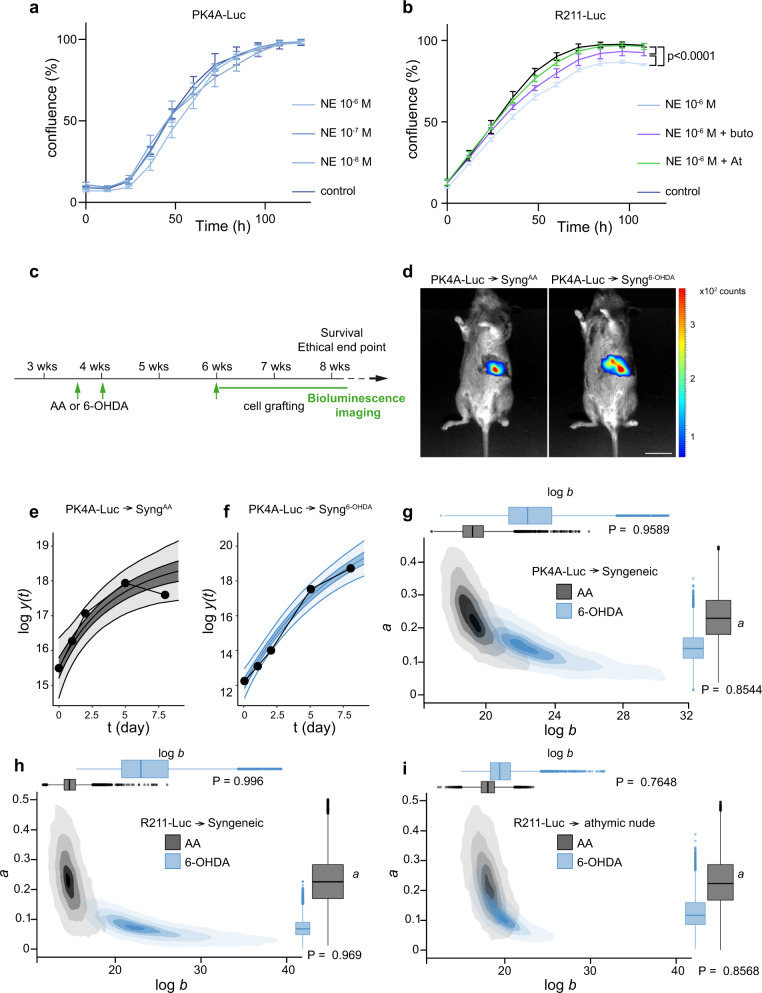
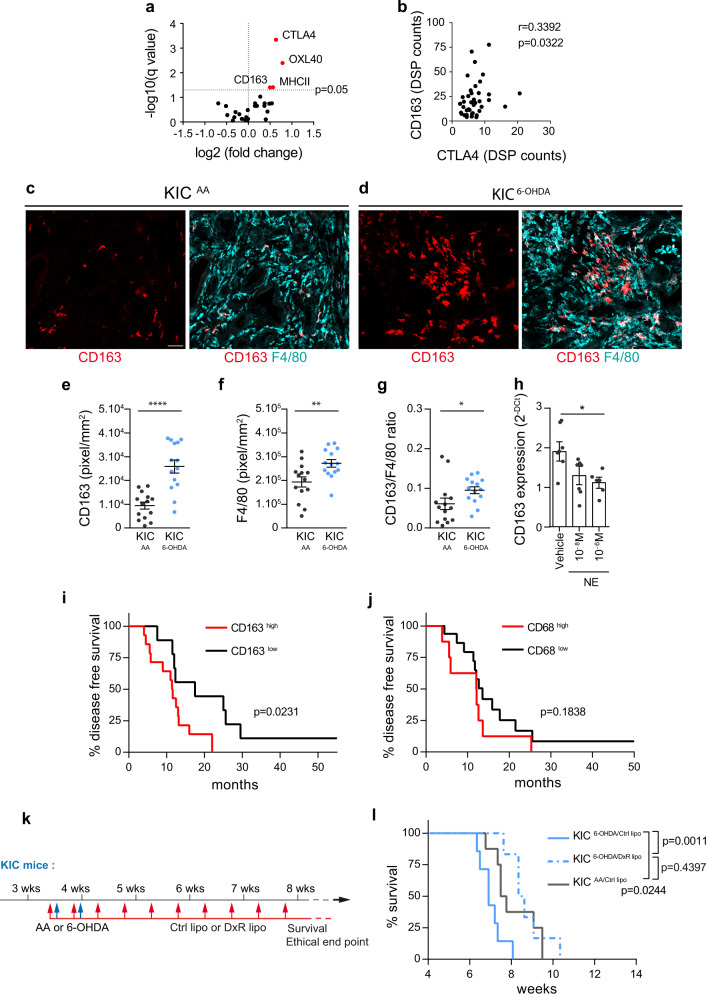
Neuronal nerve processes in the tumor microenvironment were highlighted recently. However, the origin of intra-tumoral nerves remains poorly known, in part because of technical difficulties in tracing nerve fibers via conventional histological preparations. Here, we employ three-dimensional (3D) imaging of cleared tissues for a comprehensive analysis of sympathetic innervation in a murine model of pancreatic ductal adenocarcinoma (PDAC). Our results support two independent, but coexisting, mechanisms: passive engulfment of pre-existing sympathetic nerves within tumors plus an active, localized sprouting of axon terminals into non-neoplastic lesions and tumor periphery. Ablation of the innervating sympathetic nerves increases tumor growth and spread. This effect is explained by the observation that sympathectomy increases intratumoral CD163+ macrophage numbers, which contribute to the worse outcome. Altogether, our findings provide insights into the mechanisms by which the sympathetic nervous system exerts cancer-protective properties in a mouse model of PDAC.


Conflict of interest statement

The authors declare no competing interests.

Figures

Fig. 1
Fig. 1. Origin and distribution of sympathetic nerves in the wild-type pancreas.
ac Representative images of retrogradely labeled CTB+ neurons projecting to the pancreas in tissues sections of the coeliac-superior mesenteric ganglion complex (CSMG) (a), nodose ganglia (b), and DRG (c) co-labeled with anti-TH antibody. In the coeliac-superior mesenteric ganglion complex, 100% of the CTB+ neurons were TH+ (n = 3 mice, 21 sections, 86 CTB+ neurons). None of the CTB+ sensory neurons in nodose ganglia or DRG were TH+ (n = 3 mice, 4 DRGs, 29 sections, 109 CTB+ neurons; and 3 nodose ganglia, 25 sections, 220 CTB+ neurons). df Maximal intensity projection of 3D image stacks of an 8-week-old control murine pancreas labeled with anti-TH and anti-SMA. The coeliac-superior mesenteric ganglion complex consists of distinct ganglionic subunits (r.c.g, right celiac ganglion; l.c.g, left celiac ganglion; s.m.g., superior mesenteric ganglion) whose TH+ efferents reach the pancreas through the celiac plexus (c.p.) surrounding the coeliac artery (c.a.) (d). After entering the pancreas, TH+ sympathetic nerves travel with the main pancreatic arteries (d.p.a., dorsal pancreatic artery; a.p.s.p.a., antero and posterior superior pancreatoduodenal artery, s.a., splenic artery) (e, f). The spleen that was kept attached during dissection is outlined with a dotted line. One representative image from 3 mice is shown. gi Images of TH+ nerve sections on optical slices made at different levels from the head to the tail of an 8-week-old control pancreas. j Quantification of the percentage of TH+ area on equidistant optical sections through the pancreas, from the nerve entrance in the head (level 1) to the tail (level 10). Data are presented as mean ± SEM. n = 4 mice. level 1 versus level 8, P = 0.0313; level 1 versus level 9, P = 0.0087; level 1 versus level 10, P = 0.0032 (Kruskal–Wallis test and Dunn’s post hoc tests). Scale bars = 30 μm (ac), 500 μm (d), 1 mm 200 μm (e), (f), and 1 mm (gi). Source data are provided as a Source Data file.
Fig. 2
Fig. 2. 3D patterns of sympathetic nerve bundles in KIC tumors.
a, b Maximal intensity projection of 3D images of an 8-week-old control pancreas labeled with anti-TH (a). The reconstructed sympathetic nerve bundles have been highlighted in red (b). The spleen (s) that was kept attached during dissection is outlined with a dotted line. Images are representative of four mice analyzed. c, d Maximal intensity projection of 3D images of an 8-week-old KIC pancreas labeled with anti-TH (c) and anti-CK19 (d). In (d), tissue autofluorescence, imaged at an excitation wavelength of 488 nm, is shown in white. Images are representative of 4 mice analyzed. eg after 3D reconstruction of the sympathetic nerves and tumor volumes (e), extratumoral and intratumoral nerves were artificially colored in red and yellow, respectively (f, g). h Quantification of the percentage of intratumoral and extratumoral TH+ nerves in four KIC pancreas. i Quantification of the total (extratumoral+intratumoral) TH+ nerve volume in control and KIC pancreas. Data are presented as mean ± SEM. n = 4 mice/group. Total TH in WT versus total TH in KIC, P = 0.3429; total TH in WT versus extratumoral TH in KIC, P = 0.0286 (Mann–Whitney test). Scale bars = 2 mm (ad, g) and 3 mm (e, f). Source data are provided as a Source Data file.
Fig. 3
Fig. 3. Hotspots of sympathetic innervation in KIC pancreas.
ac Maximal intensity projection of 3D image stacks and optical sections of pancreatic lobules from control mice immunostained with anti-TH (ac) and anti-SMA (a) antibodies to label artery-associated sympathetic nerves (a) and their terminals in the pancreatic parenchyma (arrows in a and c). d Optical section through a pancreatic lobule double-labeled with anti-TH and MECA-32 antibodies. eh Immunolabeling for TH (e, h), synaptophysin 1 (f, h), and PECAM (g, h) on a section through the acinar parenchyma of a control pancreas. ik 3D reconstruction (i) and optical section images (jk) of a KIC pancreatic lobule showing “hotspots” of innervation by TH+ sympathetic axons (arrows in i). Tissue autofluorescence, imaged at an excitation wavelength of 488 nm, indicates the presence of PanIN lesions (k). l, m Optical section images of a TH+ hotspot” co-labeled with anti-insulin (l) or anti-CK19 (m) antibodies. n, o 3D view of the original anti-TH staining (n) and reconstruction (o) of the sympathetic axon network around a PanIN lesion. Images are representative of four mice of each genotype. Scale bars =  500 µm (a), 300 µm (b, i), 200 µm (c, j), 40 µm (d), 30 µm (eh), 100 µm (k), and 30 µm (lo).
Fig. 4
Fig. 4. 3D visualization and statistical analysis of sympathetic axon and blood vessel networks in the KIC pancreas.
af Representative images of 6-week-old control (a) or KIC (bf) pancreata immunostained with anti-TH and MECA-32 antibodies (first row). 3D reconstructions of sympathetic axons (red, second row), blood vessels (green, third row), and axon/vessel surface contacts (yellow, fourth row) in normal acinar tissue (a), asymptomatic (Asympt) acinar tissue (b), NF (c), ADM (d), PanIN (e), and a well-differentiated PDAC region (f). Lumen of the epithelial lesions are represented in blue. Images are representative of 4 control and 5 KIC mice. g Heatmap of the Z-scores calculated for each of the 12 variables describing the architecture of sympathetic axons and their relationship with blood vessels. Values from 4 Asympt, 5 NF, 5 ADM, 6 PanIN, and 7 PDAC samples of 6-week-old KIC mice (n = 5) were compared with those of 7 normal acinar regions in age-matched control mice (n = 4). h, Factor map of the PCA performed on 34 tissue samples and 12 variables. Three cluster groups were identified corresponding to control and asymptomatic tissues (group 1, blue), noninvasive neoplastic pancreatic lesions (group 2, orange), and invasive tumor lesions (group 3, red). Scale bar = 50 µm. Source data are provided as a Source Data file.
Fig. 5
Fig. 5. Lack of neurogenesis in KIC tumors and sympathetic ganglia.
af Sections through the pancreas of 6-week-old KIC mice double-labeled with anti-TH and anti-insulin antibodies. Images show TH+/insulin+ β-cells in an intact islet (ac) and scattered inside the tumor (df). gi PDAC sections from 6-week-old KIC mice triple-labeled with anti-TH, anti-DCX, and anti-CD45 antibodies. The inset in (g) shows TH staining of an axon as a positive control. Images are representative of three mice analyzed. j, k Representative 3D view of the coeliac-superior mesenteric ganglia (c.s.m.g.) of 8-week-old control (j) and KIC (k) mice after labeling with anti-TH (red) and ganglia volume reconstruction (white). l Quantification of the volume of the coeliac-superior mesenteric ganglion complex in control and KIC mice. Data are presented as mean ± SEM. n = 3 mice/group. P = 0.08 (Mann–Whitney test). mr Visualization of TH+ neurons and EDU+ cells in the coeliac-superior mesenteric complex (c.s.m.g.) of 5.5-week-old control (mo) or KIC (pr) mice. No EDU+ cells expressed TH. s Quantification of the number of EDU+ cells per surface area. Data are presented as mean ± SEM. WT: n = 3 mice, 37 sections and 273 EDU+ cells; KIC: n = 3 mice, 34 sections and 265 EDU+ cells. P = 0.9407 (Mann–Whitney test). Scale bars = 20 µm (ai and mr) and 400 μm (jk). Source data are provided as a Source Data file.
Fig. 6
Fig. 6. Sympathetic innervation of PDX tumors.
af Maximal intensity projection of 3D image stacks of PDX tumors derived from two different patients [PDX1 (ac), PDX2 (df)] and immunostained with anti-TH antibody. Segmentation of PDX tumors is shown in red, intratumoral sympathetic fibers in yellow, and extratumoral fibers in white. Images are representative of four mice analyzed. Scale bars = 200 µm (a, b, d, e), and 50 µm (c, f).
Fig. 7
Fig. 7. Reduced survival and increased metastatic spread in sympathectomized KIC mice.
a Outline of the experiment. b Kaplan–Meier curve comparing overall survival of control mice treated with 6-OHDA (Ctrl6-OHDA, n = 10) and KIC mice treated with AA (KICAA, n = 12) or 6-OHDA (KIC6-OHDA, n = 8). For KICAA versus KIC6-OHDA: P = 0.0132 (Log-rank test) and hazard ratio B/A = 2.711 (A = KICAA and B = KIC6-OHDA). ch Representative pictures of livers (c, d), HPS-stained liver sections (e, f), and intestine (g, h) of AA- or 6-OHDA-treated KIC mice collected at autopsy. The arrows point to macrometastases. e, f show representative images of three mice analyzed per treatment group. ij Pie charts showing the percentage of AA- and 6-OHDA-treated KIC mice without and with liver metastasis (i) and carcinomatosis in the intestine mesentery (j) at death (KICAA, n = 9; KIC6-OHDA, n = 6). Scale bars = 5 mm (c, d and g, h), and 500 µm (e, f). Source data are provided as a Source Data file.
Fig. 8
Fig. 8. Accelerated tumor growth in sympathectomized KIC mice.
a Outline of the experiment. b, c Representative pictures of tumoral pancreata from 6.5-week-old KIC mice treated with AA (b) or 6-OHDA (c). d Scattered dot plot of pancreatic weight from 6.5-week-old KIC mice treated with AA (KICAA, n = 9) or 6-OHDA (KIC6-OHDA, n = 13). P = 0.0348 (unpaired t test with Welch’s correction). e, f Bright-field images of HPS-stained pancreatic sections from 6.5-week-old KIC mice treated with AA or 6-OHDA. Images are representative of 3 mice analyzed per treatment group. g Pie charts showing the percentage of surface covered by asymptomatic tissue (Asympt), ADM, PanIN, and PDAC in pancreatic sections from 6.5-week-old KIC mice treated with AA (n = 3 mice, 12 sections) or 6-OHDA (n = 3 mice, 12 sections). ho Representative images of immunohistochemistry for Ki-67 (h, i), Masson’s trichrome staining (j, k), immunofluorescence for PECAM (l, m), and pimonidazole staining (n, o) in PDAC sections from 6.5-week-old KIC mice treated with AA or 6-OHDA. ps Scattered dot plots of the densities of Ki-67+ cells (p), collagen (q), PECAM+ vessels (r), and pimonidazole+ hypoxic areas (s) in PDAC sections of 6.5-week-old KIC mice treated with AA or 6-OHDA. p P = 0.0145, unpaired t test with Welch’s correction (KICAA, n = 3 mice, 19 images; KIC6-OHDA, n = 3 mice, 22 images). q P = 0.0085, unpaired t test with Welch’s correction (KICAA, n = 3 mice, 13 images; KIC6-OHDA, n = 3 mice, 15 images). r, P = 0.0014, unpaired t test (KICAA, n = 6 mice, 23 images; KIC6-OHDA, n = 5 mice, 26 images). s P = 0.0002, Mann–Whitney test (KICAA, n = 1 mouse, 6 images; KIC6-OHDA, n = 2 mice, 11 images). Data are represented as median ± SEM. Scale bars = 5 mm (b, c), 500 µm (e, f), 50 µm (h, i), 100 µm (j, k), and 200 µm (lo). Source data are provided as a Source Data file.
Fig. 9
Fig. 9. Effects of sympathectomy in orthotopic transplantation models.
a, b Cell confluence measured using IncuCyte live-cell imaging for PK4A-Luc (a) and R211-Luc (b) cells incubated with different concentrations of norepinephrine (NE), with or without atenolol (At) or butoxamine (buto). Data are presented as mean ± SEM. a P = 0.9298; b control versus NE, P < 0.001, control versus NE+ buto, P < 0.001, NE versus NE+buto, P < 0.001 (two-way ANOVA). n = 3 samples from three independent experiments. c Outline of the in vivo experiments. d Bioluminescence images of AA- and 6-OHDA-treated FVB/C57BL/6 mice 8 days after orthotopic grafting of PK4A-Luc cells. e, f Examples of growth curves for two representative mice from the control (e) and sympathectomized (f) groups engrafted with PK4A-Luc cells. The x axis represents time (in days), the y axis represents log-luminescence. Bioluminescence data (black dots) were fitted to a Gompertz growth curve function. Shades represent the credible regions of posterior probability 0.5 (dark tone) or 0.95 (light tone) of two mouse-level growth curves. gi Comparison of the 2D-posterior distributions of the group-level shape parameters (log b and a) of the two groups (AA in gray, 6-OHDA in blue) after syngeneic orthotopic transplantation of PK4A-Luc (g) and R211-Luc cells (h), or after transplantation of R211-Luc cells in athymic nude mice (i). Shades indicate high posterior density credible regions of probabilities 0.05, 0.25, 0.5, 0.75, 0.95 (from dark to light tone). The boxplots in the margins of the graph represent the marginal posterior distributions of the two parameters (log b and a) in both populations (AA and 6-OHDA). The center line estimates the median of the posterior distribution, the box limits estimate the first and third quantiles of the posterior distribution. Each whisker is of length 1.5 times the interquartile range and is shortened when no draw from the posterior reaches or exceeds the limit of this whisker. On the other hand, draws that fall outside the whiskers are represented as dots. P indicates the posterior probability of the difference between the two groups. Scale bar = 1 cm. Source data are provided as a Source Data file.
Fig. 10
Fig. 10. CD163+ macrophages mediate the effect of sympathectomy.
a Volcano plot of DSP data in tumor-dominant ROIs from 6.5-week-old KIC mice treated with AA (n = 5 mice) or 6-OHDA (n = 4 mice). Markers significantly upregulated in 6-OHDA treated tumors are shown in red. b Correlation between CTLA4 and CD163 expression in tumor-dominant ROIs in KIC mice treated with 6-OHDA. n = 4 mice, r = 0.3392, P = 0.0322 (Spearman test). c, d Representative images of F4/80+ and CD163+ macrophages in PDAC of 6.5-week-old KIC mice treated with AA (c) or 6-OHDA (d). eg Densities of CD163+ macrophages (e; P < 0.0001, unpaired t test with Welch’s correction), F4/80+ macrophages (f; P = 0.0073, unpaired t test), and CD163/F4/80 ratio (g; p = 0.0141, Mann–Whitney test) in PDAC of 6.5-week-old KIC mice treated with AA (KICAA, n = 4 mice, 14 images) or 6-OHDA (KIC6-OHDA, n = 3 mice, 14 images). Data are presented as median ± SEM. h, Cd163 mRNA expression levels in pancreatic CD45+F4/80+CD163+ macrophages treated or not with norepinephrine (NE). n = 3 samples tested in duplicate. Data are presented as mean ± SEM. Vehicle versus NE 10-8 M, P = 0.1794; Vehicle versus NE 10-6  M, P = 0.0392 (Kruskal–Wallis test and Dunn’s post hoc tests). i Overall survival of human patients with PDAC and high intratumoral CD163 (n = 14) or low CD163 (n = 9) expression levels. P = 0.0231 (log-rank test), hazard ratio A/B = 3.428 and B/A = 2.445 (A = low CD163 and B = high CD163). j Overall survival of human patients with PDAC and high intratumoral CD68 (n = 8) or low CD68 (n = 17) expression levels. P = 0.1838 (log-rank test), hazard ratio A/B = 0.5552 and B/A = 1.801 (A = low CD68 and B = high CD68). k Outline of the experiment quantified in (l). l Survival of AA-treated KIC mice injected with Ctrl lipo (KICAA/Ctrl lipo, n = 8) and 6-OHDA-treated KIC mice injected with Ctrl lipo (KIC6-OHDA/Ctrl lipo, n = 7) or DxR lipo (KIC6-OHDA/DxR lipo, n = 6). KICAA/Ctrl lipo vs. KIC6-OHDA/Ctrl lipo, P = 0.0244 (log-rank test) and hazard ratio B/A = 2.778 (A = KICAA/Ctrl lipo and B = KIC6-OHDA/Ctrl lipo). KIC6-OHDA/Ctrl lipo vs. KIC6-OHDA/DxR lipo, P = 0.0011 (log-rank test) and hazard ratio A/B = 4.173 (A = KIC6-OHDA/Ctrl lipo and B = KIC6-OHDA/DxR lipo). KICAA/Ctrl lipo vs. KIC6-OHDA/DxR lipo, P = 0.4397 (log-rank test) and hazard ratio A/B = 1.437 (A = KICAA/Ctrl lipo and B = KIC6-OHDA/DxR lipo). Scale bars = 500 µm. Source data are provided as a Source Data file.

References

    1. Kumar A, Brockes JP. Nerve dependence in tissue, organ, and appendage regeneration. Trends Neurosci. 2012;35:691–699. doi: 10.1016/j.tins.2012.08.003. - DOI - PubMed
    1. Faulkner S, Jobling P, March B, Jiang CC, Hondermarck H. Tumor neurobiology and the war of nerves in cancer. Cancer Discov. 2019;9:702–710. doi: 10.1158/2159-8290.CD-18-1398. - DOI - PubMed
    1. Magnon C, et al. Autonomic nerve development cancer progression. Science. 2013;341:1236361. doi: 10.1126/science.1236361. - DOI - PubMed
    1. Zhao CM, et al. Denervation suppresses gastric tumorigenesis. Sci. Transl. Med. 2014;6:250–115. doi: 10.1126/scitranslmed.3009569. - DOI - PMC - PubMed
    1. Love JA, Yi E, Smith TG. Autonomic pathways regulating pancreatic exocrine secretion. Auton. Neurosci. Basic Clin. 2007;133:19–34. doi: 10.1016/j.autneu.2006.10.001. - DOI - PubMed

Publication types