. 2022 Apr;604(7906):571-577.
doi: 10.1038/s41586-022-04570-y. Epub 2022 Apr 13.

Nonlinear control of transcription through enhancer-promoter interactions

Affiliations

Nonlinear control of transcription through enhancer-promoter interactions

Jessica Zuin et al. Nature. 2022 Apr.

Abstract

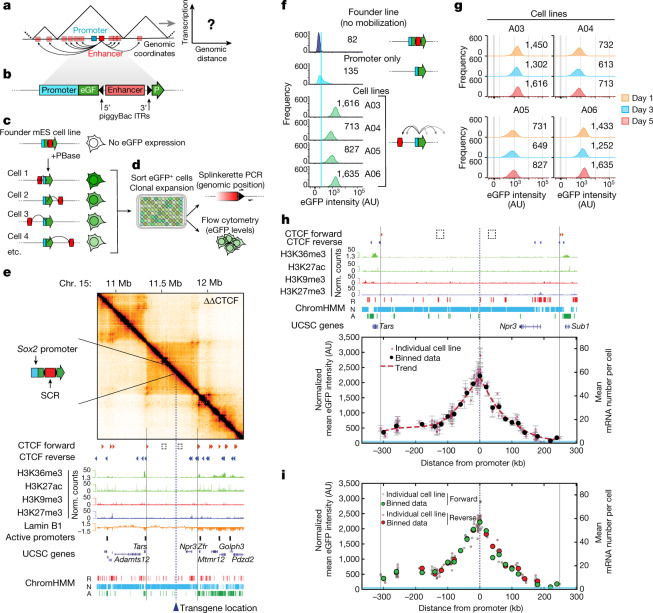
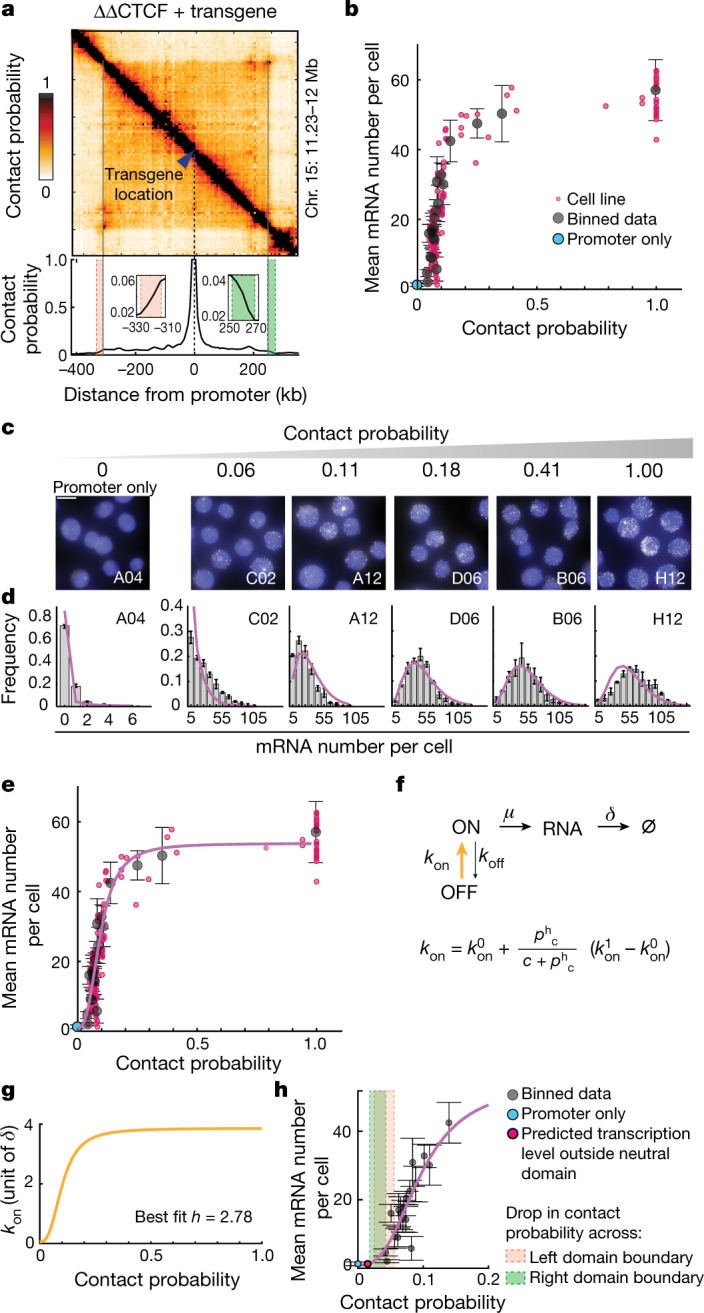
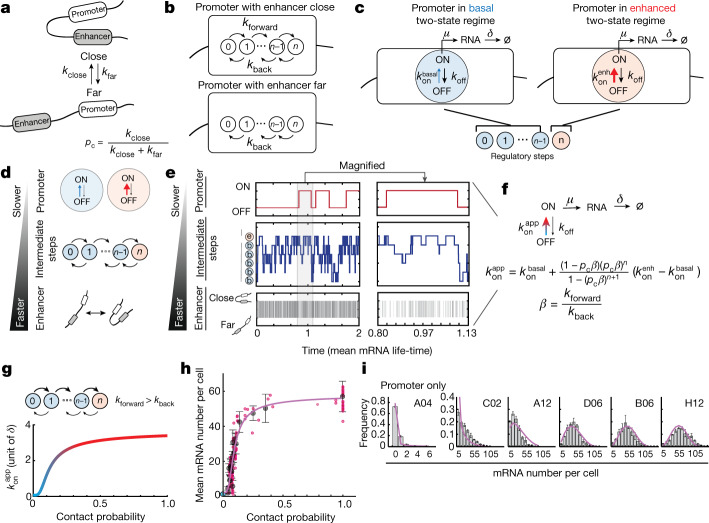
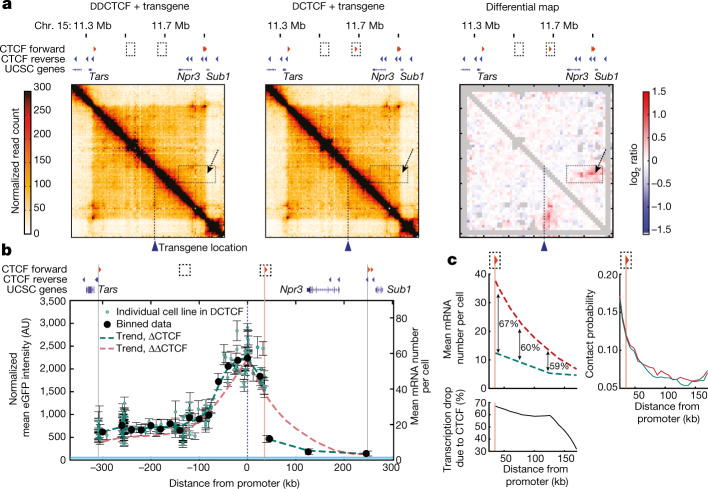
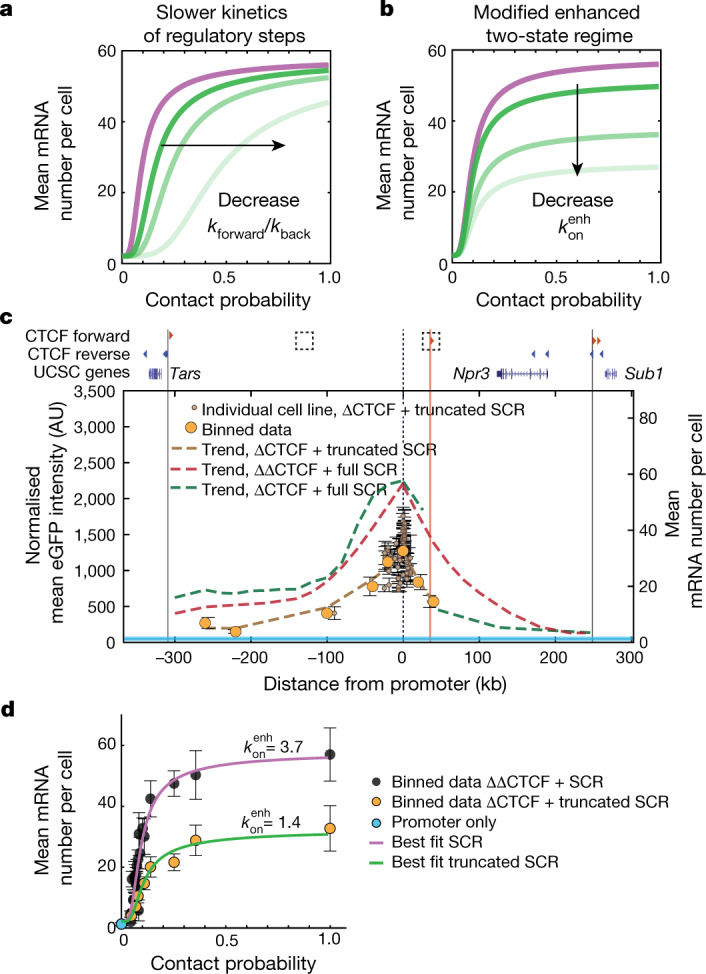
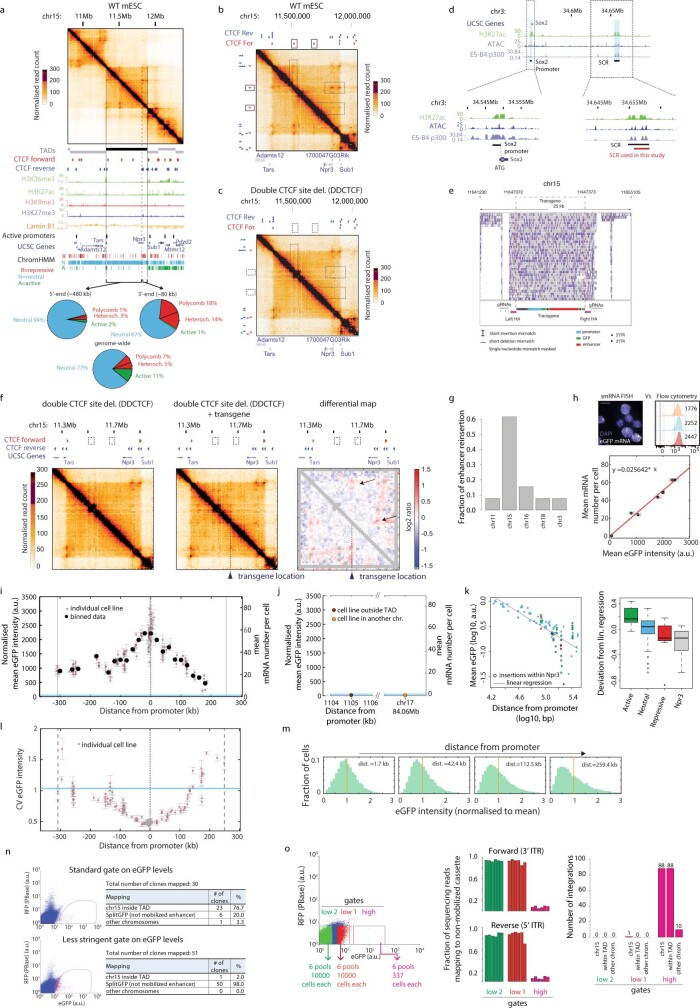
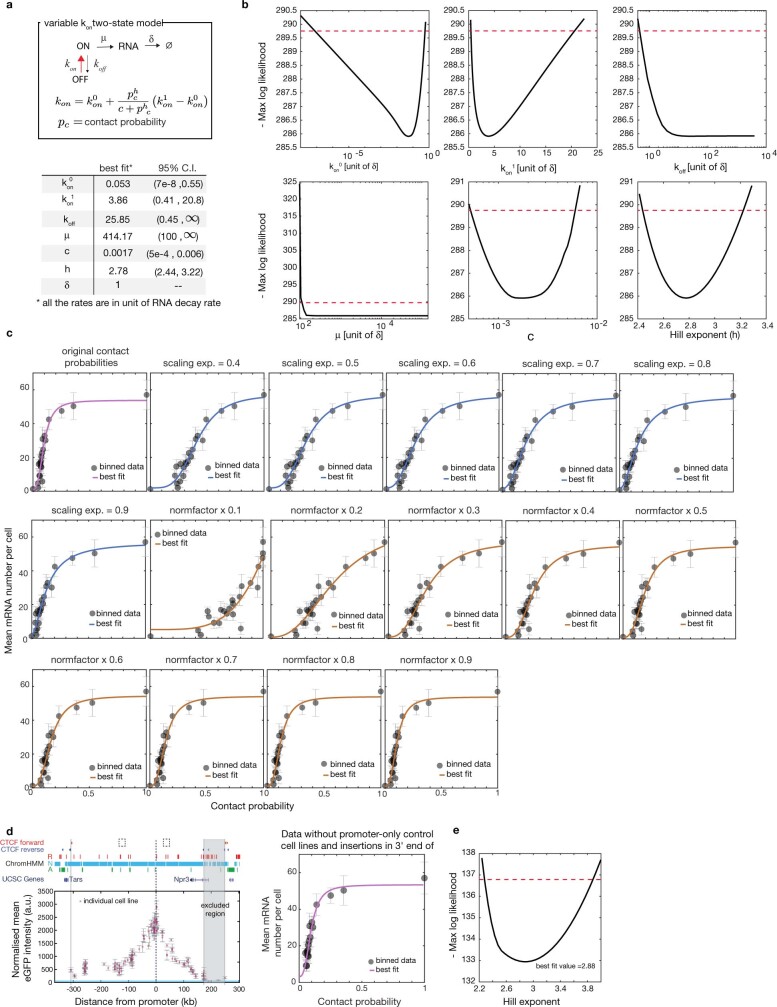
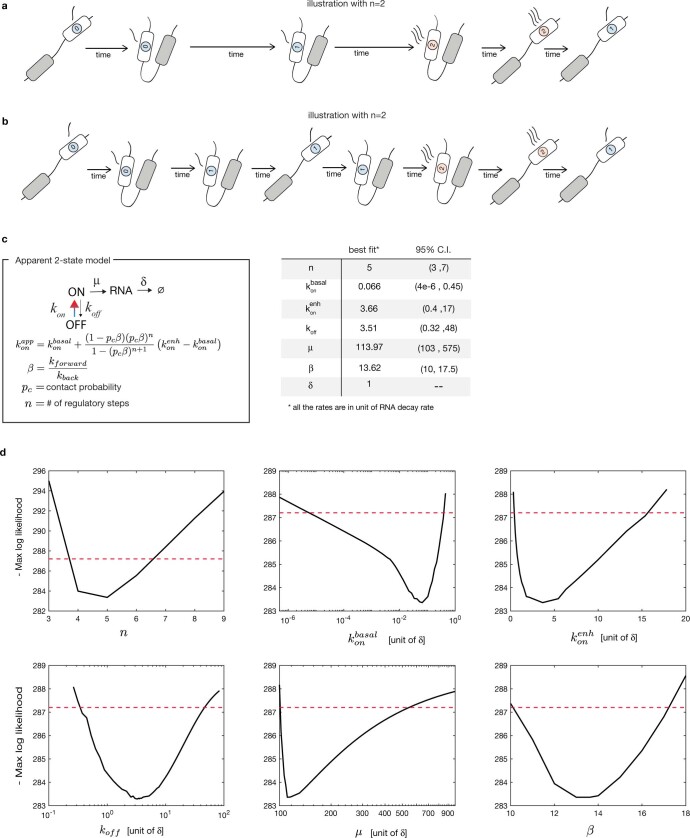
Chromosome structure in mammals is thought to regulate transcription by modulating three-dimensional interactions between enhancers and promoters, notably through CTCF-mediated loops and topologically associating domains (TADs)1-4. However, how chromosome interactions are actually translated into transcriptional outputs remains unclear. Here, to address this question, we use an assay to position an enhancer at large numbers of densely spaced chromosomal locations relative to a fixed promoter, and measure promoter output and interactions within a genomic region with minimal regulatory and structural complexity. A quantitative analysis of hundreds of cell lines reveals that the transcriptional effect of an enhancer depends on its contact probabilities with the promoter through a nonlinear relationship. Mathematical modelling suggests that nonlinearity might arise from transient enhancer-promoter interactions being translated into slower promoter bursting dynamics in individual cells, therefore uncoupling the temporal dynamics of interactions from those of transcription. This uncovers a potential mechanism of how distal enhancers act from large genomic distances, and of how topologically associating domain boundaries block distal enhancers. Finally, we show that enhancer strength also determines absolute transcription levels as well as the sensitivity of a promoter to CTCF-mediated transcriptional insulation. Our measurements establish general principles for the context-dependent role of chromosome structure in long-range transcriptional regulation.


Conflict of interest statement

The authors declare no competing interests.

Figures

Fig. 1
Fig. 1. Enhancer action depends on the genomic distance from the promoter and is constrained by TAD boundaries.
a, Mobilization of an enhancer around its target promoter to measure transcription as a function of their genomic distance. b, Schematic of the transgene: a promoter drives transcription of an eGFP gene split by a piggyBac-enhancer cassette. ITR, inverted terminal repeats. c, After expression of PBase, the piggyBac-enhancer cassette is excised and randomly reinserted, occasionally leading to eGFP expression. d, Sorting of single eGFP+ cells results in cell lines in which the enhancer drives transcription from a single position. Splinkerette PCR and flow cytometry analysis are used to determine the enhancer position and promoter expression levels. e, Capture-C (6.4 kb resolution) analysis and genomic datasets in mES cells across 2.6 Mb centred around the selected TAD with both of the internal CTCF motifs deleted (dashed squares; ΔΔCTCF, double CTCF site deletion ). The dashed line indicates the position of the future insertion of the transgene carrying the Sox2 promoter and SCR. A, active; N, neutral; R, repressive; Chr, chromosome. f, Representative flow cytometry profiles from founder mES cells, a promoter-only control cell line and eGFP+ cell lines with mobilized SCR. The light blue line indicates the mean eGFP levels in the promoter-only line. The numbers show the median eGFP intensities. AU, arbitrary units. g, eGFP levels in individual eGFP+ cell lines over cell passages. The numbers show the median eGFP values. h, Normalized mean eGFP intensities in individual eGFP+ cell lines as a function of SCR genomic position. The red dots are data from 135 individual cell lines; data are mean ± s.d. n = 3 measurements on different days. The black dots show the average values within equally spaced 20 kb bins. The dashed red line shows the spline interpolation of average values. Mean mRNA numbers were inferred using smRNA-FISH calibration (Extended Data Fig. 1h). The light blue area shows the interval between the mean ± s.d. of eGFP levels in three promoter-only cell lines. i, Data as in h, colour-coded according to SCR genomic orientation.
Fig. 2
Fig. 2. The promoter on rate is a sigmoidal function of enhancer–promoter contact probabilities.
a, Capture-C (6.4 kb resolution) analysis of the founder cell line used for the experiments in Fig. 1 after converting read counts into contact probabilities (top) (Methods). Bottom, cross-section showing contact probabilities from the ectopic Sox2 transgene. Insets: magnification of contact probability across the TAD boundaries. b, Mean eGFP mRNA numbers per cell plotted against contact probabilities between the ectopic Sox2 promoter and SCR insertions. The red dots show individual cell lines. The black dots show the average values within equally spaced 20 kb bins ± s.d. The number of cell lines per bin varies from 1 to 28. c, Representative smRNA-FISH images from cell lines in which eGFP transcription is driven by the Sox2 promoter alone (left) or by the SCR located at different distances and contact probabilities (right). Scale bar, 10 µm. d, Distributions of mRNA numbers per cell measured in the cell lines shown in c. The error bars show the minimum and maximum frequency. n = 3 technical replicates. The line shows the best fit of the phenomenological two-state model to the experimental data shown in b and d. e, Best fit to experimental data of b and d. Best-fit parameters are shown in Extended Data Fig. 3b. f, Description of the phenomenological two-state model with a variable on rate. The Hill function describes the dependency of kon on contact probability (pc). kon0 and kon1 are the minimum and maximum on rates, respectively; c and h are the Hill function critical threshold and the sensitivity parameter, respectively. ∅ symbolizes degraded RNA. g, The best-fitting Hill function for kon (in units of mRNA lifetime δ), corresponding to a sigmoidal curve. h, Close-up of e, highlighting the predicted insulation outside the TAD boundaries (red and green shaded areas). Data are presented as in b.
Fig. 3
Fig. 3. A mechanistic model of enhancer–promoter communication.
a, Stochastic promoter–enhancer interactions occur and disassemble with rates kclose and kfar. b, In the close state, the enhancer can trigger n reversible regulatory steps with forward and reverse rates kforward and kback. In the far state, regulatory steps can revert only at rate kback. c, The promoter operates in a basal two-state regime with a small on rate (konbasal) unless all n regulatory steps have been completed, in which case it transiently enters an enhanced two-state regime with a higher on rate (konenh). d, Schematic of the parameter constraints under which the mechanistic model reduces to an apparent two-state model: kclose,far ≫ kforward,back ≫ konbasal,enh, koff, µ. e, Representative single-cell dynamics of enhancer–promoter interactions, promoter regulatory steps and promoter states predicted by the mechanistic model with n = 5 and rates satisfying the constraint on timescales described in d (time unit, 1/δ). f, Reduction of the mechanistic model to an apparent two-state model. The equation describes how the apparent on rate konapp depends on contact probability (pc) and other parameters of the mechanistic model. g, Dependency of konapp on contact probability, illustrated for the best fitting parameters shown in h and i. h, Best fit of the apparent two-state model to the experimental transcriptional response shown in Fig. 2b. i, Best fit of the apparent two-state model to the experimental mRNA distributions shown in Fig. 2c. Best-fit parameters are shown in Extended Data Fig. 4c.
Fig. 4
Fig. 4. Insulation by a single CTCF site exceeds contact probability changes.
a, Capture-C (6.4 kb resolution) analysis of founder mES cell lines in the absence (ΔΔCTCF) or presence (single CTCF-site deletion, ΔCTCF) of a forward CTCF motif 36 kb downstream of the transgene, and the corresponding differential map. The grey pixels show ‘noisy’ interactions that did not pass quality control filters (Methods). The dotted boxes and arrows indicate the position of the CTCF site and the structural changes it generates. b, The normalized mean ± s.d. eGFP levels in 172 individual eGFP+ cell lines following SCR mobilization in ΔCTCF mES cells (green dots); n = 3 measurements performed on different days. The black dots show the mean ± s.d. values within equally spaced 20 kb bins. The green dashed line shows the spline interpolation of average eGFP values. The vertical pink line shows the position of the CTCF site at +36 kb. The red dashed line shows the trend of eGFP levels in the ΔΔCTCF background (compare with Fig. 1h). The blue line shows the promoter-only eGFP level as in Fig. 1h. c, Magnification of spline interpolants of GFP+ cell lines in the absence (ΔΔCTCF, red dashed line) or presence (ΔCTCF, green dashed line) of the CTCF binding site at +36 kb (vertical pink line) (left). The numbers represent the percentage fold changes between trendlines. Bottom, the percentage fold changes as a function of distance from the promoter. Right, contact probabilities from the location of the ectopic Sox2 transgene in ΔΔCTCF (red line) and ΔCTCF (green line) mES cells.
Fig. 5
Fig. 5. Enhancer strength modulates promoter on rates and determines insulation levels through a CTCF site.
a, Model predictions under the hypothesis that decreasing enhancer strength results in a slower flow of regulatory information to the promoter. b, Model predictions as in a, under the alternative hypothesis that decreasing enhancer strength modifies the enhanced on rate (konenh). c, Normalized eGFP levels in in 74 individual GFP+ cell lines (brown dots; the error bars show the s.d. of n = 3 measurements performed on different days), binned data (orange dots) and data trend (brown dashed line) after mobilization of the truncated SCR in the ΔCTCF background. Trends of eGFP levels in individual GFP+ cell lines in which the SCR was mobilized either in the ΔΔCTCF background (red dashed line; Fig. 1h) or in the ΔCTCF background (green dashed line; Fig. 4b) are shown for comparison. Promoter-only eGFP levels (light blue) are shown as in Fig. 1h. d, The transcriptional response of the truncated SCR (green line) can be predicted from the best fit to the full-length SCR (purple line) with a modified enhanced on rate (konenh). Data are mean ± s.d. eGFP values were calculated within equally spaced 20 kb bins as in c; the number of cell lines per bin varies from 1 to 56.
Extended Data Fig. 1
Extended Data Fig. 1. Enhancer action is modulated by genomic distance from the target promoter and constrained by TAD boundaries.
a. Top: capture-C contact map at 6.4 kb resolution in wild-type (WT) mES cells in a 2.6 Mb region centred around the neutral TAD on chromosome 15 we used for the experiments. Vertical grey lines: TAD boundaries. Bottom: genomic datasets and ChromHMM analysis showing that the chosen TAD is devoid of active and repressive chromatin states, with the exception of 80 kb at the 3b at t which is enriched in repressive chromatin states. b. Close-up view of panel a, highlighting the presence of CTCF-mediated chromatin loops (dotted boxes) in WT mES cells. c. capture-C contact map at 6.4 kb resolution for the same region as panel b in the cell line with double CTCF site deletions. CTCF deletions lead to loss of CTCF-mediated chromatin loops (dotted boxes). d. Top: UCSC snapshot of the endogenous Sox2 locus and Sox2 control region (SCR). Bottom: close-up views showing the regions of the Sox2 promoter, the SCR region found in ref. and the SCR used in the transgene construct. e. IGV snapshot showing nanopore sequencing reads mapped to a modified mouse genome including the transgene integration. Reads spanning from genomic DNA upstream the left homology arm to genomic DNA downstream the right homology arm confirmed single insertion of the transgene. f. capture-C maps at 6.4 kb resolution of the mES cell line with double CTCF sites deletion (left) and the founder mES cell line with transgene insertion (centre). Right: differential contact map. Grey pixels correspond to ‘noisy’ interactions that did not satisfy our quality control filters (see Methods). Transgene insertion induces new mild interactions with CTCF sites at the 3. and 5a extremities of the TAD (arrows). g. Barplot showing the fraction of piggyBac-SCR reinsertions genome-wide determined by Illumina sequencing of splinkerette PCR products from a pool of cells after PBase expression. See Methods for a detailed description of the protocol. h. Top: Representative smRNA-FISH image and flow cytometry profiles over different passages in a cell line where the SCR was mobilized in the immediate vicinity of the ectopic Sox2 promoter. Scale bar, 10 μm. Bottom: Linear relationship between the mean eGFP intensity and the average number of eGFP mRNAs measured using smRNA-FISH for seven single cell lines (R2=0.9749, p<0.0001, t-test). Error bars on the x-axis: standard deviation of three measurements performed on different days, as in Fig. 1h. Error bars on the y-axis: standard deviation of three technical replicates. i. Normalized mean eGFP intensities levels in individual eGFP+ cell lines are plotted as a function of the genomic position of the SCR in individual eGFP+ lines. Data from 127 individual cell lines (light red dots) from a single experiment are presented as mean +\- standard deviation (n=3 measurements performed in different days, as in Fig. 1g). Average eGFP values calculated within equally spaced 20 kb bins (black dots) are shown. Mean mRNA numbers per cell were inferred from eGFP counts using calibration with smRNA-FISH, see Extended Data Fig. 1h. Shaded light blue area indicates the interval between mean +/- standard deviation of eGFP levels in three promoter-only cell lines. j. Same plot as Fig. 1h showing the only two SCR insertions we detected outside the TAD boundaries (brown dot) and on another chromosome (yellow dot). k. Left: Log10 average eGFP expression (from Fig. 1h) as a function of log10 absolute genomic distance between transgene position and SCR reinsertion. Points are colour-coded as in panel A (chromHMM active, neutral, and repressive states). Black line denotes linear regression. Black circles denote SCR reinsertions within the Npr3 gene body. Right: deviations of eGFP expression levels from the linear regression correlate with chromatin states called using ChromHMM (n: active = 16; neutral = 83; Npr3 = 17; repressive = 7). Reinsertion of SCR within active or repressive regions respectively increases or decreases enhancer activity compared to neutral regions. Box plot: centre line denotes the median; boxes denote lower and upper quartiles (Q1 and Q3, respectively); whiskers denote 1.5x the interquartile region (IQR) below Q1 and above Q3; points denote outliers. l. Coefficients of variation (CV) of eGFP levels measured by flow cytometry plotted against SCR insertion locations in eGFP+ cell lines (light red dots). Data are presented as mean +/- standard deviation (n = 3 measurements in different days). Shaded light blue area indicates the interval between mean +/- standard deviation of eGFP level CVs in three promoter-only cell lines. m. Representative eGFP distributions (normalized to mean eGFP level) in clones with increasing absolute genomic distance (1.7 kb, 42.4 kb, 112.5 kb, and 259.43 kb) between the mobilized enhancer and the ectopic Sox2 promoter. Vertical line indicates normalized mean eGFP levels. n. FACS plot showing standard (top) and less stringent (bottom) gates on eGFP levels used for single cells sort and insertion analysis of corresponding clonal cell lines. o. Left: FACS plot showing the gates used to sort pools of cells for tagmentation-based mapping of PiggyBac-enhancer insertions. For gates “low 1” and “low 2”, six pools of 10000 cells were sorted while for gate “high”, six pools of 337 cells were sorted. Gate “high” corresponds to the standard gate used to isolate eGFP positive cell lines for the mobilization experiments. Centre: Barplot showing the fraction of sequencing reads mapping to non-mobilized enhancer cassette determined by tagmentation-based mapping from the different pools sorted in gates “low 1”, “low 2” and “high”. See Methods for a detailed description of the protocol. Right: Numbers and genomic locations of confident insertion sites (identified as those with at least one read for both 5′oth 5 mapping from the different pools sorted in gates “low 1”, “low 2” and “higeGFP gates.
Extended Data Fig. 2
Extended Data Fig. 2. Analysis of chromosome structure around the transgenic locus and genome-wide in mES cells.
a. Top: capture-C maps (6.4 kb resolution) of four cell lines where the SCR (black arrow) has been reinserted at different distances from the promoter (blue arrow). Bottom: differential contact map between individual cell lines and the founder line. Grey pixels: correspond to ‘noisy’ interactions that did not satisfy quality control filters (see Methods). Right: barplot showing the change in average interaction probabilities between the SCR reinsertion and the cassette, calculated using a square of 5 bins (6.4 kb resolution) centred at the cassette SCR reinsertion interaction. b. Left: example of Hi-C heatmap in mES cells at 6.4 kb resolution. Centre: scheme depicting how the probability of interaction between a promoter and the region immediately before the nearest TAD boundary (Pin, 12.8 kb i.e. two 6.4 kb bins before the boundary called using CaTCH) and after the nearest TAD boundary (Pout) are calculated. Right: distribution of contact probability between all active promoters in mES cellss and the closest inner TAD boundary (Pin) (n = 9655). Box plot description as in Extended Data Fig. 1k. c. Box plots showing the distribution of contact probability changes within the TAD and across the closest TADs boundary for all active promoters in mES cells (n = 9655) whose contact probability outside the TAD is higher than 0.001 (n = 834). Box plot description as in Extended Data Fig. 1k; outliers not shown. d. Contact probabilities of the founder line from the location of the ectopic Sox2 transgene (black line) and normalized averaged mean number of mRNAs per cell (highest value = 1) generated in individual eGFP+ lines by the SCR mobilization are plotted as a function of its genomic position (dashed red line). The average is calculated within equally spaced 20 kb bins as in Fig. 1h (black dots). e. Coefficients of variation (CV) of eGFP levels measured by flow cytometry plotted against contact probabilities between the ectopic Sox2 promoter and the locations of SCR insertions. Data are presented as mean values +/- standard deviation (n = 3measurements in different days). Shaded light blue area indicates the interval between mean +/- standard deviation of eGFP level CVs in three promoter-only cell lines. f. Coefficients of variation (CV) of mRNA number per cell measured by smRNA-FISH plotted against contact probabilities between the ectopic Sox2 promoter and the locations of SCR in the cell the lines shown in Fig. 2c, d. Data are presented as mean values +/- standard deviation (n = 3 technical replicates).
Extended Data Fig. 3
Extended Data Fig. 3. Phenomenological two-state model fitting and robustness analysis.
a. Parameter values and 95% confidence intervals for the best fitting phenomenological two-state model. The rates are in the unit of RNA decay rate (δ). b. Profile likelihood functions for all the parameters of the phenomenological two-state model. The red dashed line shows the threshold used to calculate the 95% confidence intervals (see Supplementary Model description for more details). c. Best fit of the phenomenological two-state model under different perturbations of the contact probabilities. Panels with blue curves show the best fit transcriptional responses when the scaling exponent of the contact probabilities was artificially set to 0.4, 0.5, 0.6, 0.7, 0.8, and 0.9. The scaling exponent of the original contact probabilities is 0.77. Panels with orange curves show the best fit transcriptional responses when contact probabilities were artificially increased by a factor 1/x with x = 0.1,...,0.9 with step of 0.1. Data are presented as average eGFP values calculated within equally spaced 20 kb bins +/- standard deviation (n = number of cell lines per bin), as in Fig. 1h. d. Left: Normalized mean eGFP intensities in individual eGFP+ cell lines are plotted as a function of the genomic position of the SCR. Data from 135 individual cell lines (light red dots) are presented as mean +/- standard deviation (n = 3 measurements performed on different days, as in panel g). Shaded grey area indicates the genomic regions that were excluded from the fit shown in the right panel. Right: Best fit of the phenomenological two-state model in the absence of the promoter-only control cell line and the cell lines with insertions that landed beyond the first CTCF site at the 3′ of the TAD (region highlighted in the left panel). Data are presented as average eGFP values calculated within equally spaced 20 kb bins +/- standard deviation (n = number of cell lines per bin). e. Profile likelihood function for the Hill coefficient for the fit described in panel d.
Extended Data Fig. 4
Extended Data Fig. 4. Fit of the mechanistic enhancer–promoter model and robustness analysis.
a. Schematic description of the dynamics of the mechanistic model (here with two regulatory steps (n=2) for illustration). This case illustrates a scenario where, the enhancer–promoter interaction is long enough to allow the completion of the 2 regulatory steps and transiently increases the promoter activity. b. In an alternative scenario, the interactions are shorter but frequent enough to allow the completion of the 2 regulatory steps and transiently increase the promoter activity. c. Parameter values and 95% confidence intervals for the best fitting apparent two-state model. The rates are in the unit of RNA decay rate (δ). d. Profile likelihood functions for all the parameters of the apparent two-state model. Red dashed lines show the threshold used to calculate the 95% confidence intervals (see Supplementary Model description for more details).
Extended Data Fig. 5
Extended Data Fig. 5. Dependence of transcription levels and insulation on enhancer strength.
a. Top: UCSC genome browser snapshot of the endogenous Sox2 locus and Sox2 control region (SCR). Bottom: close-up view showing the SCR (black) identified in ref. and the enhancer regions used in the transient reporter assays shown in panel b. Full-length enhancer is in red (same as in Fig. 1); truncated versions are in brown (Ei) and orange (Eii). Experiments in Fig. 5 were performed with Ei. b. Flow cytometry analysis of mES cells transiently transfected with PBase-RFP and different versions of split eGFP plasmids carry either no enhancer, or the full-length SCR (red, see panel a), or the first (brown-Ei) or second (orange-Eii) SCR subregions in front of the Sox2 promoter. Transcription levels generated upon co-transfection with PBase are higher in the presence of the full-length SCR compared to truncated versions. Numbers in each quadrant represent the % of cells either negative or RFP, GFP and RFP-GFP positive. c. Top: distribution of contact probabilities between all active promoters in mES cells and the nearest inner TAD boundaries, calculated as in Extended Data Fig. 2b. Bottom panel: Model prediction for the mean eGFP mRNA numbers per cell plotted against contact probabilities shown as a comparison (same as Fig. 2e). Shaded areas correspond to promoters with contact probability with the closest TAD boundary below 0.2. d. Left panel: scheme of how the probabilities of interaction between promoter and the region before (Pin) and after the TAD boundary (Pout) are calculated, same criteria as in Extended Data Fig. 2b. Central panel: promoters with higher contact probabilities with TAD boundaries experience stronger drops of contact probability across boundaries. Right panel: promoters closer to TAD boundaries experience a stronger drop of contact probability across boundaries.

Comment in

References

    1. Nora EP, et al. Spatial partitioning of the regulatory landscape of the X-inactivation centre. Nature. 2012;485:381–385. doi: 10.1038/nature11049. - DOI - PMC - PubMed
    1. Dowen JM, et al. Control of cell identity genes occurs in insulated neighborhoods in mammalian chromosomes. Cell. 2014;159:374–387. doi: 10.1016/j.cell.2014.09.030. - DOI - PMC - PubMed
    1. Lupiáñez DG, et al. Disruptions of topological chromatin domains cause pathogenic rewiring of gene-enhancer interactions. Cell. 2015;161:1012–1025. doi: 10.1016/j.cell.2015.04.004. - DOI - PMC - PubMed
    1. Hnisz D, et al. Activation of proto-oncogenes by disruption of chromosome neighborhoods. Science. 2016;351:aad9024. doi: 10.1126/science.aad9024. - DOI - PMC - PubMed
    1. Long HK, Prescott SL, Wysocka J. Ever-changing landscapes: transcriptional enhancers in development and evolution. Cell. 2016;167:1170–1187. doi: 10.1016/j.cell.2016.09.018. - DOI - PMC - PubMed

Publication types

LinkOut - more resources