. 2022 Jun;606(7913):368-374.
doi: 10.1038/s41586-022-04597-1. Epub 2022 Apr 13.

Prolonged viral suppression with anti-HIV-1 antibody therapy

Affiliations

Prolonged viral suppression with anti-HIV-1 antibody therapy

Christian Gaebler et al. Nature. 2022 Jun.

Abstract

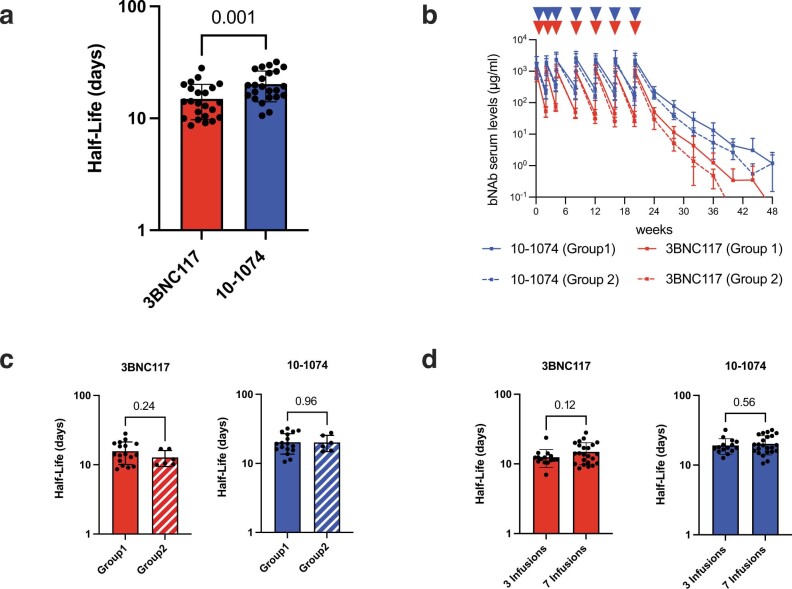
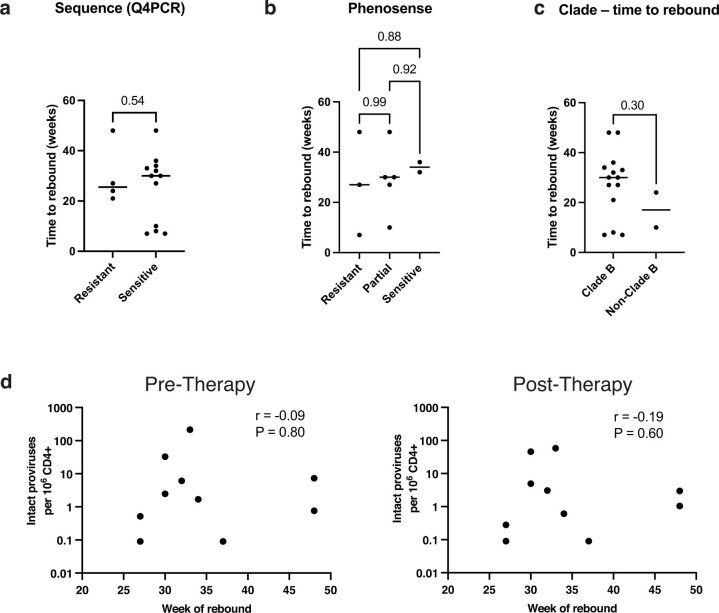
HIV-1 infection remains a public health problem with no cure. Anti-retroviral therapy (ART) is effective but requires lifelong drug administration owing to a stable reservoir of latent proviruses integrated into the genome of CD4+ T cells1. Immunotherapy with anti-HIV-1 antibodies has the potential to suppress infection and increase the rate of clearance of infected cells2,3. Here we report on a clinical study in which people living with HIV received seven doses of a combination of two broadly neutralizing antibodies over 20 weeks in the presence or absence of ART. Without pre-screening for antibody sensitivity, 76% (13 out of 17) of the volunteers maintained virologic suppression for at least 20 weeks off ART. Post hoc sensitivity analyses were not predictive of the time to viral rebound. Individuals in whom virus remained suppressed for more than 20 weeks showed rebound viraemia after one of the antibodies reached serum concentrations below 10 µg ml-1. Two of the individuals who received all seven antibody doses maintained suppression after one year. Reservoir analysis performed after six months of antibody therapy revealed changes in the size and composition of the intact proviral reservoir. By contrast, there was no measurable decrease in the defective reservoir in the same individuals. These data suggest that antibody administration affects the HIV-1 reservoir, but additional larger and longer studies will be required to define the precise effect of antibody immunotherapy on the reservoir.


Conflict of interest statement

There are patents on 3BNC117 (PTC/US2012/038400) and 10-1074 (PTC/US2013/065696) that list M.C.N. and J.F.S. as inventors. 3BNC117 and 10-1074 are licensed to Gilead by Rockefeller University from which M.C.N. and J.F.S. have received payments. M.C.N. is a member of the Scientific Advisory Boards of Celldex, Walking Fish, and Frontier Biotechnologies. J.F.S. and M.C.N had no control over the direction, and ultimately the reporting, of the clinical portion of the research while holding their financial interests, which were reviewed and are managed by the Rockefeller University and Massachusetts General Hospital and Mass General Brigham in accordance with their conflict of interest policies. J.D.R and C.J.P. are employees of Labcorp-Monogram Biosciences.

Figures

Fig. 1
Fig. 1. Study design and pharmacokinetics of 3BNC117 and 10-1074.
a, Study design. Diamond represents time points of leukapheresis. Red and blue triangles represent 3BNC117 and 10-1074 infusions, respectively. Wk, week. b, Levels of 3BNC117 (red) and 10-1074 (blue) in serum (n = 23 participants), as determined by TZM-bl assay. Data are mean ± s.d. Red and blue triangles indicate 3BNC117 and 10-1074 infusions, respectively. Mean half-life (t1/2) of each bNAb is indicated in days.
Fig. 2
Fig. 2. Virological and pharmacokinetic follow-up of individual participants.
a, Plasma HIV-1 RNA levels (black line; left y-axis) and bNAb serum concentrations (3BNC117, red; 10-1074, blue; right y-axis) for group 1 participants who maintained viral suppression (n = 13) or resumed ART (n = 4) during the dosing period as well as group 2 (n = 6) participants. Red and blue triangles indicate 3BNC117 and 10-1074 infusions, respectively. Grey shaded areas indicate time on ART. The lower limit of detection of HIV-1 RNA was 20 copies per ml. Asterisk indicates participants with protocol deviations regarding analytical treatment interruption. Participant 5115 resumed ART before week 31 but did not achieve full viral suppression owing to non-compliance to a daily regimen. Participant 5128 resumed ART at week 48 and achieved full viral suppression at an additional week 52 study visit. b, Kaplan–Meier plots summarizing time to viral rebound after ART discontinuation (left) or after the last antibody infusions (right) for all group 1 participants receiving up to seven infusions (n = 16, green line). The dotted blue line indicates a cohort of individuals who received three infusions of the antibody combination (n = 15 participants). The y-axis indicates the percentage of participants who maintained viral suppression. The x-axis indicates the number of weeks after the start of analytical treatment interruption (ATI) (left) and the number of weeks after the last infusion (right). Participant 5122M was excluded from the analysis owing to COVID-19 related re-initiation of ART. Participant 5104 showed two viral blips of <500 copies per ml that were subsequently controlled before rebounding with sustained viraemia at week 33. c, Kaplan–Meier plots summarizing time to viral rebound for group 1 (green line) and group 2 (dotted green line) participants, respectively. Grey shaded area indicates time on ART for group 2 participants. Participant 5216 decided against ART interruption and was excluded from the analysis. Log–rank (Mantel–Cox) test was used to determine statistical significance in b, c.
Fig. 3
Fig. 3. Post hoc sensitivity analysis of reservoir and plasma rebound viruses and impact on time to viral rebound.
Latent reservoir (left) and plasma rebound viruses (right) from participants in group 1 (n = 16) were phenotypically and genotypically analysed for resistance to 10-1074 and 3BNC117, respectively (Methods). Sequence analysis was based on env sequences recovered by limiting-dilution PCR at baseline or by Q4PCR from all time points tested. The middle panel depicts time to viral rebound in ascending order. PhenoSense Monoclonal Antibody Assay antibody-sensitive (IC90 < 1 μg ml−1) and -resistant viruses (IC90 > 1 μg ml−1) are depicted with green and red squares, respectively. Sequence analysis of antibody-sensitive (absence of resistant viruses) or -resistant (identification of one or more resistant viruses) viruses are depicted in green and red squares, respectively. The number depicted in the squares represents the number of sequences analysed. Participant samples for which no results or sequences could be obtained are depicted in grey. Participants who maintained viral suppression without experiencing rebound are shown with a blue square. Samples that were not analysed are indicated with a white square.
Fig. 4
Fig. 4. Reservoir quantification and composition.
a, Frequency of intact and defective proviral genomes per 106 CD4+ T cells (log normalized) as determined by Q4PCR pre-therapy and post-therapy (26 weeks) for bNAb therapy with participants who have been on ART for at least 7 years (top, circles) and baseline and follow-up (24–58 weeks) for ART-alone (bottom, squares) groups, respectively. All participants with paired reservoirs measurements were included (bNAb therapy with at least 7 years ART n = 12, ART alone n = 10). Open symbols represent lower limit of detection (defined as half of intact proviral frequency assuming one intact proviral genome in the total number of analysed cells without target identification). Green and red horizontal bars depict mean ± s.d. of intact and defective proviral frequencies, respectively. b, Longitudinal changes in relative representation of proviral subtypes in the bNAb therapy with at least 7 years ART (top) and ART-alone (bottom) groups, respectively. Depicted are the fractions of intact and defective proviral subtypes relative to total proviruses recovered from each participant at the indicated time point. Proviral subtypes: intact; SV, structural variation; MIG, missing internal gene; LTR, LTR defects; MSD, major splice donor mutation; and NF, non-functional. Participants in whom at least one intact proviral genome was recovered are shown (bNAb therapy with at least 7 years ART n = 11, ART alone n = 9). Horizontal bars show median and interquartile range. c, Relative change in proviral frequencies (indicated at the bottom of each dataset) between pre-therapy (T1) and post-therapy time points (T2) for intact (green) and defective (red) proviral frequencies in bNAb therapy (circles) and ART-alone (squares) groups, respectively. Horizontal bars indicate median change. Open square with cross represents individual data point outside the y-axis range (relative change TSC − 127 = 0.09). P-values are shown at the top of graphs and were determined using two-tailed paired Student’s t-test in a and two-tailed Wilcoxon matched-pairs signed-rank test in b, c.
Extended Data Fig. 1
Extended Data Fig. 1. Study participant selection.
a, Diagram depicts the selection of study participants. b, Comparison of time since HIV diagnosis between bNAb Therapy and ART-alone group. Statistical significance was determined using two-tailed Mann–Whitney U-test. Horizontal bars indicate median values c, Comparison of time of uninterrupted ART between bNAb Therapy and ART alone group for all participants (left panel) and all participants with uninterrupted ART for at least 7 years (right panel). Statistical significance was determined using two-tailed Mann–Whitney U-test. Horizontal bars indicate median values. d, Absolute CD4+ T cell counts at time of first antibody infusion (n = 18), time of viral rebound (n = 19) and at the end of the study (n = 18) (see also Supplementary Tables 4 and 5). Red lines indicate mean, error bars indicate standard deviation and individual participants are shown as dots.
Extended Data Fig. 2
Extended Data Fig. 2. CD4+ and CD8+ T cell activation patterns pre- and post-Therapy.
a, Gating strategy used to define total CD4+ (blue) and CD8+ (red) T cells. Dump channel includes CD19, CD20, CD14 and CD66b as well as Live/Dead. CD4+ T cells are identified as Dump−CD14−CD3+CD4+, whereas CD8+ T cells are Dump−CD14−CD3+CD8+. b, Representative flow cytometry plots and frequencies of CD4+ T cells expressing CD38, CD69, CD71, CD25, CD152, CD279, TIGIT, CD223 and CD366. c, Representative flow cytometry plots and frequencies of CD8+ T cells expressing CD38, CD69, CD71, CD25, CD152, CD279, TIGIT, CD223 and CD366. Relative change in frequencies was assessed between pre-therapy (T1) and 26-week post-therapy time points (T2). All panels represent the mean ± SD of 11 different donors. Significance was determined by two-tailed paired Student’s t-test.
Extended Data Fig. 3
Extended Data Fig. 3. Pharmacokinetics of 3BNC117 and 10-1074.
a, Scatter bar plots show half-lives of 3BNC117 (red) and 10–1074 (blue). Each dot represents a single participant (n = 23). Bars show mean values and standard deviation. Statistical significance was determined using a two-tailed paired t-test. b, 3BNC117 (red) and 10–1074 (blue) levels in serum for Group 1 (n = 17) and Group 2 (n = 6) participants. Curves indicate mean serum antibody concentrations and error bars represent standard deviation. c, Scatter bar plots show half-lives of 3BNC117 (red) and 10–1074 (blue) separated for Group 1 (n = 17) and Group 2 (n = 6) participants. Each dot represents a single participant. Bars show mean values and standard deviation. Statistical significance was determined using a two-tailed unpaired t-test. d, 3BNC117 (red) and 10-1074 (blue) half-live comparison between individuals receiving up to 3 infusions of the combination of 3BNC117 + 10–1074 (n = 15) and participants receiving up to 7 infusions of the combination of 3BNC117 + 10–1074 (n = 23). Each dot represents a single participant. Bars show mean values and standard deviation. Statistical significance was determined using a two-tailed unpaired t-test.
Extended Data Fig. 4
Extended Data Fig. 4. Time to viral rebound.
a, Comparison of time to viral rebound between Group 1 participants with genotypically 10-1074 resistant or sensitive reservoir viruses recovered by Q4PCR. Black line depicts median. Statistical significance was determined using a two-tailed unpaired t-test. b, Comparison of time to viral rebound between Group 1 participants with phenotypically resistant (n = 3), partially resistant (n = 5) or sensitive (n = 2) reservoir viruses to 3BNC117 and 10–1074 by PhenoSense. Black line depicts median. Statistical significance was determined using one-way ANOVA with Tukey multiple comparison test. c, Comparison of time to viral rebound between Group 1 that harbor clade B (n = 15) and non-clade B viruses (n = 2), respectively. Black line depicts median. Statistical significance was determined using a two-tailed unpaired t-test. d, Intact proviral frequency per 106 CD4 T cells versus time of viral rebound in the Group 1 participants that remained suppressed after week 20 (n = 10). Graphs show the correlation at pre- (left) and post-therapy (right) time points, respectively. The r and P values were determined by two-tailed Pearson’s correlations.
Extended Data Fig. 5
Extended Data Fig. 5. Reservoir sequence analysis.
a, Pie charts depict the distribution of recovered intact and defective proviral sequences. Left pie chart shows the distribution of all 6915 recovered from 33 participants. Middle and right pie charts show the distribution for participants in the bNAb Therapy and ART alone groups, respectively. The number in the middle of the pie represents the total number of proviruses sequenced. Pie slices indicate the proportion of sequences that were intact or had different defects, including structural variation (yellow), missing internal genes (red), LTR defects (orange), MSD mutation (blue) and non-functional (pink). b, Graph depicts the paired measurements of the intact and defective proviral reservoir size in the bNAb Therapy (left panel) and ART alone (right panel) groups. Y-axis shows frequencies of intact or defective proviruses per 106 CD4+ T cells. X-axis depicts time in weeks. Paired measurements with a relative decrease or increase are shown with a solid or dotted line, respectively. c, Pie charts depict the distribution of recovered intact and defective proviral sequences at pre- and post-therapy (bNAb Therapy group, left panel) or baseline and follow-up time point (ART alone group, right panel). The number in the middle of the pie represents the total number of proviruses sequenced. Only participants for whom at least one intact proviral genome was recovered are included (bNAb Therapy n = 14, ART alone n = 9).
Extended Data Fig. 6
Extended Data Fig. 6. Phylogenetic tree of reservoir and rebound viruses.
Maximum likelihood phylogenetic trees of complete env sequences obtained from 36 participants (including sequences recovered from NIH/NIAID participants; no complete env sequence obtained from participant 5123) by Q4PCR and when available rebound viruses from SGA. Participants are indicated in individual colours. Red triangles indicate rebound viruses.
Extended Data Fig. 7
Extended Data Fig. 7. Reservoir quantification and composition subgroup analyses.
a–c, Subgroup reservoir analyses for bNAb Therapy group (n = 16) (a); bNAb Therapy group (plus NIH pt., n = 20) including 4 additional participants from a corresponding NIH/NIAID clinical trial (b). Left panels show the frequency of intact and defective proviral genomes per 106 CD4+ T cells (log normalized) as determined by Q4PCR pre-therapy and post-therapy (24–26 weeks) for each respective subgroup. Open symbols represent lower limit of detection (defined as half of intact proviral frequency assuming 1 intact proviral genome/total number of analysed cells without target identification). Green and red horizontal bars depict the mean with SD of intact and defective proviral frequencies, respectively. Statistical significance was determined using two-tailed paired Student’s t-test. Right panels show longitudinal changes in relative representation of proviral subtypes in the respective bNAb Therapy subgroups. Depicted are the fractions of intact and defective proviral subtypes relative to total proviruses recovered from each participant at the indicated time point. Proviral subtypes: Intact, SV, Structural Variation; MIG, Missing Internal Gene; LTR, LTR defects; MSD, Major Splice Donor mutation; NF, Non-Functional. Only participants for whom at least one intact proviral genome was recovered are shown (bNAb Therapy group n = 14; bNAb Therapy group plus NIH pt. n = 17). Horizontal bars show median and interquartile range (IQR). Statistical significance was determined using two-tailed Wilcoxon matched-pairs signed rank test. c, Relative change in proviral frequencies between pre-therapy (T1) and post-therapy time points (T2) for intact (green) and defective (red) proviral frequencies in bNAb Therapy subgroups. Plotted values depict relative change with the black horizontal bars showing the median change. Statistical significance was determined using two-tailed Wilcoxon matched-pairs signed-rank test for matched comparisons within bNAb Therapy subgroups, respectively.
Extended Data Fig. 8
Extended Data Fig. 8. Reservoir quantification and composition ATI+bNAb versus ART+bNAb.
a–c, Subgroup reservoir analysis for Group 1 participants that interrupted ART (ATI+bNAb n = 10) (a), for Group 1 and 4 additional participants from a corresponding NIH/NIAID clinical trial (ATI+bNAb Group 1 plus NIH pt., n = 14) (b), and Group 2 participants that remained on ART (ART+bNAb, n = 6) during bNab therapy (c). Left panels show the frequency of intact and defective proviral genomes per 106 CD4+ T cells (log normalized) as determined by Q4PCR pre-therapy and post-therapy (24–26 weeks). Open symbols represent lower limit of detection (defined as half of intact proviral frequency assuming 1 intact proviral genome/total number of analysed cells without target identification). Scatter plots depict mean with SD. Statistical significance was determined using two-tailed paired Student’s t-test. Right panels show longitudinal changes in relative representation of proviral subtypes in the respective subgroups. Depicted are the fractions of intact and defective proviral subtypes relative to total proviruses recovered from each participant at the indicated time point. Proviral subtypes: Intact, SV, Structural Variation; MIG, Missing Internal Gene; LTR, LTR defects; MSD, Major Splice Donor mutation; NF, Non-Functional. Only participants for whom at least one intact proviral genome was recovered are shown (ATI+bNAb Group 1 n = 8; ATI+bNAb Group 1 plus NIH pt. n = 11, ART+bNAb Group 2 n = 6). Horizontal bars show median and interquartile range (IQR). Statistical significance was determined using two-tailed Wilcoxon matched-pairs signed rank test. d, Relative change in proviral frequencies between pre-therapy (T1) and post-therapy time points (T2) for intact (green) and defective (red) proviral frequencies for ATI+bNab Group 1 (left two columns), ATI+bNAb Group 1 plus NIH (middle two columns), and ART+bNab (right two columns) participants, respectively. Plotted values depict relative change with the black horizontal bars showing the median change. Statistical significance was determined using two-tailed Wilcoxon matched-pairs signed-rank test for matched comparisons within groups.

Comment in

References

    1. Margolis DM, Archin NM. Proviral latency, persistent human immunodeficiency virus infection, and the development of latency reversing agents. J. Infect. Dis. 2017;215:S111–S118. doi: 10.1093/infdis/jiw618. - DOI - PMC - PubMed
    1. Bournazos S, DiLillo DJ, Ravetch JV. The role of Fc–FcγR interactions in IgG-mediated microbial neutralization. J. Exp. Med. 2015;212:1361–1369. doi: 10.1084/jem.20151267. - DOI - PMC - PubMed
    1. Caskey M. Broadly neutralizing antibodies for the treatment and prevention of HIV infection. Curr. Opin. HIV AIDS. 2020;15:49–55. doi: 10.1097/COH.0000000000000600. - DOI - PMC - PubMed
    1. Li JZ, et al. The size of the expressed HIV reservoir predicts timing of viral rebound after treatment interruption. AIDS. 2016;30:343–353. - PMC - PubMed
    1. Liu B, et al. Broadly neutralizing antibody-derived CAR T cells reduce viral reservoir in individuals infected with HIV-1. J. Clin. Invest. 2021;131:e150211. doi: 10.1172/JCI150211. - DOI - PMC - PubMed

MeSH terms