. 2022 Apr;604(7907):757-762.
doi: 10.1038/s41586-022-04575-7. Epub 2022 Apr 13.

The tethered peptide activation mechanism of adhesion GPCRs

Affiliations

The tethered peptide activation mechanism of adhesion GPCRs

Ximena Barros-Álvarez et al. Nature. 2022 Apr.

Abstract

Adhesion G-protein-coupled receptors (aGPCRs) are characterized by the presence of auto-proteolysing extracellular regions that are involved in cell-cell and cell-extracellular matrix interactions1. Self cleavage within the aGPCR auto-proteolysis-inducing (GAIN) domain produces two protomers-N-terminal and C-terminal fragments-that remain non-covalently attached after receptors reach the cell surface1. Upon dissociation of the N-terminal fragment, the C-terminus of the GAIN domain acts as a tethered agonist (TA) peptide to activate the seven-transmembrane domain with a mechanism that has been poorly understood2-5. Here we provide cryo-electron microscopy snapshots of two distinct members of the aGPCR family, GPR56 (also known as ADGRG1) and latrophilin 3 (LPHN3 (also known as ADGRL3)). Low-resolution maps of the receptors in their N-terminal fragment-bound state indicate that the GAIN domain projects flexibly towards the extracellular space, keeping the encrypted TA peptide away from the seven-transmembrane domain. High-resolution structures of GPR56 and LPHN3 in their active, G-protein-coupled states, reveal that after dissociation of the extracellular region, the decrypted TA peptides engage the seven-transmembrane domain core with a notable conservation of interactions that also involve extracellular loop 2. TA binding stabilizes breaks in the middle of transmembrane helices 6 and 7 that facilitate aGPCR coupling and activation of heterotrimeric G proteins. Collectively, these results enable us to propose a general model for aGPCR activation.


Conflict of interest statement

Competing interests

The authors declare no competing interests.

Figures
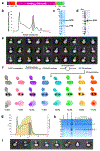
Extended Data Figure 1.
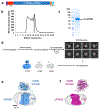
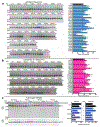
Extended Data Figure 1.. NTF-bound LPHN3 purification and cryo-EM processing.
a, Design for the NTF-bound LPHN3 construct used for structural studies. Human LPHN3 (V1, residues 495-1138) was cloned into pFastBac containing a hemagglutinin signal peptide tag (HA) and a cleavable N-terminal FLAG-tag. The construct included a C-terminal cleavable GFP followed by a His6 tag. b, Size exclusion chromatography (SEC) profile of LPHN3. Samples corresponding to the main monomeric (grey) fractions were combined and used for cryo-EM studies. c, Coomassie stained SDS-PAGE of the pooled protein sample visualized by cryo-EM showing the presence of the N-terminal ECR and the 7TM domain. d, Anti-FLAG Western-blot analysis of the LPHN3 sample purified in detergent. e, Cryo-EM reference-free 2D class averages of LPHN3 purified in detergent and f, processing flow chart of the NTF-bound LPHN3 sample, including particle selection, 2D and 3D classifications. g, Size exclusion chromatography (SEC) of LPHN3 embedded in lipid nanodiscs composed of MSP1D1 and brain polar lipids (BPL). Yellow bars indicate fluorescence of lipids (Ex: 295 nm, Em: 330 nm). Arrowed bars indicate signal overload. Grey shaded area shows fractions that were used for the cryo-EM analysis. h, SDS-PAGE stained with InstantBlue, showing purified MSP1D1, purified LPHN3 in DDM, reconstituted LPHN3 in lipid nanodiscs before SEC, and selected SEC fractions of the nanodiscs. Bold fractions were used for cryo-EM. i, Representative reference free 2D class averages of LPHN3 embedded in lipid nanodiscs.
Extended Data Figure 2.
Extended Data Figure 2.. Full-length GPR56 purification, cryo-EM processing and low resolution 3D maps for NTF bound GPR56 and LPHN3.
a, Design for the full-length cleavage deficient (CD, H381S) GPR56 construct used for structural studies. Human GPR56 (V2-FL) was cloned into pFastBac containing a hemagglutinin signal peptide tag (HA) and a cleavable N-terminal FLAG-tag. The construct included a C-terminal cleavable His6 tag. b, Size exclusion chromatography (SEC) profile of full-length GPR56. Fractions corresponding to the monomeric peak (grey) were collected and used for structural studies. c, Coomassie stained SDS-PAGE of the FL-GPR56 sample used for cryo-EM analysis. d, Cryo-EM data processing workflow of the FL-GPR56 sample. e, f. Low resolution 3D maps of NTF-bound receptor conformations with docked structures of the ECR of e, GPR56 and f, LPHN3. The GAIN domains and TA peptides are colored in blue and cyan for GPR56 and in magenta and light pink for LPHN3. Domains are labeled. Docked available ECR crystal structures corresponding to PDB 5KVM and 4DLQ for GPR56 and LPHN1, respectively. Scale bars are provided in the left bottom corner.
Extended Data Figure 3.
Extended Data Figure 3.. Construct design and purification of active-state GPR56 and LPHN3 in complex with miniG13 protein.
a, Design for the tethered agonist complex constructs used in the study. Receptors are presented on top, where sequences corresponding to the TA and 7TM regions of GPR56 and LPHN3 were inserted after a hemagglutinin signal peptide (HA) and a methionine residue. Expression vector for the miniG13 heterotrimer presented at the bottom. b, The MiniGα13/i15 sequence. Residues at the N-terminus corresponding to Gαi2 sequence are in grey. The linker replacing the alpha helical domain is in yellow. Residues corresponding to the stabilizing mutations G57DS1H1.3, E58NS1H1.4, S248DS4.7, E251DS4H3.3, I271DH3.8, I355AH5.4, V358IH5.7 are underlined and presented in bold. c, Size-exclusion chromatography (SEC) profiles of purified miniG13-coupled GPR56 (left) and -LPHN3 (right) with insets showing Coomassie-stained SDS-PAGE of the SEC complex peaks.
Extended Data Figure 4.
Extended Data Figure 4.. Single-particle cryo-EM processing workflow and reconstructions of the GPR56/miniG13 complex.
a, Workflow of cryo-EM data processing for the active-state tethered agonist bound 7TM-GPR56/miniG13 complex. b, Angular distribution heat map of particle projections for 7TM-GPR56/miniG13 reconstruction. c, Gold standard Fourier shell correlation (FSC) curve for receptor and miniG13 reconstructions. Dashed line represents the overall nominal resolution of each reconstruction at 0.143 FSC calculated by CryoSPARC. d, Overall composite cryo-EM map for the 7TM-GPR56/miniG13 complex with chain assignments for its components. e, Cryo-EM density for TMs 1-7, the α5 helix of miniGα13/i and the bound tethered agonist for the 7TM-GPR56/miniG13 complex.
Extended Data Figure 5.
Extended Data Figure 5.. Single-particle cryo-EM processing workflow and reconstructions of the LPHN3/miniG13 complex.
a, Workflow of cryo-EM data processing for the active-state tethered agonist bound 7TM-LPHN3/miniG13 complex. b, Angular distribution heat map of particles for 7TM-LPHN3/miniG13 reconstruction. c, Gold standard Fourier shell correlation (FSC) curve for receptor and miniG13 reconstructions. Dashed line represents the overall nominal resolution of each reconstruction at 0.143 FSC calculated by CryoSPARC. d, Overall composite cryo-EM map for the 7TM-LPHN3/miniG13 complex with chain assignments for its components. e, Cryo-EM density for TMs 1-7, the α5 helix of miniGα13/i and the bound tethered agonist for the 7TM-LPHN3/miniG13 complex.
Extended Data Figure 6.
Extended Data Figure 6.. Kinetic G13 GTPγS binding assays for GPR56 and LPHN3 mutants and cell surface abundances of selected mutants.
Kinetic measurements of receptor-stimulated G protein 13 [35S]- GTPγS binding in membranes normalized to the activities of wild type (WT) GPR56 or LPHN3. 7TM/CTF-only truncated receptors with a, b, point mutations at the TA residues. c, d, TA-interacting point mutants. e, f, G protein interaction site point mutants. g, h, 7TM core-stabilizing point mutants. Note: GPR56 Q644A and LPHN3 E948A were found at low abundance, thus potentially explaining their reduced activities. i, Equivalent amounts of WT, W6176.53A, F6377.42A, and F4542.64A full-length GPR56 holoreceptors were activated by ice-cold urea treatment to dissociate NTFs from CTFs prior to measurement of G13 initial GTPγS binding rates at 20 °C. The urea-dependent changes in approximated initial linear rates demonstrate that wild type GPR56 was activated by urea significantly more than each mutant, indicating that the mutations impart reduced functional activity and that the mutant receptors are not completely dysfunctional or mis-folded. Data represent the average of each kinetic reaction measured as technical triplicates with error bars representing +/− S.D. Unpaired, two-tailed student’s t tests were used to determine significance between initial rates. * = p < 0.05, **** = p < 0.0001. j, Relative aGPCR cell surface levels for selected mutants and WT receptors were measured by intact cell biotinylation, streptavidin pulldown and anti-His tag immunoblotting.
Extended Data Figure 7.
Extended Data Figure 7.. Western Blot quantification of relative abundances of mutant receptors evaluated in G13 GTPγS assays.
a, Relative abundances of CTF-only truncated GPR56 receptors in membrane homogenates determined by immunoblotting for anti-His tag. b, Relative abundances of CTF-only truncated LPHN3 receptors in membrane homogenates determined by immunoblotting for anti-His tag. c, Relative abundances of holoreceptor GPR56 NTFs and CTFs before and after treatment of membrane homogenates with ice-cold 6M urea. CTF was immunoblotted for via a GPR56-specific CTF antibody, and NTF was immunoblotted for via a GPR56-specific NTF antibody. *Multiple glycosylated NTF bands. Data represent the mean band intensity of western blots performed in triplicate with error bars representing +/− S.D. Unpaired, two-tailed student’s t tests were used to determine significance between wild type and mutant receptors with reduced abundances. * = p < 0.05.
Extended Data Figure 8.
Extended Data Figure 8.. Additional structural elements involved in the active conformation of TA-bound GPR56 and LPHN3 7TM domain, and MD simulations for TA-bound LPHN3.
a, b, Density corresponding to the TA peptide and ECL2 in GPR56 (a) and LPHN3 (b), indicating that the TA and loop are penetrating the 7TM cavity. c, d, Residues surrounding the toggle switch residue (W6.53) in GPR56 (c) and LPHN3 (d). Electrostatic interactions are shown as dotted grey lines. e, Superposition of GPR56 and LPHN3, showing similarities in 7TM domain conformation. f, G13 GTPγS binding activity for mutants LPHN3 (magenta) and GPR56 (blue) that interact with W6.53. Data represent mean of biologically independent reactions performed in triplicate with error bars representing +/− S.D. RM one-way ANOVA was used to determine significance between mutants and WT. g-h, Molecular dynamics simulations for the LPHN3 tethered agonist and its binding to the 7TM domain. g, Four snapshots of the LPHN3 TA peptide MD simulations in solution spaced 200 ns apart. h, Average secondary structure percentages of LPHN3 peptide from MD simulations. ‘α’ refers to the very broad range of −160 ≤ φ; ≤ −20; −120 ≤ ψ ≤ 50; ‘β’, beta-sheet; ‘PP2’, polyproline 2. i, j, Cryo-EM structure of LPHN3 colored by the difference in RMSF values between wild-type MD simulations and simulations with the tethered agonist (TA) region (dark gray) removed. Positive values indicate an increase in flexibility when the TA is deleted. I and j correspond to two different color scales.
Extended Data Figure 9.
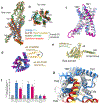
Extended Data Figure 9.. Structural comparisons of receptor and bound G13 protein for GPR56 and LPHN3, and experimental data for G13 N-terminal construct design.
a-b, Overall structural comparison of 7TM domains of G protein coupled GPR56 (blue) with active state Family B1 receptors: GLP1R (PDB ID: 5VAI; receptor in brown, GLP1 peptide in tan), GCGR (PDB ID: 6WPW; receptor in dark green, glucagon derivative ZP3780 in light green) and calcitonin receptor (PDB ID: 5UZ7; orange). a, side view showing similarities in 7TM domain topology and b, top view with superposition of B1 agonists with GPR56 TA in the orthosteric site. c, Superposition of glucocorticoid ligand-bound GPR97 (PDB ID: 7D77, light grey) with GPR56 (blue) and LPHN3 (magenta). Arrows are indicating differences in TM1, TM6 and TM7 between the ligand and to TA-bound structures. d, Top view of superimposed GPR56 and LPHN3 complexes showing positioning of mini-G13 N-terminal helix (αN) with respect to the receptor TMs. e, Superposition of GPR56 bound mini-Gα13 (gold) vs. 5HT1A (PDB ID: 6G79) bound mini-Gαo (green). f, GTPγS binding assay for recombinant G13 proteins in which the authentic N-terminus of Gα13 was replaced with 15 or 29 residues of the Gαi2 αN to improve expression, stability and ability to interact with receptor. Stimulation of G13/i29 nucleotide exchange by both receptors GPR56 (blue) and LPHN3 (magenta) was reduced substantially when compared to wild type G13 or G13/i15. Receptor constructs used in this assay are the TA-decrypted GPR56 and LPHN3. Data displayed as mean of reactions (n=18 for all except GPR56 + G13/i29, n=17, and LPHN3 + G13/i29, n=16) with error bars representing +/− S.E.M. Statistical significance between experimental condition and corresponding control group was calculated using Mann-Whitney analysis, n.s. = not significant, **** = p < 0.0001. g, G protein binding through α5 helix of mini-Gα13 (gold) by GPR56 (blue) and mini-Gαo (red) by GPR97 (PDB ID: 7D77, in white) showing substantially greater opening of TM5-6 in the GPR56 TA-bound structure.
Fig. 1 |
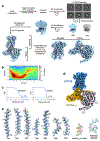
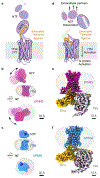
Fig. 1 |. Cryo-EM reconstructions for GPR56 and LPHN3.
a, Cartoon representation of a self-cleaved NTF-bound aGPCR. The encrypted tethered agonist (TA, orange) resides in a β-strand conformation within the core of the GAIN domain. b, c, Low resolution maps for NTF-bound state receptors showing flexibility of the ECR. Side and top views of b, LPHN3 (magenta) and c, GPR56 (blue). Maps are the result of 3D classification, with three distinct classes of LPHN3 superimposed. Dashed arrows indicate NTF mobility. d, Interactions of the NTF with extracellular partners are proposed to result in its dissociation from the CTF, thereby decrypting the TA peptide in the extracellular space. Binding of the TA within the 7TM domain (CTF) orthosteric site stabilizes an active receptor conformation that induces G protein nucleotide exchange and elicits intracellular signaling. e, f, High resolution maps for active-state GPR56 and LPHN3 complexes with G protein. The micelle-embedded 7TM domains are coupled to miniG13 heterotrimer. The cryo-EM maps have been assigned and colored accordingly. In b-f, scale bars are indicated.
Fig. 2 |
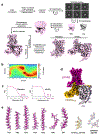
Fig. 2 |. Structures of active-state GPR56 and LPHN3 complexes with bound tethered agonist (TA) peptide.
a, Decrypted TA sequence for GPR56 on the left (cyan) and LPHN3 on the right (pink), stalk linker sequences are underlined in black and followed by the 7TM starting with the first TM1 residue V1.34. b, Model for active-state tethered agonist-bound GPR56/miniG13 complex with box around the tethered agonist binding site (left) and cryo-EM density and model for the TA peptide (right). c, Model for active-state tethered agonist-bound LPHN3/miniG13 complex with box around the tethered agonist binding site (right) and cryo-EM density and model for the TA peptide (left). d, Top-down views of active-state GPR56/ (left) and LPHN3/miniG13 (right) complexes. Black arrows point to the tethered agonist bound to the 7TM domains and to the stalk linkers emanating from TM1.
Fig. 3 |
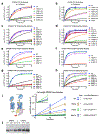
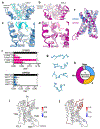
Fig. 3 |. Tethered-peptide-agonist interactions.
a, b, Tethered agonist (TA) interactions with TM1 and TM2 in a, GPR56 and b, LPHN3. c ,d, Activation of reconstituted G13 via GTPγS binding activity assay by TA and TA-interacting mutants for c, GPR56 and d, LPHN3. Data displayed as average of n = 3 biologically-independent reactions with error bars representing ± S.D. Statistical significance between mutant and wild-type receptors was calculated using RM one-way ANOVA analysis, n.s. = not significant, * = p < 0.05, ** = p < 0.01. e, f, TA interactions with ECL2 and the hydrophobic core in e, GPR56 and f, LPHN3. GPR56 7TM in blue and TA in cyan, LPHN3 7TM in magenta and TA in pink. g, Top view of superposition with GPR97 (PDB ID: 7D77, in white) showing helix rearrangements for TM1, TM6 and TM7 when compared to TA-bound-GPR56 (blue) and -LPHN3 (magenta) and cortisol ligand (carbon atoms in green)-bound GPR97, showing that the cortisol or TA ligands occupy a common orthosteric site within the three receptors.
Fig. 4 |
Fig. 4 |. G protein binding by GPR56 and LPHN3.
a, G protein binding through the mini-G13 α5 helix (α5) with superimposed GPR56 (blue) and LPHN3 (magenta). b, mini-G13 α5 helix (α5) interactions with GPR56 and c, LPHN3. Many of these interactions are conserved. TM3 (L4943.54 and L4973.57), TM5 (M5865.57, I5905.61 and R5925.63), TM6 (T6056.41), and TM7 (M6557.60) of GPR56, and TM3 (M9553.57 and L9563.58), TM5 (M10335.61), TM6 (S10526.37 and I10556.40) and TM7 (Q11057.61) of LPHN3 establish hydrophobic or polar interactions with the Gα13 α5 helix. d, ICL2 interactions with the mini-G13 N-terminal helix (αN) for GPR56 and e, LPHN3. G protein residues labeled in gold, receptor residues labeled in black, hydrogen bond interactions are dashed grey lines.

Comment in

References

    1. Vizurraga A, Adhikari R, Yeung J, Yu M & Tall GG Mechanisms of adhesion G protein–coupled receptor activation. Journal of Biological Chemistry 295, 14065–14083, doi: 10.1074/jbc.REV120.007423 (2020). - DOI - PMC - PubMed
    1. Liebscher I et al. A tethered agonist within the ectodomain activates the adhesion G protein-coupled receptors GPR126 and GPR133. Cell Rep 9, 2018–2026, doi: 10.1016/j.celrep.2014.11.036 (2014). - DOI - PMC - PubMed
    1. Stoveken HM et al. Dihydromunduletone Is a Small-Molecule Selective Adhesion G Protein-Coupled Receptor Antagonist. Mol Pharmacol 90, 214–224, doi: 10.1124/mol.116.104828 (2016). - DOI - PMC - PubMed
    1. Stoveken HM, Hajduczok AG, Xu L & Tall GG Adhesion G protein-coupled receptors are activated by exposure of a cryptic tethered agonist. Proc Natl Acad Sci U S A 112, 6194–6199, doi: 10.1073/pnas.1421785112 (2015). - DOI - PMC - PubMed
    1. Wilde C et al. The constitutive activity of the adhesion GPCR GPR114/ADGRG5 is mediated by its tethered agonist. FASEB J 30, 666–673, doi: 10.1096/fj.15-276220 (2016). - DOI - PubMed