. 2022 Apr;604(7906):517-524.
doi: 10.1038/s41586-022-04618-z. Epub 2022 Apr 13.

Somatic mutation rates scale with lifespan across mammals

Affiliations

Somatic mutation rates scale with lifespan across mammals

Alex Cagan et al. Nature. 2022 Apr.

Abstract

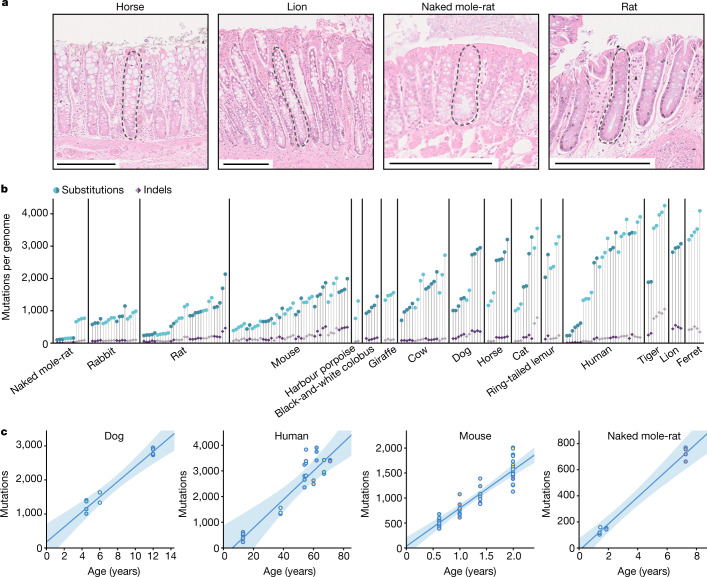
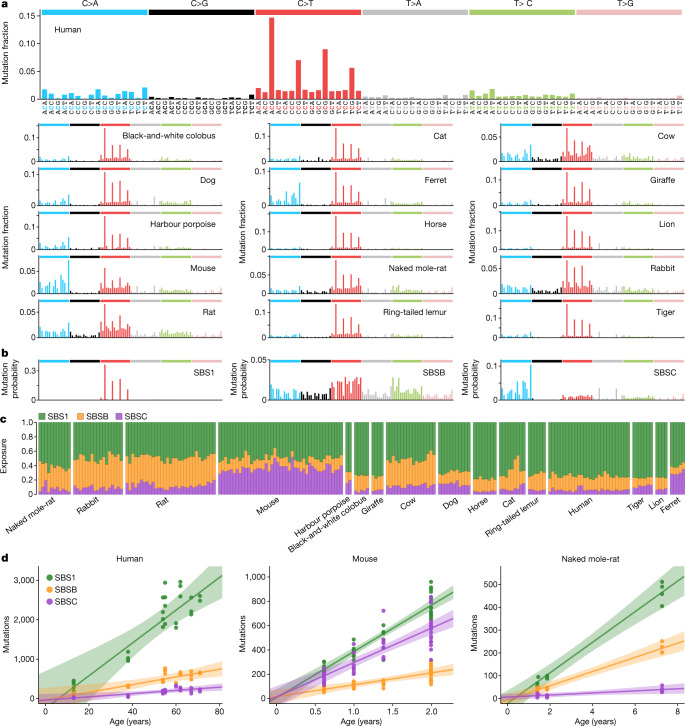
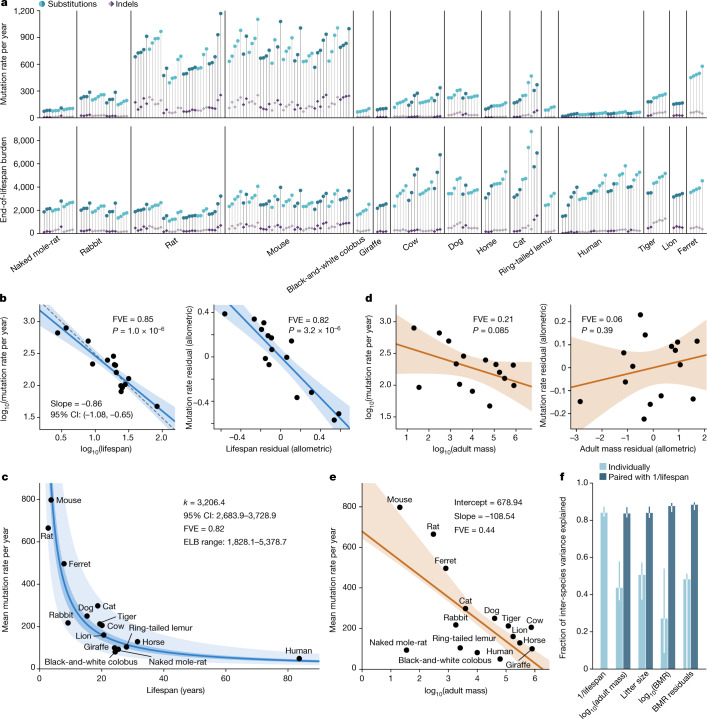
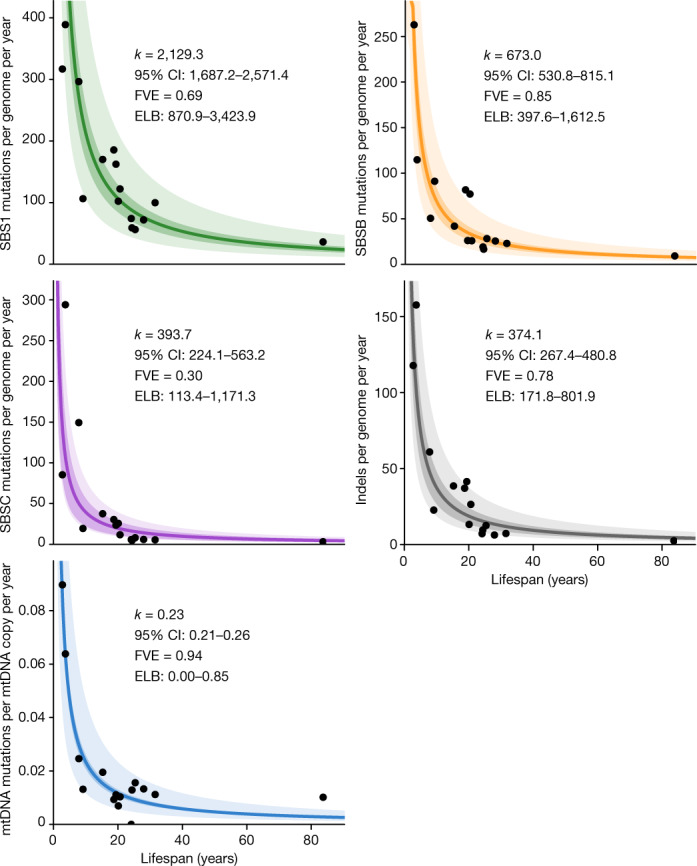
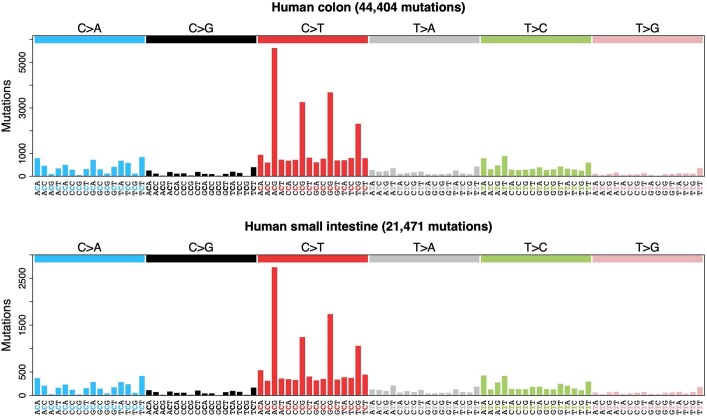
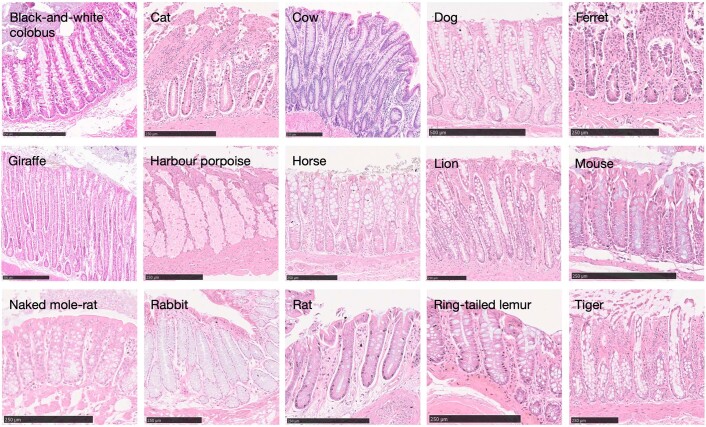
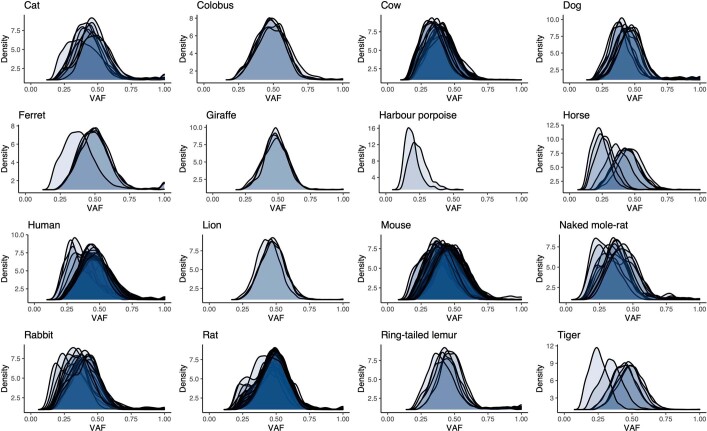
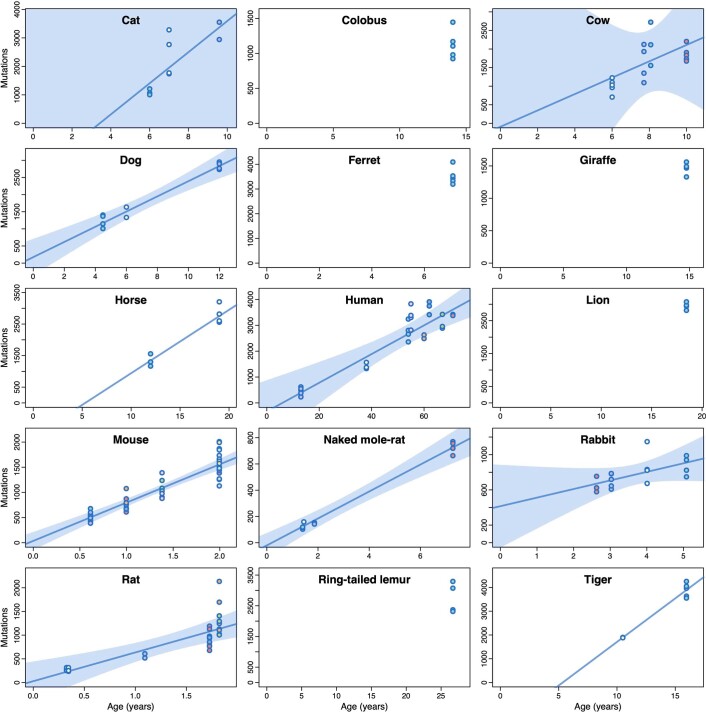
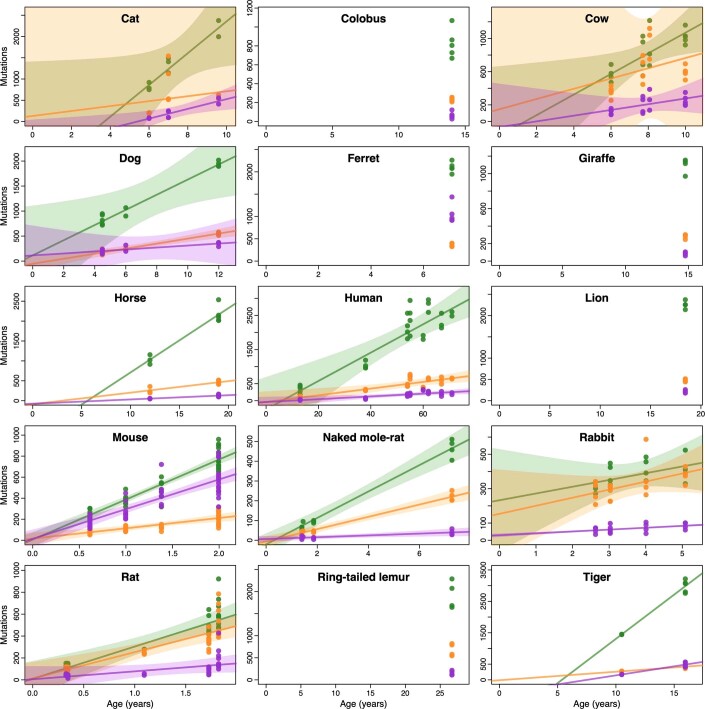
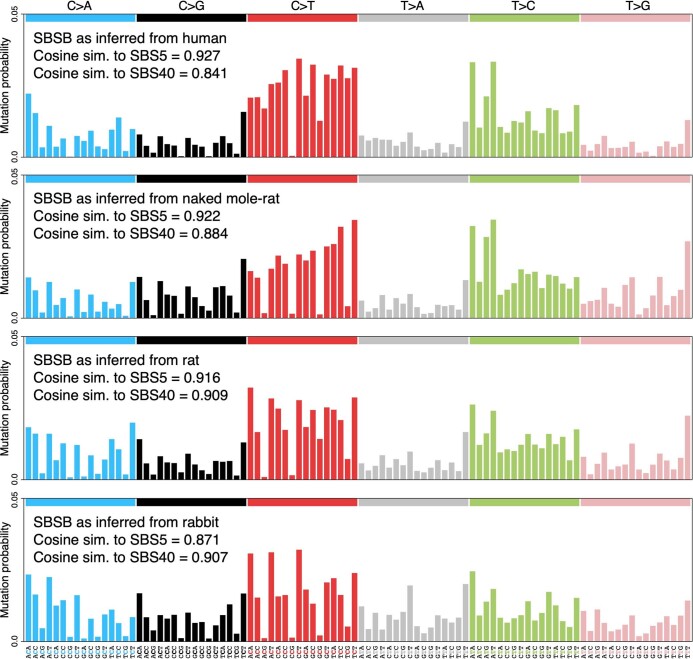
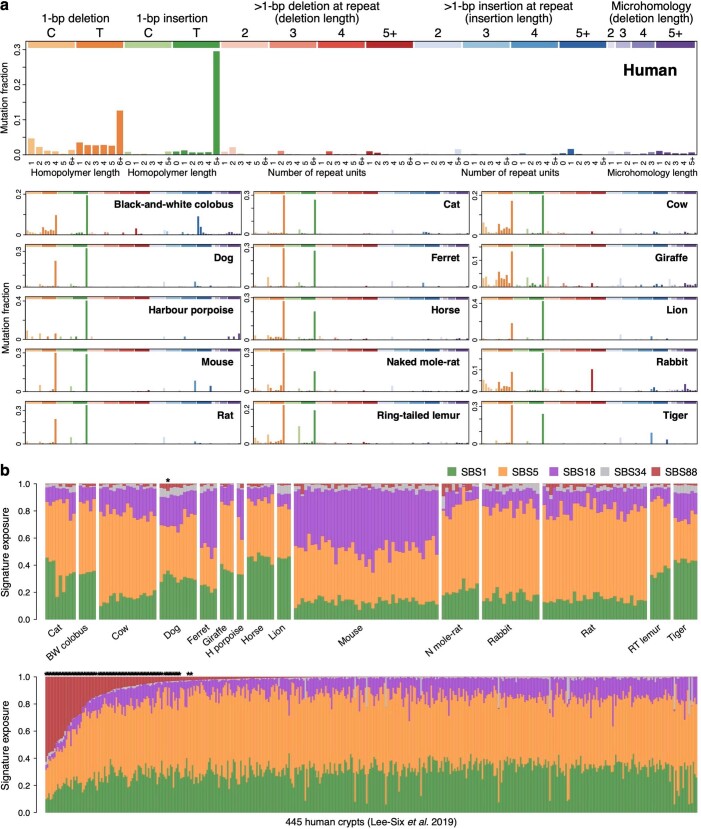
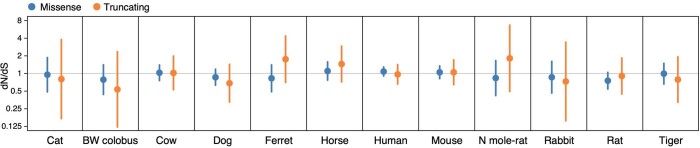
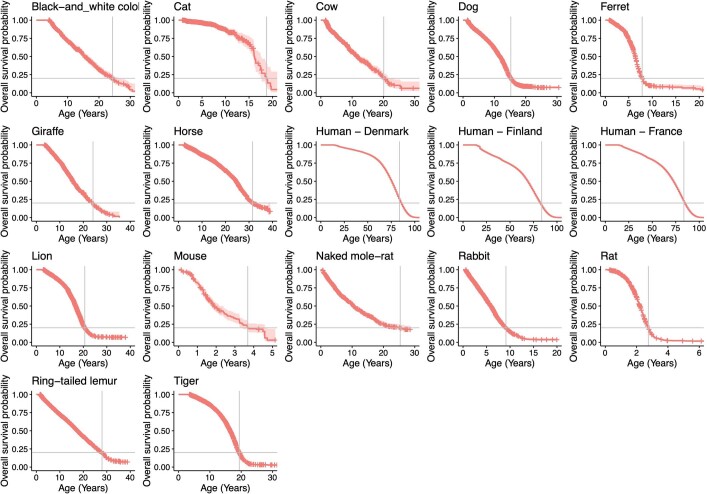
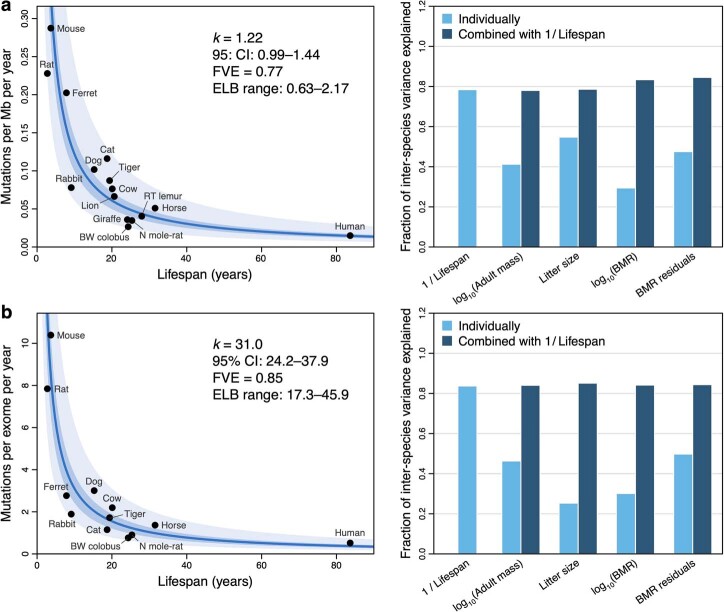
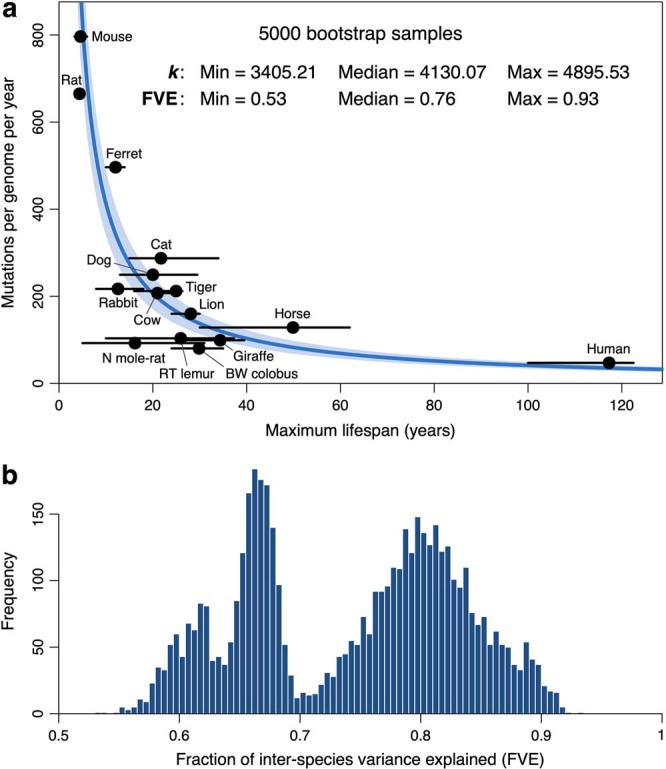
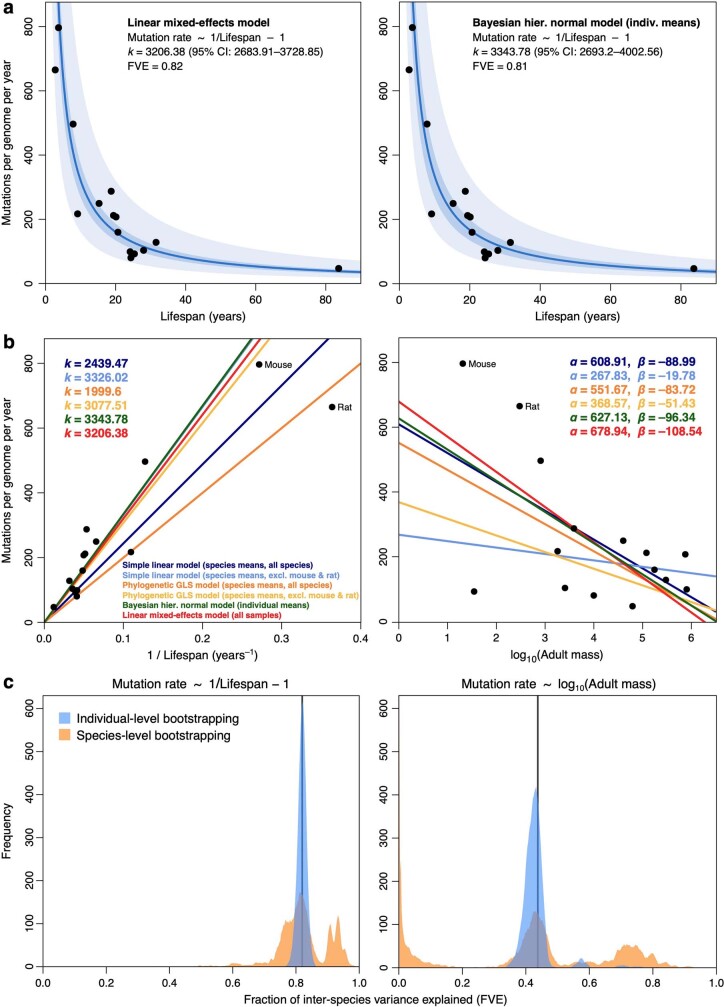
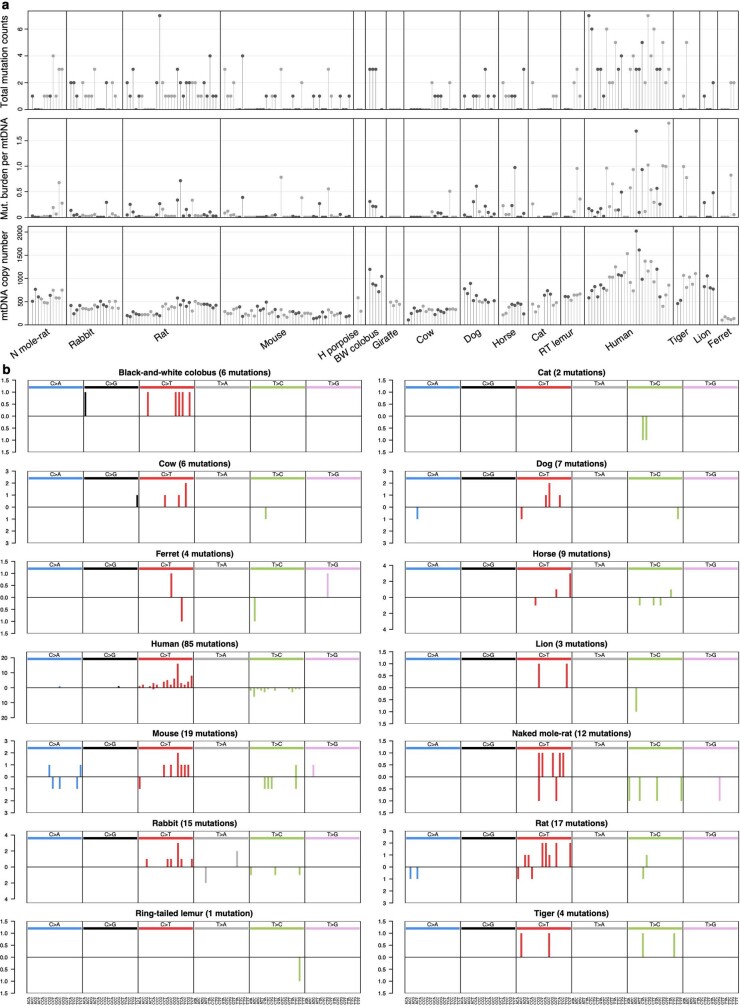
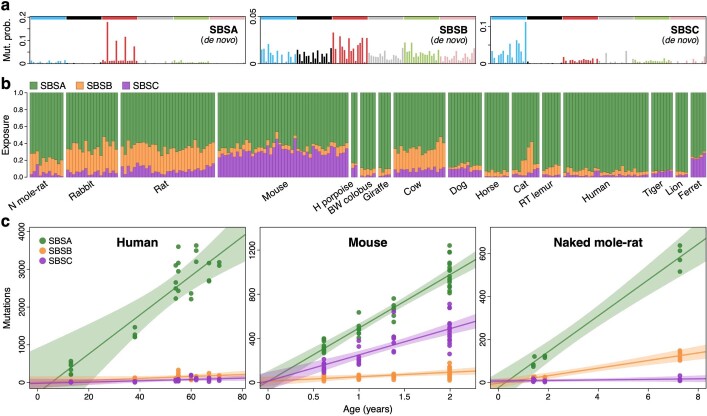
The rates and patterns of somatic mutation in normal tissues are largely unknown outside of humans1-7. Comparative analyses can shed light on the diversity of mutagenesis across species, and on long-standing hypotheses about the evolution of somatic mutation rates and their role in cancer and ageing. Here we performed whole-genome sequencing of 208 intestinal crypts from 56 individuals to study the landscape of somatic mutation across 16 mammalian species. We found that somatic mutagenesis was dominated by seemingly endogenous mutational processes in all species, including 5-methylcytosine deamination and oxidative damage. With some differences, mutational signatures in other species resembled those described in humans8, although the relative contribution of each signature varied across species. Notably, the somatic mutation rate per year varied greatly across species and exhibited a strong inverse relationship with species lifespan, with no other life-history trait studied showing a comparable association. Despite widely different life histories among the species we examined-including variation of around 30-fold in lifespan and around 40,000-fold in body mass-the somatic mutation burden at the end of lifespan varied only by a factor of around 3. These data unveil common mutational processes across mammals, and suggest that somatic mutation rates are evolutionarily constrained and may be a contributing factor in ageing.


Conflict of interest statement

The authors declare no competing interests.

Figures

Fig. 1
Fig. 1. Somatic mutation burden in mammalian colorectal crypts.
a, Histology images of colon samples from horse, lion, naked mole-rat and rat, with one colorectal crypt marked in each. Scale bars, 250 µm. b, Burden of somatic substitutions and indels per diploid genome in each colorectal crypt sample (corrected for the size of the analysable genome). Samples are grouped by individual, with samples from the same individual coloured in the same shade. Species, and individuals within each species, are sorted by mean mutation burden. c, Linear regression of somatic substitution burden (corrected for analysable genome size) on individual age for dog, human, mouse and naked mole-rat samples. Samples from the same individual are shown in the same colour. Regression was performed using mean mutation burdens per individual. Shaded areas indicate 95% confidence intervals of the regression line.
Fig. 2
Fig. 2. Mutational processes in the mammalian colon.
a, Mutational spectra of somatic substitutions in each species. The x axis shows 96 mutation types on a trinucleotide context, coloured by base substitution type. b, Mutational signatures inferred from (SBSB, SBSC) or fitted to (SBS1) the species mutational spectra shown in a, and normalized to the human genome trinucleotide frequencies. The y axis shows mutation probability. c, Estimated contribution of each signature to each sample. Samples are arranged horizontally as in Fig. 1b. d, Linear regression of signature-specific mutation burdens (corrected for analysable genome size) on individual age for human, mouse and naked mole-rat samples. Regression was performed using mean mutation burdens per individual. Shaded areas indicate 95% confidence intervals of the regression line.
Fig. 3
Fig. 3. Associations between somatic mutation rates and life-history traits.
a, Somatic mutation rate per year and expected end-of-lifespan mutation burden (ELB) per crypt. Samples are arranged horizontally as in Fig. 1b; harbour porpoise samples were excluded owing to the age of the sampled individual being unknown. b, Left, allometric regression of somatic mutation rate on lifespan. Right, regression of body-mass-adjusted residuals for somatic mutation rate and lifespan (partial correlation; Methods). Regression was performed using mean mutation rates per species. Shaded areas represent 95% confidence intervals (CI) of regression lines. FVE and P values (by F-test) are indicated (note that, for simple linear regression, FVE = R2). The dashed line denotes a reference slope of –1. c, Zero-intercept LME regression of somatic mutation rate on inverse lifespan (1/lifespan), presented on the scale of untransformed lifespan (x axis). For simplicity, the y axis shows mean mutation rates per species, although rates per crypt were used in the regression. The darker shaded area indicates 95% CI of the regression line, and the lighter shaded area marks a twofold deviation from the line. Point estimate and 95% CI of the regression slope (k), FVE and range of end-of-lifespan burden are indicated. d, Allometric regression and linear regression of lifespan-adjusted residuals, for somatic mutation rate and body mass (elements as described in b). e, Free-intercept LME regression of somatic mutation rate on log-transformed body mass. The y axis shows mean mutation rates per species, although rates per crypt were used in the regression. Shaded area indicates 95% bootstrap interval of the regression line (n = 10,000 replicates). Point estimates of the regression intercept and slope, and FVE, are indicated. f, FVE values for free-intercept LME models using 1/lifespan or other life-history variables (alone or combined with 1/lifespan) as explanatory variables. Error bars indicate 95% bootstrap intervals (n = 10,000).
Fig. 4
Fig. 4. Association between mutation rate subtypes and species lifespan.
Zero-intercept LME regression of somatic rates of signature-specific substitutions, indels and mtDNA mutations on inverse lifespan (1/lifespan), presented on the scale of untransformed lifespan (x axis). For simplicity, y axes present mean mutation rates per species, although mutation rates per crypt were used in the regressions. The darker shaded areas indicate 95% confidence intervals (CI) of the regression lines, and the lighter shaded areas mark a twofold deviation from the regression lines. Point estimates and 95% CI of the regression slope (k), fraction of inter-species variance explained by for each model (FVE) and ranges of end-of-lifespan burden (ELB) are indicated.
Extended Data Fig. 1
Extended Data Fig. 1. Somatic mutational spectra of human colon and small intestine.
Trinucleotide-context mutational spectra of somatic substitutions from human adult stem cells in colon (top) and small intestine, using mutation calls obtained from a previous study.
Extended Data Fig. 2
Extended Data Fig. 2. Histology images of intestinal crypts across species.
Histological images of the colorectal or intestinal (ferret) epithelium for each non-human species. Scale bars are provided at the bottom of each image.
Extended Data Fig. 3
Extended Data Fig. 3. Somatic VAF distributions per species.
Distributions of variant allele fraction (VAF) for somatic substitutions in each crypt for each species. Each distribution refers to the variants in a single sequenced crypt.
Extended Data Fig. 4
Extended Data Fig. 4. Somatic mutation accumulation across species.
Each panel presents somatic substitution burdens per genome (corrected for analysable genome size) for a given species. Each dot represents a crypt sample, with samples from the same individual sharing the same colour. For species with two or more individuals, the estimated regression line from a simple linear regression model on individual mean burdens is shown. For species with three or more individuals, the shaded region indicates 95% confidence intervals of the regression line. Harbour porpoise samples were excluded owing to unknown age of the sampled individual.
Extended Data Fig. 5
Extended Data Fig. 5. Signature-specific mutation accumulation across species.
Each panel presents somatic substitution burdens per genome for mutational signatures SBS1 (green), SBSB (yellow) and SBSC (purple) in a given species. For species with two or more individuals, the estimated regression lines from simple linear regression models on individual mean burdens per signature are shown. For species with three or more individuals, shaded regions indicate 95% confidence intervals of the regression lines. Harbour porpoise samples were excluded owing to unknown age of the sampled individual.
Extended Data Fig. 6
Extended Data Fig. 6. Profiles of signature SBSB as inferred from different species.
Trinucleotide-context mutational spectra of signature SBSB, as inferred independently from somatic mutations in crypts from four representative species (top to bottom): human, naked mole-rat, rat and rabbit (Methods). Signatures are shown in a human-genome-relative representation. Cosine similarities between each signature and the COSMIC human signatures SBS5 and SBS40 are provided.
Extended Data Fig. 7
Extended Data Fig. 7. Somatic indels and colibactin exposure.
a, Mutational spectra of somatic indels in each species. The x axis shows 83 types of insertion or deletion, coloured by type and length. b, Colibactin exposure in non-human and human colorectal crypts. Exposures to mutational signatures SBS1, SBS5, SBS18, SBS34 and SBS88, as inferred by expectation–maximization, for 180 non-human crypts in this study (top) and 445 human crypts sequenced in a previous study. Asterisks indicate samples with statistically significant colibactin (SBS88) exposure, based on a LRT (Methods). BW, black-and-white; H, harbour; N, naked; RT, ring-tailed.
Extended Data Fig. 8
Extended Data Fig. 8. Identified copy number changes.
ad, Somatic copy number changes in cow (a, b), mouse (c) and human (d) colorectal crypts. In each case, chromosomes are presented along the x axis, with each point representing a 100-kb genomic bin. The top panel presents the ratio between observed and expected sequencing coverage per bin; the middle panel shows the median BAF of heterozygous germline SNPs per bin; and the bottom panel presents the inferred segments of total copy number (green) and allele-specific copy number (red/blue). Regions of copy number change are highlighted in pink. The sparsity of BAF and allele-specific copy number values in the mouse crypt (c) are related to the fact that mouse samples generally had very low numbers of germline SNPs.
Extended Data Fig. 9
Extended Data Fig. 9. Somatic dN/dS.
Estimates of dN/dS for missense and truncating somatic mutations in each of the species with available genome annotation. Dots and error bars represent maximum likelihood estimates and 95% confidence intervals, respectively (n = 27, 2, 32, 2, 136, 12, 118, 9, 39, 7, 102, 10, 440, 34, 231, 22, 25, 3, 30, 2, 110, 10, 75 and 6 mutations, left to right). Note the logarithmic scale of the y axis.
Extended Data Fig. 10
Extended Data Fig. 10. Kaplan–Meier curves of longevity in captivity.
Kaplan–Meier survival curves for each species, calculated using captive lifespan data from Species360 for non-human species and census record data for humans (Methods). The shaded areas represent 95% confidence intervals of the survival curves. A horizontal grey bar indicates the age at which 80% of individuals had already died (80th percentile), which was adopted as a robust estimate of species lifespan.
Extended Data Fig. 11
Extended Data Fig. 11. Associations between life-history variables and alternative measures of somatic mutation rate.
a, b, Same analyses as Fig. 3c, f, but using somatic mutation rates per megabase (a), or per protein-coding exome (b), rather than per genome (Methods). Leftmost panels show zero-intercept LME regressions of somatic mutation rates on inverse lifespan (1/lifespan), presented on the scale of untransformed lifespan (x axis). The y axes present mean mutation rates per species, although mutation rates per crypt were used in the regressions. Darker shaded areas indicate 95% confidence intervals (CI) of the regression lines; lighter shaded areas mark a two-fold deviation from the regression lines. Point estimate and 95% CI of the regression slope (k), fraction of inter-species variance explained (FVE), and range of ELB are provided. Rightmost panels show comparisons of FVE values achieved by free-intercept LME models using inverse lifespan and other life-history variables (alone or in combination with inverse lifespan) as explanatory variables. BW, black-and-white; N, naked; RT, ring-tailed.
Extended Data Fig. 12
Extended Data Fig. 12. Bootstrapped regression of somatic mutation rates on published lifespan estimates.
a, Bootstrapped regression of somatic substitution rates on the inverse of lifespan (1/lifespan), using a zero-intercept LME model (Methods). For each of 5,000 bootstrap samples (replicates), lifespan values per species were randomly chosen from a set of published maximum longevity estimates (Supplementary Table 6). The blue line indicates the median regression slope (k) across bootstrap samples, and the shaded area depicts the range of estimates of k across bootstrap samples. Black dots and error bars indicate the mean and range, respectively, of published longevity estimates for each species. The median and range of both k and the fraction of inter-species variance explained (FVE) are provided. b, Histogram of FVE values across the 5,000 bootstrap samples.
Extended Data Fig. 13
Extended Data Fig. 13. Comparison of regression models for somatic mutation rates.
a, Zero-intercept regression of somatic substitution rates on inverse lifespan (1/lifespan), using a LME model applied to mutation rates per crypt (left) and a Bayesian hierarchical normal regression model applied to mean mutation rates per individual (Methods). For simplicity, black dots present mean mutation rates per species. Darker shaded areas indicate 95% confidence/credible intervals (CI) of the regression lines; lighter shaded areas mark a two-fold deviation from the regression lines. Point estimates and 95% CI of the regression slopes (k) and fraction of inter-species variance explained (FVE) are provided. b, Comparison of regression lines for the regression of somatic substitution rates on 1/lifespan (left; zero intercept) and log-transformed adult body mass (right; free intercept), using simple linear models (dark and light blue), phylogenetic generalized least-squares models (orange and yellow), Bayesian hierarchical normal models (green) and LME models (red) (Methods). Point estimates of the regression coefficients for each model are provided. c, Distributions of regression FVE under individual- and species-level bootstrapping. For the LME models regressing somatic mutation rates on inverse lifespan (zero intercept; left) and log-transformed mass (free intercept), the curves present distributions of FVE from 10,000 bootstrap replicates, obtained through random resampling of either individuals (blue) or species (orange) (Methods). Vertical lines indicate the FVE values obtained using the entire dataset.
Extended Data Fig. 14
Extended Data Fig. 14. mtDNA mutation burden and spectrum.
a, Total somatic mtDNA mutations called (substitutions and indels; top), somatic mutation burden per mtDNA copy (middle), and estimated mtDNA copy number in each crypt sample. Samples are arranged horizontally as in Fig. 1b, with samples from the same individual coloured in the same shade of grey. b, Mutational spectra of mtDNA substitutions in each species. The x axis shows 96 mutation types on a trinucleotide context, coloured by base substitution type; the y axis shows mutation counts. Mutations on the upper and lower halves of the spectrum represent substitutions with the pyrimidine base located on the heavy and light strands of mtDNA, respectively.
Extended Data Fig. 15
Extended Data Fig. 15. Mutational signatures and exposures as inferred de novo.
a, Mutational signatures inferred de novo from the species mutational spectra shown in Fig. 2a. Signatures are shown in a human-genome-relative representation. SBSA is the de novo equivalent of COSMIC signature SBS1 (Fig. 2b). b, Exposure of each sample to each of the mutational signatures shown in a. Samples are arranged horizontally as in Fig. 1b. c, Regression of signature-specific mutation burdens on individual age for human, mouse and naked mole-rat samples. Regression was performed using mean mutation burden per individual. Shaded areas indicate 95% confidence intervals of the regression lines. BW, black-and-white; H, harbour; N, naked; RT, ring-tailed.

Comment in

References

    1. Garcia AM, et al. Age- and temperature-dependent somatic mutation accumulation in Drosophila melanogaster. PLoS Genet. 2010;6:e1000950. doi: 10.1371/journal.pgen.1000950. - DOI - PMC - PubMed
    1. Behjati S, et al. Genome sequencing of normal cells reveals developmental lineages and mutational processes. Nature. 2014;513:422–425. doi: 10.1038/nature13448. - DOI - PMC - PubMed
    1. Milholland B, et al. Differences between germline and somatic mutation rates in humans and mice. Nat. Commun. 2017;8:15183. doi: 10.1038/ncomms15183. - DOI - PMC - PubMed
    1. Schmid-Siegert E, et al. Low number of fixed somatic mutations in a long-lived oak tree. Nat. Plants. 2017;3:926–929. doi: 10.1038/s41477-017-0066-9. - DOI - PubMed
    1. Jager M, et al. Deficiency of nucleotide excision repair is associated with mutational signature observed in cancer. Genome Res. 2019;29:1067–1077. doi: 10.1101/gr.246223.118. - DOI - PMC - PubMed

Publication types