. 2022 Apr;604(7906):534-540.
doi: 10.1038/s41586-022-04571-x. Epub 2022 Apr 13.

Mapping human haematopoietic stem cells from haemogenic endothelium to birth

Affiliations

Mapping human haematopoietic stem cells from haemogenic endothelium to birth

Vincenzo Calvanese et al. Nature. 2022 Apr.

Abstract

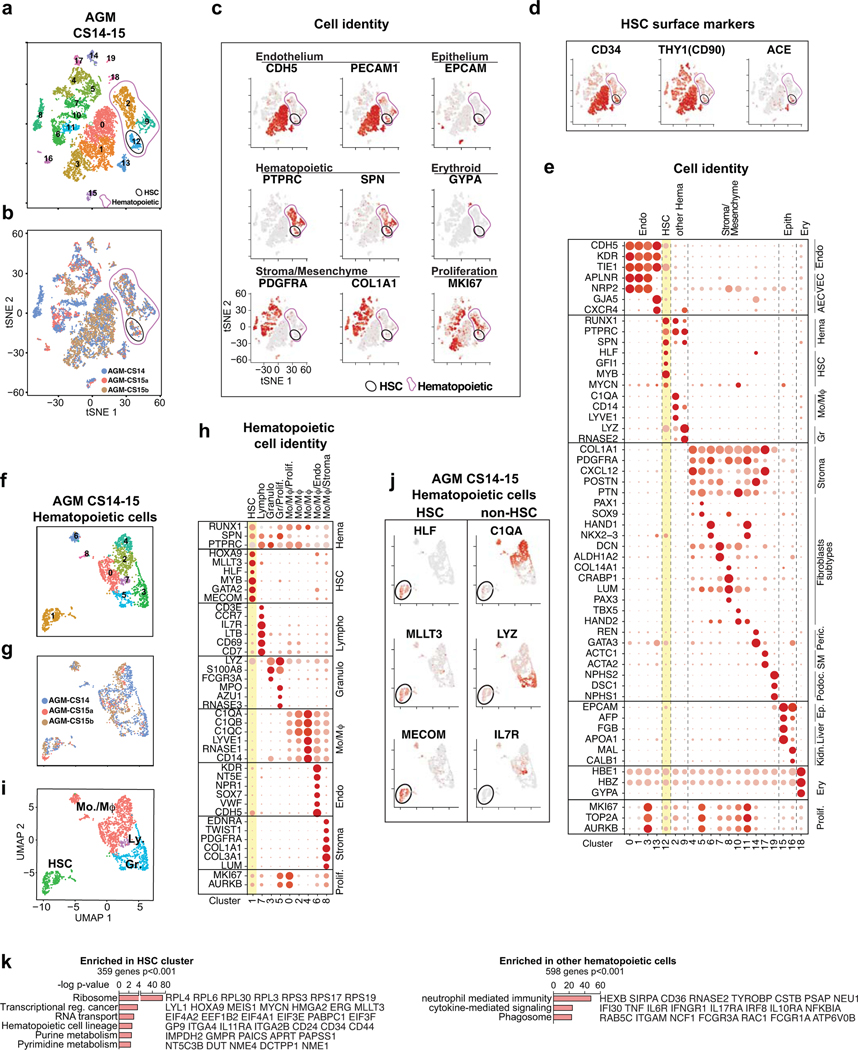
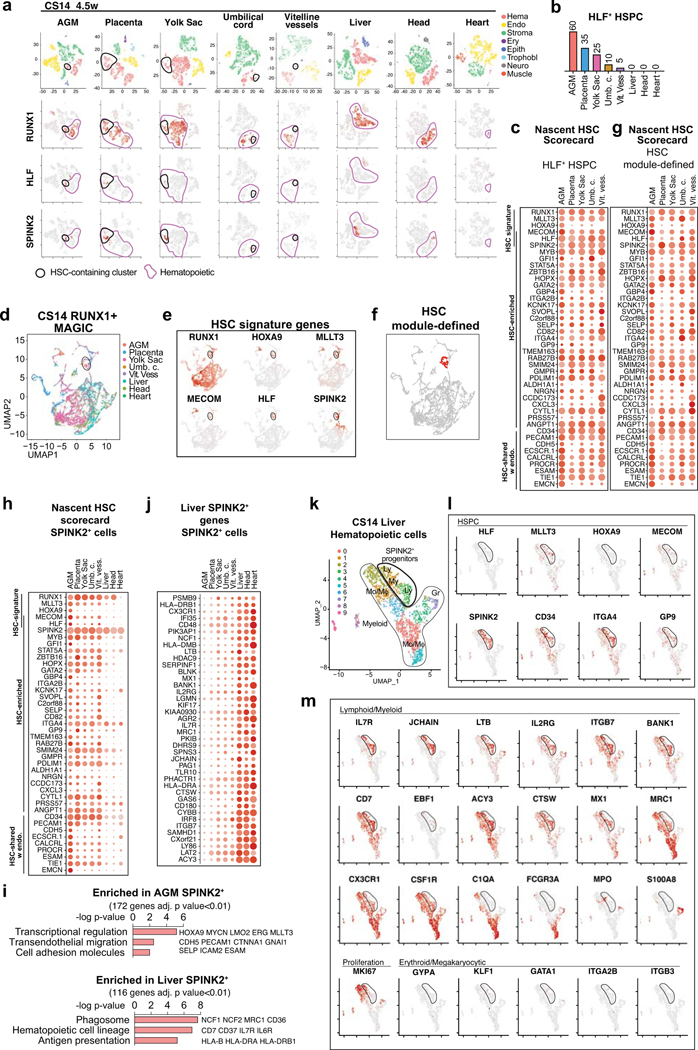
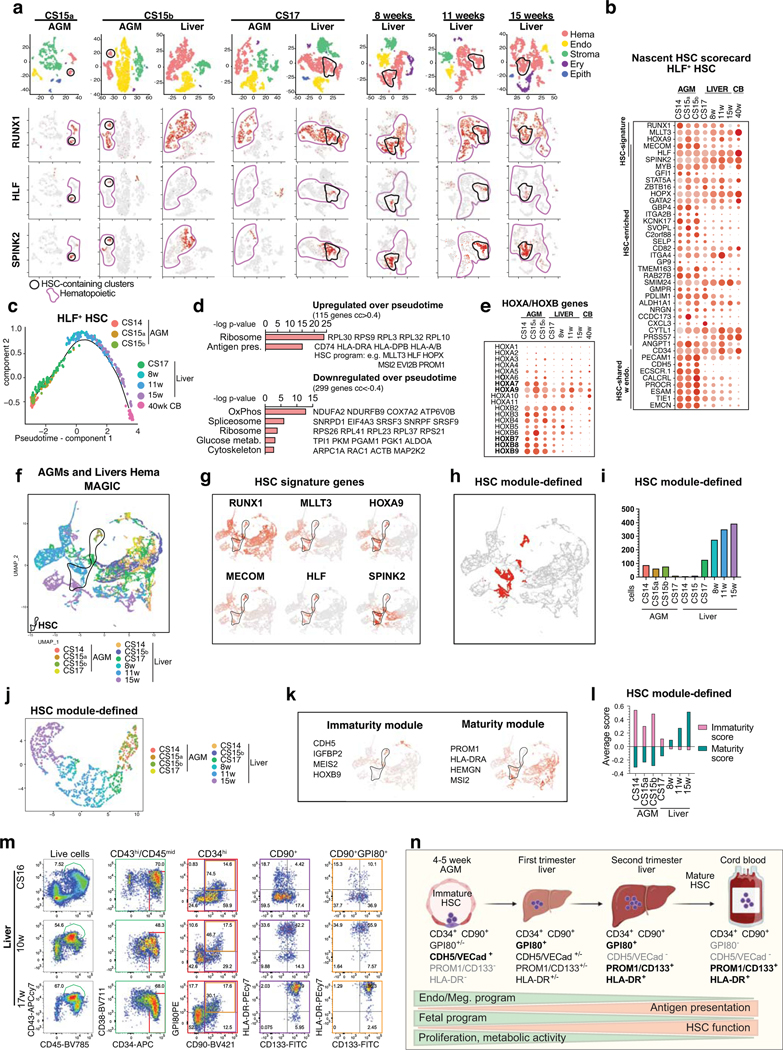
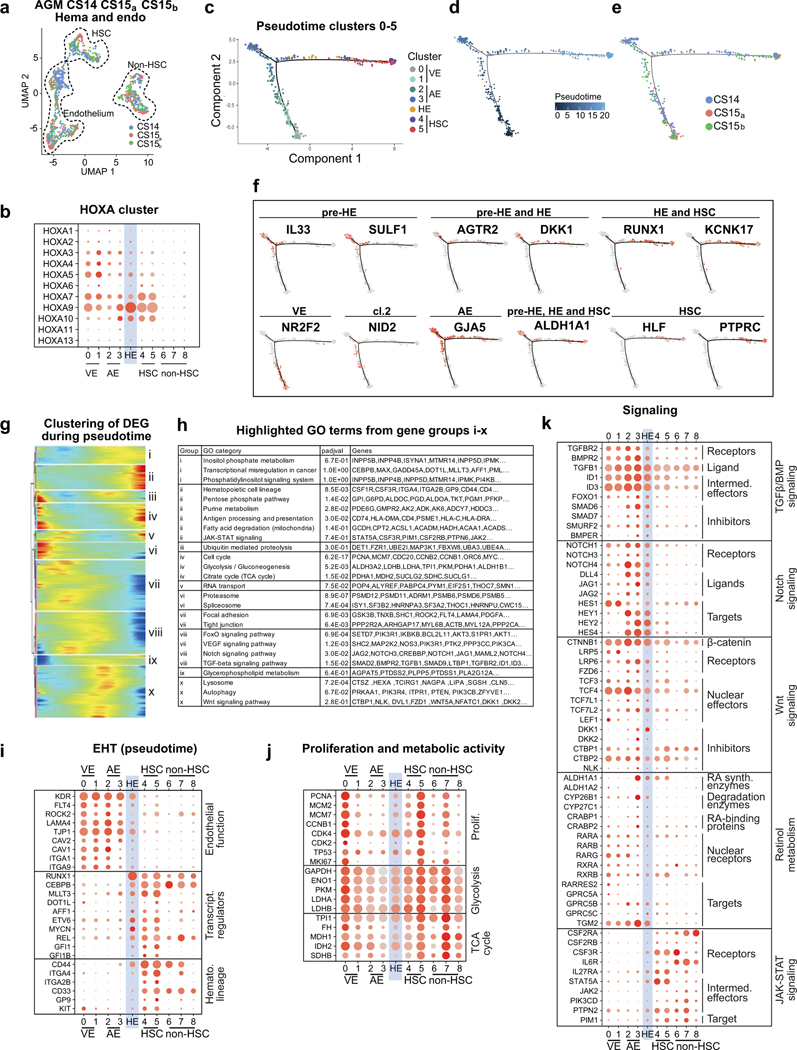
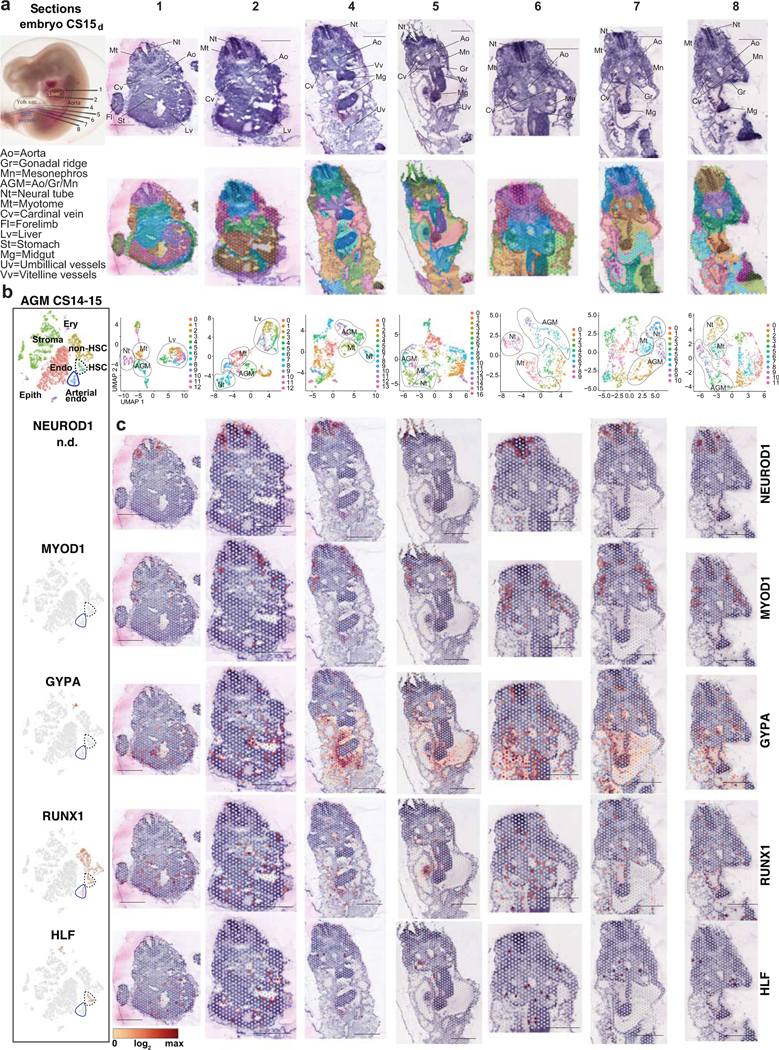
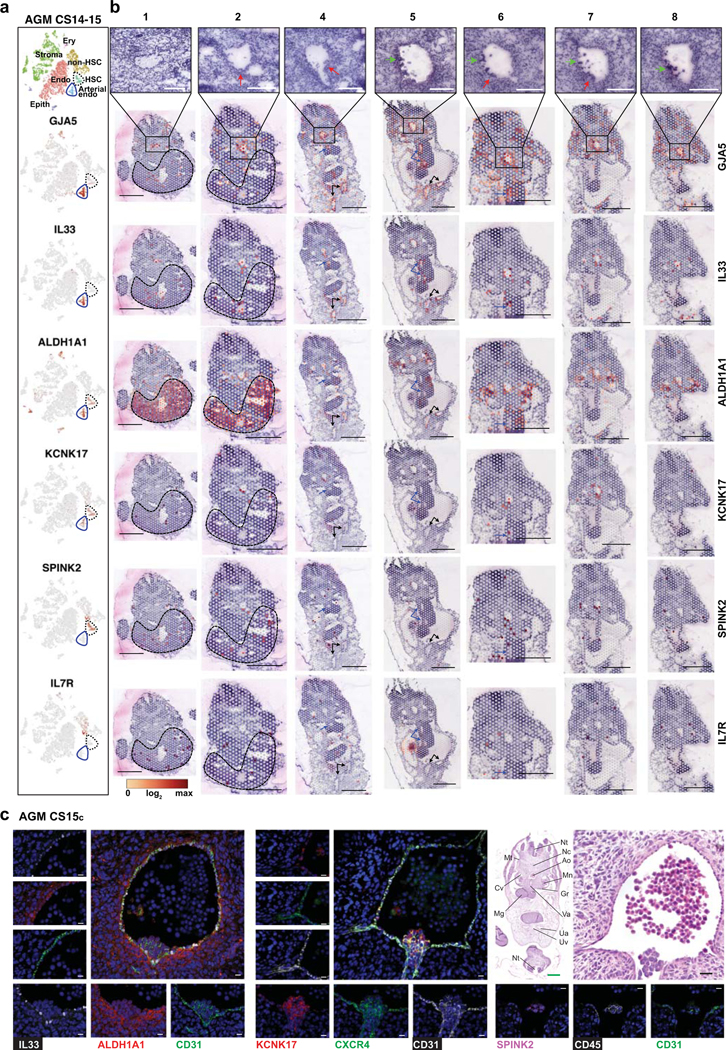
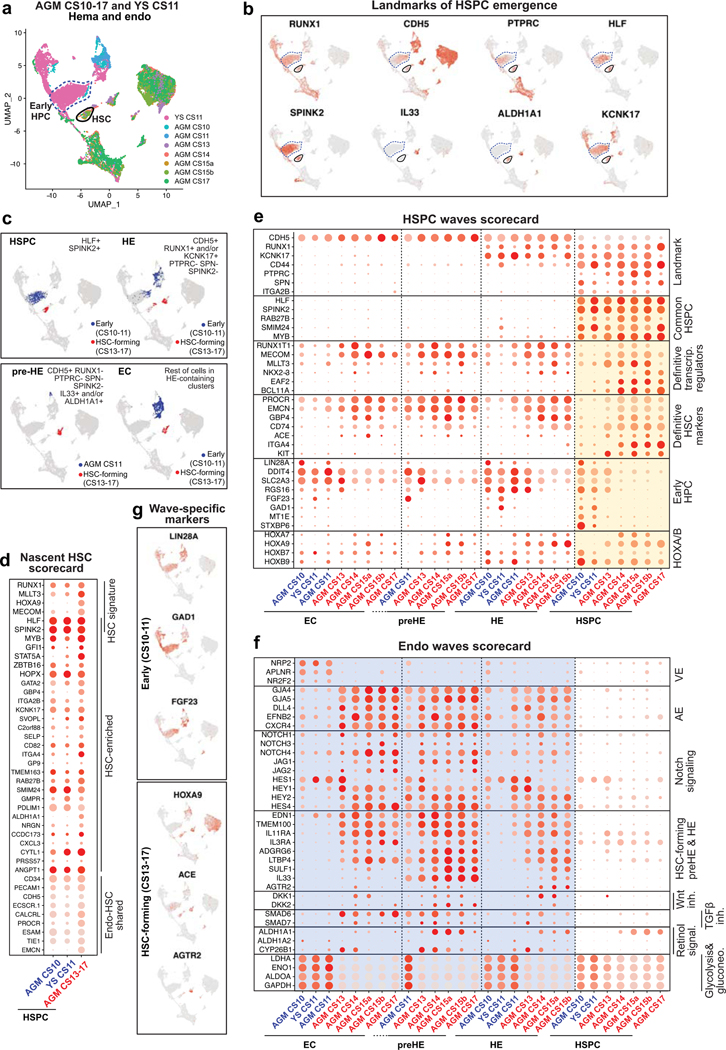
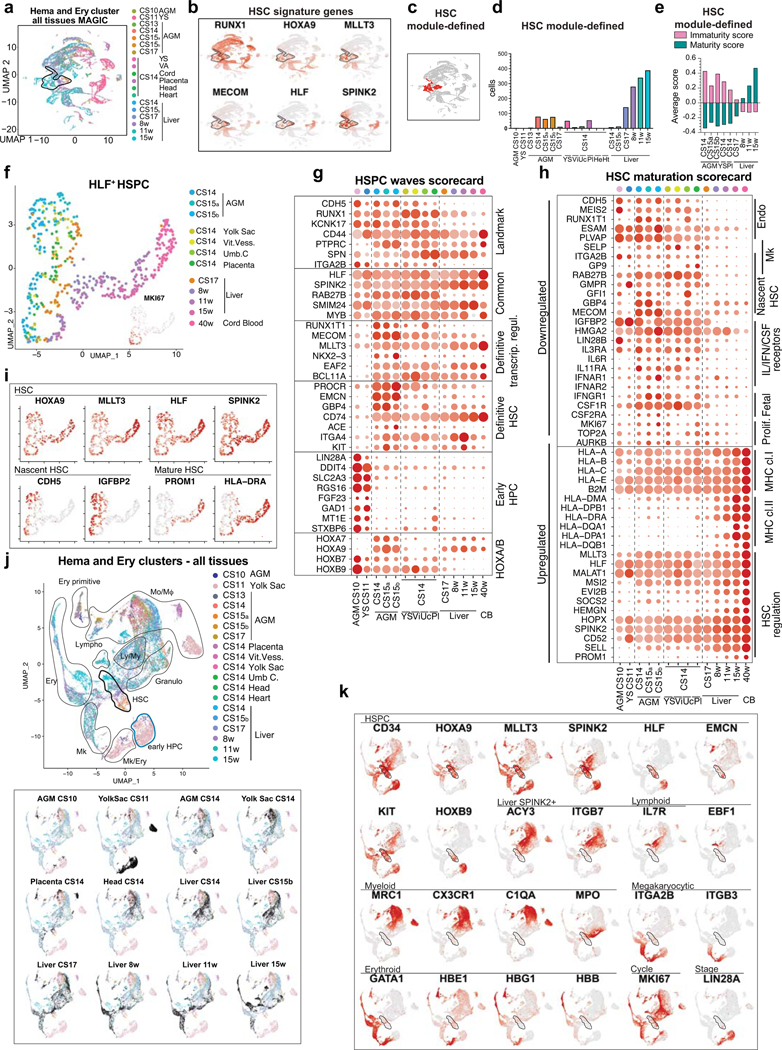
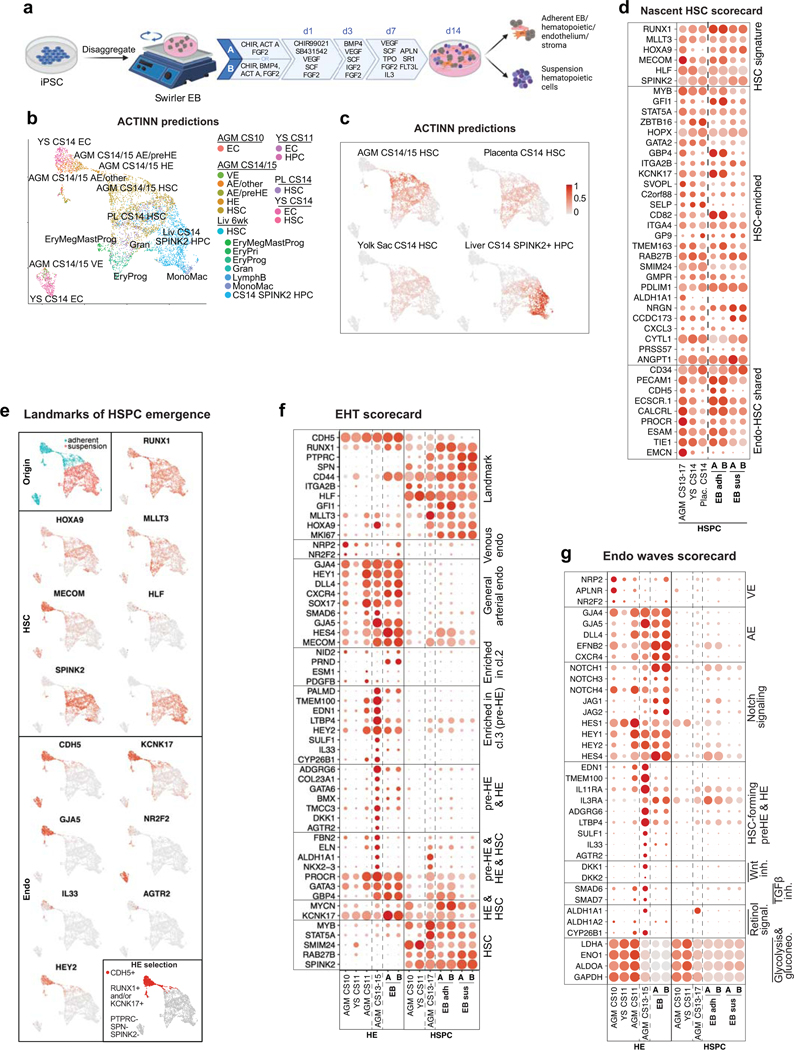
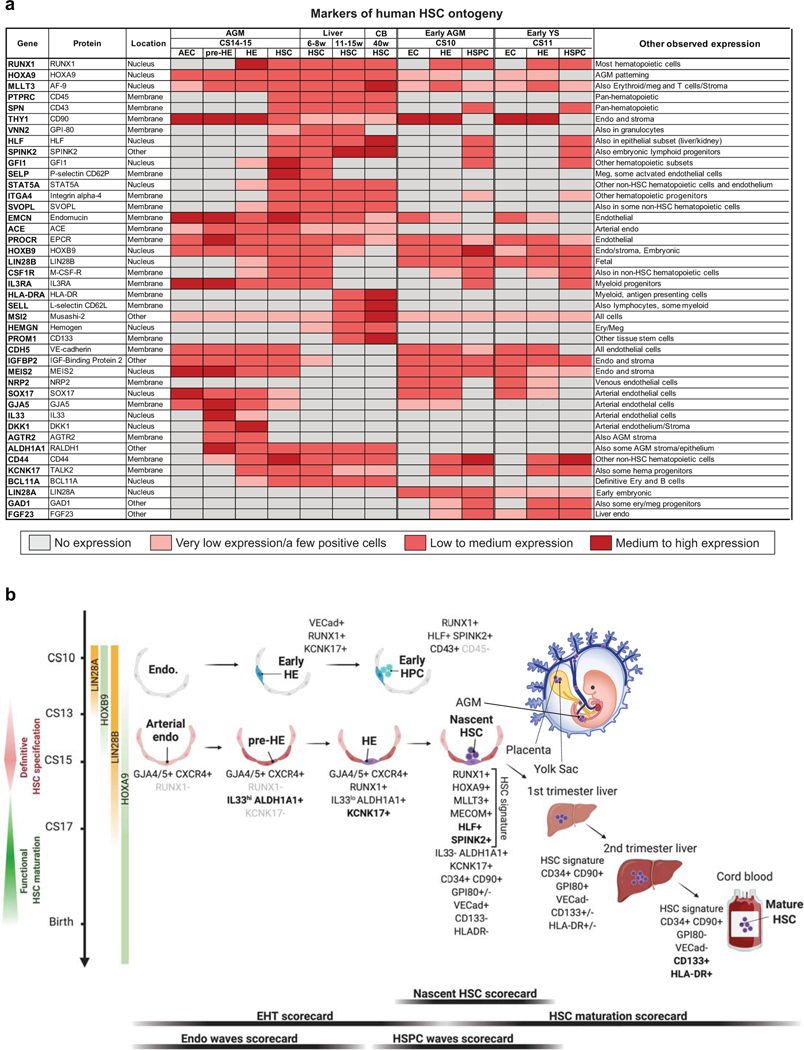
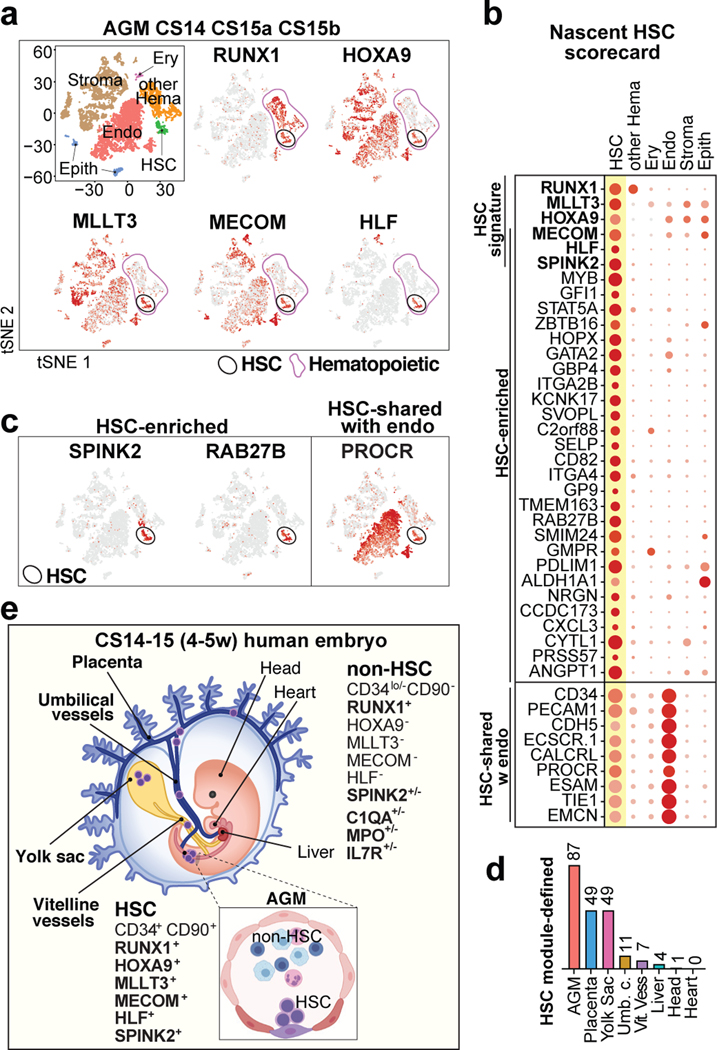
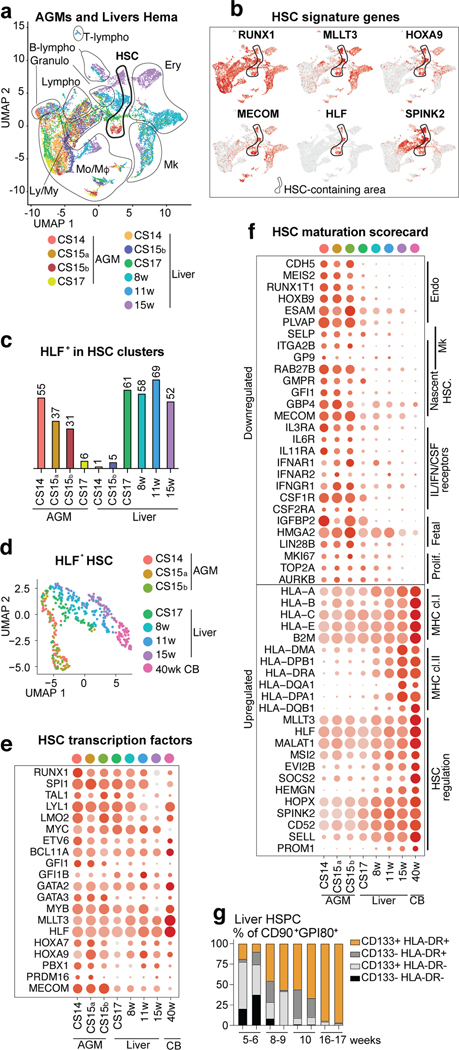
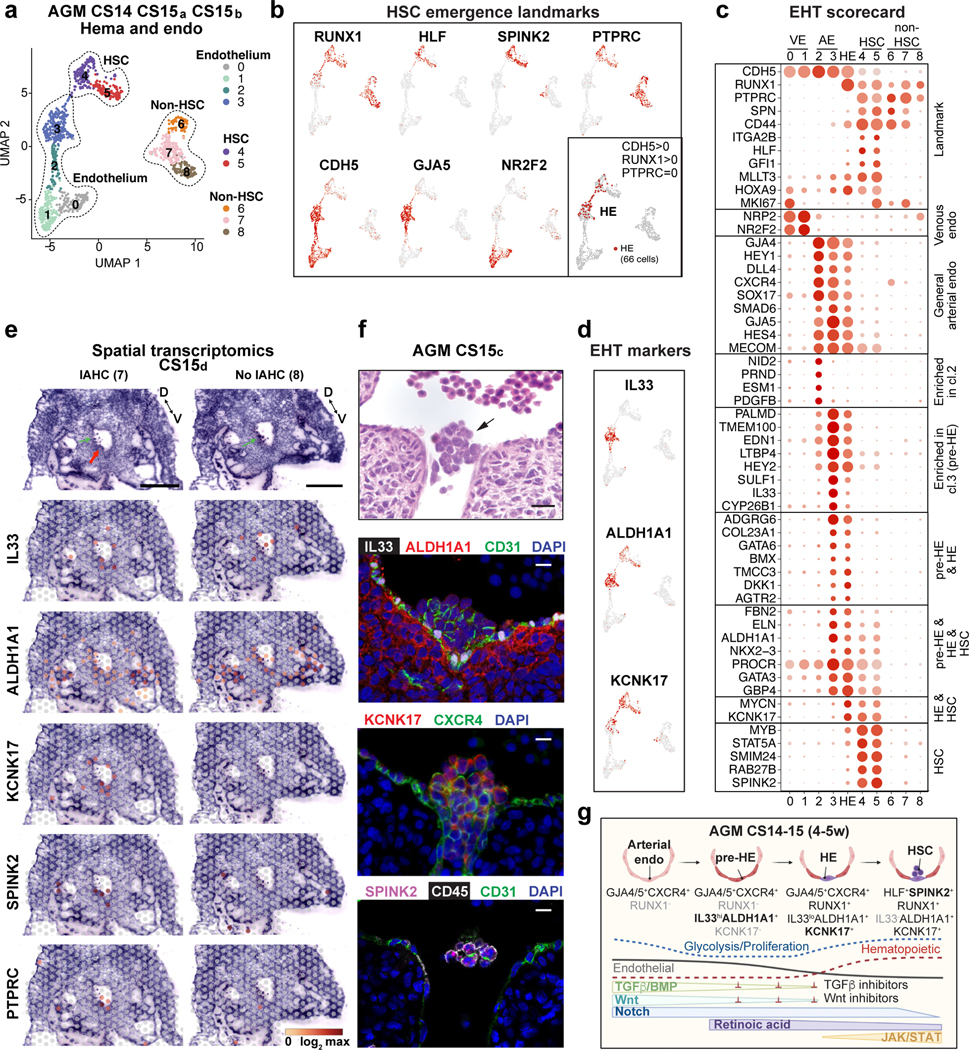
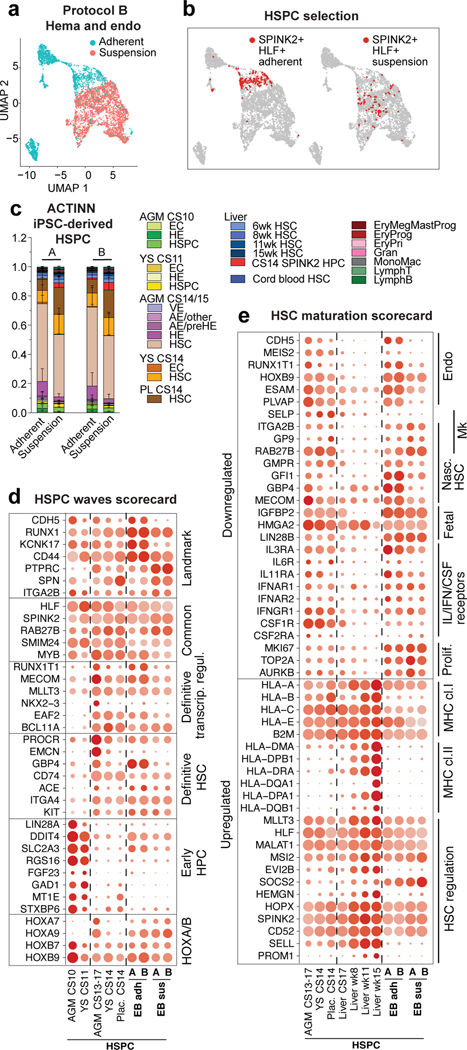
The ontogeny of human haematopoietic stem cells (HSCs) is poorly defined owing to the inability to identify HSCs as they emerge and mature at different haematopoietic sites1. Here we created a single-cell transcriptome map of human haematopoietic tissues from the first trimester to birth and found that the HSC signature RUNX1+HOXA9+MLLT3+MECOM+HLF+SPINK2+ distinguishes HSCs from progenitors throughout gestation. In addition to the aorta-gonad-mesonephros region, nascent HSCs populated the placenta and yolk sac before colonizing the liver at 6 weeks. A comparison of HSCs at different maturation stages revealed the establishment of HSC transcription factor machinery after the emergence of HSCs, whereas their surface phenotype evolved throughout development. The HSC transition to the liver marked a molecular shift evidenced by suppression of surface antigens reflecting nascent HSC identity, and acquisition of the HSC maturity markers CD133 (encoded by PROM1) and HLA-DR. HSC origin was tracked to ALDH1A1+KCNK17+ haemogenic endothelial cells, which arose from an IL33+ALDH1A1+ arterial endothelial subset termed pre-haemogenic endothelial cells. Using spatial transcriptomics and immunofluorescence, we visualized this process in ventrally located intra-aortic haematopoietic clusters. The in vivo map of human HSC ontogeny validated the generation of aorta-gonad-mesonephros-like definitive haematopoietic stem and progenitor cells from human pluripotent stem cells, and serves as a guide to improve their maturation to functional HSCs.


Conflict of interest statement

Competing interests: The authors declare no competing interests.

Figures

Extended Data Fig.1:
Extended Data Fig.1:. Identification of cell types in the AGM region
(a) Single-cell RNA-seq analysis of CD34+ and/or CD31+ enriched cells from CS14–15 AGM (n=3 biologically independent samples) (Fig.1a). tSNE plots show 20 clusters. Total hematopoietic cells (RUNX1+/CD45+, Clusters 2, 9, 12) and HSC (cluster 12) are circled in purple and black, respectively. (b) Contribution of each AGM sample to the clusters in (a). (c) Feature plots of cell type-specific genes documenting cell identities. (d) Feature plots showing co-expression of HSC surface markers in HSC cluster. (e) Dot plot with cell type-specific genes confirms cell identities in each cluster. (f) UMAP analysis showing reclustering of hematopoietic cells. (g) Contribution of each AGM to the clusters in (f). (h) Dot plot of lineage-specific genes showing the identity of hematopoietic cell types. (i) UMAP plot of hematopoietic cell types (HSC, Monocyte/macrophages-Mo/Mφ, Granulocytes-Gr, and Lymphoid cells-Ly. (j) Feature plots documenting the expression of HSC regulatory genes (left) and lack of lineage markers (right) in HSC cluster. (k) Gene ontology analysis of genes significantly enriched in HSC cluster vs other hematopoietic cells (Fisher’s exact test).
Extended Data Fig.2:
Extended Data Fig.2:. Identification of hematopoietic cells in CS14 embryo and extraembryonic tissues
(a) Single-cell RNA-seq analysis of different tissues from CS14 (4.5 weeks) conceptus. tSNE clustering indicating the main cell types, and feature plots documenting the expression of selected HSC molecular signature genes RUNX1, HLF and SPINK2+ are shown. Total hematopoietic cells (RUNX1+/CD45+) and HSCs are circled in purple and black, respectively. (b) Presence of HLF+ HSPC in HSC-containing clusters in each CS14 tissue. (c) Nascent HSC scorecard genes evaluated in HLF+ HSPC in each tissue. (d) UMAP analysis of hematopoietic cells from the merge of all indicated tissues from the 4.5 weeks/CS14 embryo, using MAGIC for imputation of gene expression. (e) Feature plots showing MAGIC-imputed expression of the six HSC signature genes RUNX1, HLF, HOXA9, MLLT3, MECOM, HLF and SPINK2. (f) Visualization of HSCs defined by the “HSC signature” module score on MAGIC-imputed expression. (g) Nascent HSC scorecard on HSC signature module -defined HSCs identified in CS14 tissues. (h) Nascent HSC scorecard on all SPINK2+ cells from hematopoietic clusters from CS14 tissues. (i) GO categories and example genes enriched SPINK2+ AGM HSC (top) or in SPINK2+ Liver hematopoietic progenitors (bottom) (Fisher’s exact test). (j) Dot plot of genes enriched in SPINK2+ Liver hematopoietic progenitors in SPINK2+ cells from CS14 tissues. (k) UMAP analysis of CS14 liver hematopoietic clusters, showing 10 clusters and the main cell types. (l) Feature plots of HSPC genes in hematopoietic cells in CS14 liver. SPINK2+ progenitor cells are circled. (m) Feature plots of lineage-specific genes in CS14 liver.
Extended Data Fig.3:
Extended Data Fig.3:. Evaluation of HSC in the AGM and liver during first and second trimester
(a) Single-cell RNA-seq analysis of individual embryonic and fetal tissues: AGM at 5 weeks (CS15a), AGM and liver at 5 weeks (CS15b), AGM and liver at 6 weeks (CS17) embryo, livers at 8, 11 and 15 weeks. For each tissue, tSNE clustering indicating the main cell types and feature plots showing the expression of selected HSC molecular signature genes RUNX1, HLF and SPINk2 are shown. Total hematopoietic cells (RUNX1+/PTPRC+) and HSCs are circled in purple and black, respectively (n=8 biologically independent samples). (b) Expression of nascent HSC scorecard genes in HLF+ HSCs from HSC-containing clusters in the different tissues. (c) HLF+ HSCs from tissues containing > 10 HSCs, and cord blood were selected, and analyzed in Monocle. (d) GO categories and example genes up- or downregulated during HSC maturation in pseudotime analysis are shown. (Parametric Correlation test) (e) Dot plots of HOXA and HOXB cluster genes during HSC maturation. (f) UMAP analysis of hematopoietic cells from the merge of all indicated tissues in (a) and CS14 AGM and liver, using MAGIC imputed gene expression. (g) Feature plots showing MAGIC-imputed expression of the six HSC signature genes. (h) Visualization of HSCs defined based on the “HSC signature” module score on MAGIC-imputed expression. (i) Quantification of HSC module-defined HSCs from each CS14 to 15wk tissue analyzed. (j) Module-defined HSCs at different ages shown in UMAP analysis. (k) Feature plots visualizing immaturity and maturity module scores defined by the indicated genes, which were calculated on MAGIC-imputed expression. (l) Quantification of immaturity and maturity modules in the MAGIC-imputed, module selected HSCs in the indicated tissues. (m) Representative flow cytometry plots of the expression of HSC maturation markers HLA-DR and CD133(PROM1) in fetal liver HSPC (CD43+CD45midCD34+CD38low/-CD90+GPI-80+) are shown. (n) Schematic depicting molecular programs and HSC surface markers that change during human HSC developmental maturation.
Extended Data Fig.4:
Extended Data Fig.4:. Documentation of cell types and programs involved in EHT
(a) UMAP plot showing contribution of each AGM sample (CS14–15, 4.5–5 weeks) (n=3 biologically independent samples) to hemato-vascular clusters. (b) Dot plot showing HOXA expression in AGM hematovascular cells. (c) Pseudotime analysis of 833 cells from clusters 0–5 (endothelium and HSC). (d,e) Pseudotime trajectory plots showing the progression of pseudotime variable (d) and contribution of each AGM sample to trajectory (e). (f) Feature plots displaying the expression of markers of the different stages of EHT in pseudotime trajectory plot. (g) Heatmap displaying unsupervised clustering of 11514 genes whose expression significantly changes over pseudotime, divided into 10 gene groups. (h) Summary table of enriched GO categories from each gene group (Fisher’s exact test). (i-k) Dot plots showing endothelial and hematopoietic lineage genes (i), cell cycle and metabolism-related genes (j) and signaling pathway associated genes (k) identified from pseudotime analysis, in clusters 0–8 and HE. HE is highlighted in blue.
Extended Data Fig.5:
Extended Data Fig.5:. Spatial transcriptomics of CS15 human embryo
(a) CS15d/5 weeks human embryo processed for Visium Spatial transcriptomics and H&E stainings of seven transverse sections that were sequenced are shown, with key anatomical landmarks highlighted (top). Seurat cluster analysis is shown on the embryo sections (middle) and as UMAP plots (bottom). Bars=1mm. (b) tSNE plots of scRNA-seq data from the AGM region (CS14–15) documenting the main cell types and the expression of cell type-specific genes. (c) Spatial expression of landmark genes for neural tube (NEUROD1), myotome (MYOD), and hematopoietic cell types (GYPA for erythroid cells, RUNX1 for HE, HSPC and other hematopoietic cells, and HLF for HSC). Note HLF expression also in liver epithelium in ED Fig.2. The default color scale from Loupe browser was applied, which represents the log2 expression from 0 to the maximum value in the spots. Each dot is 55 μm and shows combined expression of 1–10 cells.
Extended Data Fig.6:
Extended Data Fig.6:. Spatial analysis of EHT gene expression in CS15 human embryo
(a) tSNE plot documenting the main cell types in CS14–15 (4.5–5 weeks) AGM tissues (top, n=3 biologically independent samples). Feature plots displaying the expression of arterial (GJA5), pre-HE (IL33, ALDH1A1), HE (ALDH1A1, KCNK17), HSC (KCNK17 and SPINK2) and liver SPINK2 progenitor (SPINK, IL7R) markers in CS14–15 AGM samples (bottom). (b) First row, H&E staining of seven transverse sections, featuring dorsal aorta. Red arrows indicate intra-aortic hematopoietic cluster (IAHC) and green arrows red blood cells. Spatial sequencing plots showing the expression of arterial (GJA5), pre-HE (IL33, ALDH1A1), HE (ALDH1A1, KCNK17), HSC (KCNK17 and SPINK2) and liver SPINK2 progenitor (SPINK, IL7R) markers. The default color scale from Loupe browser was applied, which represents the log2 expression from 0 to the maximum value in the spots. Each dot is 55 μm and shows combined expression of 1–10 cells. White bars=250μm, black bars=1mm. (c) Immunofluorescence staining of CS15c (5 weeks) aorta for IL33, ALDH1A1, CD31/PECAM and DAPI (Section #251), CXCR4, KCNK17, CD31/PECAM and DAPI (section #254) and SPINK2, PTPRC/CD45, CD31/PECAM and DAPI (Section) #239. White bars=200μm, black bar=20μm. Individual antibody staining was performed minimum three times in independent embryos with comparable staining pattern.
Extended Data Fig.7:
Extended Data Fig.7:. Waves of hematopoietic activity in the embryo and yolk sac
(a) UMAP showing the contribution of each embryo/AGM (CS10-CS17) or YS (CS11) to CDH5+/RUNX1+ hemato-vascular cells (n=8 biologically independent samples). (b) Feature plots displaying EC, pre-HE, HE and HSC landmark genes. (c) UMAP plots highlighting HSPC (HLF+SPINK2+), HE (CDH5+RUNX1+and/orKCNK17+PTPRC-SPN-SPINK2-), pre-HE (CDH5+RUNX1-PTPRC-SPN-SPINK2-IL33+and/orALDH1A1+) and EC (remaining cells in HE-containing clusters) from early (CS10–11, blue) and HSC-forming (CS13–17, red) waves. (d) “Nascent HSC scorecard” genes in CS10 embryo HPC, CS11 YS HPC and CS13–17 AGM HSCs. (e) “HSPC waves scorecard” dot plot showing genes co-regulated in EC, pre-HE, HE and HSPC from distinct waves. Genes shown are identified through differential expression analysis and GO term enrichment between early HPC (CS10 embryo and CS11YS) vs HSCs. (f) “Endo waves scorecard” dot plot showing selected genes co-regulated in EC, pre-HE, HE and HSPC populations from the early and HSC-forming waves. Genes shown are identified through differential expression analysis and GO term enrichment between early HE (embryo CS10 and CS11, YS CS11) vs. HSC-forming HE (CS13–15). (g) UMAP feature plots displaying the expression of stage-specific markers.
Extended Data Fig.8:
Extended Data Fig.8:. Relationship of intra- and extraembryonic hematopoietic cells
(a) UMAP analysis of hematopoietic and erythroid cells in embryonic and extraembryonic tissues from CS10 to 15 weeks concepti (CS14/15 AGM, CS14 placenta, yolk sac, vitelline vessels, umbilical cord, head, heart, CS14 to 15 weeks livers) (n=19 biologically independent samples), using MAGIC imputed gene expression. (b) Feature plots displaying MAGIC imputed expression of HSC signature genes. (c) Visualization of HSCs defined based on the “HSC signature” module score on MAGIC imputed expression. (d) Quantification of module-selected HSCs in CS10 to 15 weeks concepti. (e) Mature HSC and Immature HSC module scores in module-defined HSCs. (f) UMAP analysis showing relative similarity of HLF+ HSPCs from each tissue and stage (CS14/15 AGM, CS14 placenta, yolk sac, vitelline vessels and umbilical cord, CS17 to 15 weeks livers, 40 weeks cord blood) (n=12 biologically independent samples). (g) “HSPC waves scorecard” documenting the expression of wave-specific genes in HLF+ HSPCs. (h) “HSC maturation scorecard” documenting the maturation stage. (i) Feature plots show the expression of HSC signature genes, nascent HSC genes and maturation genes in HLF+ HSPC in the indicated tissues over time. (j) UMAP analysis including hematopoietic (RUNX1+PTPRC+) and erythroid (RUNX1-GYPA+) clusters from the indicated tissues and stages (CS14–17 AGM, CS14 other hematopoietic tissues, CS17 to 15 weeks livers, n=19 biologically independent samples. Colors show the contribution of each tissue to hematopoietic cell types (top). Selected tissues highlighted in black on the UMAP plot display HSC and progenitor populations and their differentiation trajectories in each tissue (bottom). (k) Feature plots show the expression of HSPC signature genes and lineage markers at different ages. HLF+ HSC are circled in black.
Extended Data Fig.9:
Extended Data Fig.9:. Mapping PSC-derived hematovascular cells to human HSC ontogeny
(a) Schematic depicting protocols A or B for hPSC differentiation using swirler EB method and different cytokine combinations that generate adherent and suspension fractions at day 14. Created with BioRender.com. (b) UMAP plot showing strongest ACTINN matches for PSC-derived CDH5+ and/or RUNX1+ cells. (c) Feature plots depicting ACTINN probability scores for different cell identities in PSC-derived CDH5+/RUNX1+ cells. (d) Dot plot showing “Nascent HSC scorecard” genes in PSC-derived SPINK2+HLF+ HSPC. (e) Upper left, UMAP plot showing the adherent and suspension fractions of PSC-derived CDH5+/RUNX1+ hematovascular cells. Feature plots displaying the expression of HSC genes (upper) and endothelial genes (lower) in PSC-derived CDH5+/RUNX1+ cells. Lower right, UMAP highlighting the selection of HE (CDH5+RUNX1+ and/or KCNK17+PTPRC-SPN-SPINK2-) in PSC-derived CDH5+/RUNX1+ cells. (f,g) Dot plots showing “EHT scorecard” genes (f) and “Endo waves scorecard” genes (g) in PSC-derived HE and HSPC from differentiation protocols A and B, compared to their in vivo counterparts.
Extended Data Fig.10:
Extended Data Fig.10:. Markers of human HSPC ontogeny
(a) Summary table displaying patterns of gene expression for selected markers that distinguish different cell types and stages during human HSPC ontogeny. Color gradient from gray to dark red represents increase in gene expression levels and/or the frequency of positive cells within a population. (b) A schematic displaying the key cell types, stages and markers involved in human HSPC specification, emergence, and maturation. Scorecards used to evaluate key stages of HSC development are shown below. Created with BioRender.com.
Figure 1:
Figure 1:. HSC molecular signatures identifies nascent human HSCs
(a) Single-cell RNA-sequencing analysis of CD34+ and/or CD31+ enriched cells from the AGM region of human embryos (n=3 biologically independent samples: week 4.5/CS14, week 5/CS15a, week5/CS15b). Cells are plotted in tSNE and categorized by cell type. Clusters with hematopoietic cells (RUNX1+/CD45+) and HSCs (cluster 12) are circled in purple and black, respectively. Feature plots identify HSCs by co-expression of HSC transcriptional regulators. (b) Dot plot featuring the nascent HSC scorecard, which includes genes significantly enriched in HSC cluster compared to all other clusters (in a), and all other hematopoietic cells (in ED Fig.1j) (expressed in <25% of cells in other populations, adj. p-value <0.0001, Wilcoxon rank-sum test). Selected HSC genes that show endothelial cell expression are also included. (c) Feature plots of HSC-enriched genes SPINK2 and RAB27B, and PROCR, shared with HSC and endothelial cells. (d) Quantification of module-selected HSCs in intra- and extraembryonic tissues in 4.5 weeks/CS14 conceptus. (e) Model scheme depicting nascent HSCs in the AGM and extraembryonic tissues in CS14–15 (4.5–5 weeks) embryos. HSC molecular signature distinguishes nascent HSCs from progenitors and differentiated cells. Partially created with BioRender.com.
Figure 2:
Figure 2:. HSC developmental maturation associates with stage-specific molecular programs
(a) scRNA-seq analysis of four AGM tissues (CS14-CS17) and six livers (CS14 to week 15) from eight concepti (n=10 biologically independent samples). UMAP of hematopoietic clusters (RUNX1+/CD45+) combined from all tissues displaying hematopoietic cell types: HSC, Lympho-Myeloid (Ly/My), Monocyte/Macrophage (Mo/Mφ), Granulocyte (Granulo), Lymphoid, (T-Lympho, B-Lympho), Erythroid (Ery), Megakaryocytic (Mk) (b) Feature plots showing the expression of HSC molecular signature genes (HLF+ HSCs are circled). (c) Histogram showing HLF+ cells within HSC clusters in each tissue. (d) HLF+ HSC from tissues containing > 10 HSC, re-clustered and shown in UMAP analysis). (e) HSC transcription factor dot plot on HLF+ HSC from different tissues. Bars=500μm. (f) HSC maturation scorecard dot plot showing selected genes up- or down-regulated during HSC maturation. Bars=20μm. (g) Flow cytometry quantification of HSC maturation markers HLA-DR and CD133(PROM1) in fetal liver HSC (CD43+CD45midCD34+CD38low/-CD90+GPI-80+) at different stages is shown (n=2 biologically independent samples per stage).
Figure 3:
Figure 3:. HSCs emerge from distinct arterial endothelial cells
(a) UMAP analysis showing hemato-vascular populations (CDH5+ endothelium, RUNX1+HLF+ HSC and RUNX1+HLF- other hematopoietic cells) from CS14–15 AGM tissues (n=3 biologically independent samples). The contribution of cells in venous EC and non-HSC clusters was balanced. (b) UMAP feature plots displaying the expression of landmark genes for HSC emergence. HE was selected based on co-expression of RUNX1 and CDH5 and absence of PTPRC/CD45 (bottom, right; 66 cells). (c) “EHT scorecard” dot plot showing EHT landmark genes and genes co-regulated at different stages of EHT in each cluster (cl 0–8) and HE. Selected genes significantly enriched in HE compared to other populations, or up- or downregulated during transition to/from HE, were selected. (d) UMAP feature plots displaying pre-HE (IL33 and ALDH1A1) and HE (ALDH1A1 and KCNK17) markers. (e) Spatial transcriptomics of CS15d (5 weeks) embryo transverse sections. Upper panels, H&E staining of two sections between vitelline and umbilical arteries, focused on the dorsal aorta and surrounding region (red arrow: IAHC; green arrows: red blood cells, D=dorsal, V=ventral, bars=500μm). Lower panels showing the spatial expression of EHT genes, with the default color scale from Loupe browser, which represents the log2 expression from 0 to the maximum value in the spots. Each dot is 55 μm and shows combined expression of 1–10 cells. (f) H&E section (section #240) of CS15c (5 weeks) aorta at the intersection with vitelline artery (arrow: IAHC). Immunofluorescence staining of aorta for IL33, ALDH1A1, CD31 and DAPI (section #251), CXCR4, KCNK17 and DAPI (section #254) and SPINK2, PTPRC/CD45 and CD31/PECAM and DAPI (section #239). Bars=20μm. Individual antibody stainings were performed minimum three times in independent embryos with comparable staining pattern. (g) Schematic summarizing the model for EHT involving the specification of pre-HE and HE from arterial EC and HSC emergence. Stage-specific markers and signaling switches are shown. Created with BioRender.com.
Figure 4:
Figure 4:. The map of human HSC ontogeny uncovers the developmental stage of PSC-derived HSPCs
(a) UMAP plot showing adherent and suspension fractions in CDH5+/RUNX1+ hemato-vascular cells (PSC differentiation protocol B). (b) UMAPs highlighting SPINK2+HLF+ HSPC in PSC-derived CDH5+/RUNX1+ cells from adherent and suspension fractions. (c) Bar plot summarizing ACTINN probability values for PSC-derived SPINK2+HLF+ HSPC from adherent and suspension fractions (protocols A and B). Data are mean ± s.d. (A n=349 SPINK2+HLF+ adh. cells, n=68 SPINK2+HLF+ susp. cells, B n=141 SPINK2+HLF+ adh. cells, n=71 SPINK2+HLF+ susp. cells). (d,e) Dot plot showing HSPC waves scorecard genes (d) and HSC maturation scorecard genes (e) in selected PSC-derived populations from differentiation protocols A and B, compared to the in vivo counterparts.

References

    1. Tavian M, Hallais MF & Peault B.Emergence of intraembryonic hematopoietic precursors in the pre-liver human embryo. Development 126, 793–803 (1999). - PubMed
    1. Ivanovs A.et al. Highly potent human hematopoietic stem cells first emerge in the intraembryonic aorta-gonad-mesonephros region. J Exp Med 208, 2417–2427, doi:10.1084/jem.20111688 (2011). - DOI - PMC - PubMed
    1. Boisset JC et al. Progressive maturation toward hematopoietic stem cells in the mouse embryo aorta. Blood 125, 465–469, doi:10.1182/blood-2014-07-588954 (2015). - DOI - PMC - PubMed
    1. Ivanovs A.et al. Human haematopoietic stem cell development: from the embryo to the dish. Development 144, 2323–2337, doi:10.1242/dev.134866 (2017). - DOI - PubMed
    1. Hadland BK et al. Endothelium and NOTCH specify and amplify aorta-gonad-mesonephros–derived hematopoietic stem cells. The Journal of Clinical Investigation 125, 2032–2045, doi:10.1172/JCI80137 (2015). - DOI - PMC - PubMed

REFERENCES TO METHODS

    1. van Dijk D.et al. Recovering Gene Interactions from Single-Cell Data Using Data Diffusion. Cell 174, 716–729 e727, doi:10.1016/j.cell.2018.05.061 (2018). - DOI - PMC - PubMed
    1. Kuleshov MV et al. Enrichr: a comprehensive gene set enrichment analysis web server 2016 update. Nucleic Acids Res 44, W90–97, doi:10.1093/nar/gkw377 (2016). - DOI - PMC - PubMed
    1. Kao T.et al. GAPTrap: A Simple Expression System for Pluripotent Stem Cells and Their Derivatives. Stem Cell Reports 7, 518–526, doi:10.1016/j.stemcr.2016.07.015 (2016). - DOI - PMC - PubMed
    1. Nafria M, Bonifer C, Stanley EG, Ng ES & Elefanty AG Protocol for the Generation of Definitive Hematopoietic Progenitors from Human Pluripotent Stem Cells. STAR Protoc 1, 100130, doi:10.1016/j.xpro.2020.100130 (2020). - DOI - PMC - PubMed
    1. Ma F.& Pellegrini M.ACTINN: automated identification of cell types in single cell RNA sequencing. Bioinformatics 36, 533–538, doi:10.1093/bioinformatics/btz592 (2020). - DOI - PubMed

Publication types