. 2022 May 13;23(3):bbac118.
doi: 10.1093/bib/bbac118.

Comprehensive assessment of cellular senescence in the tumor microenvironment

Affiliations

Comprehensive assessment of cellular senescence in the tumor microenvironment

Xiaoman Wang et al. Brief Bioinform. .

Abstract

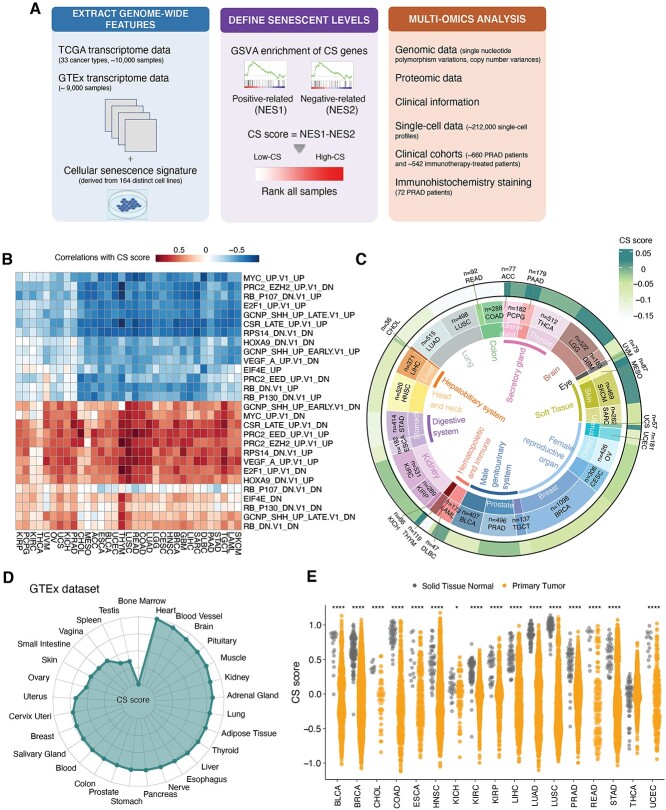
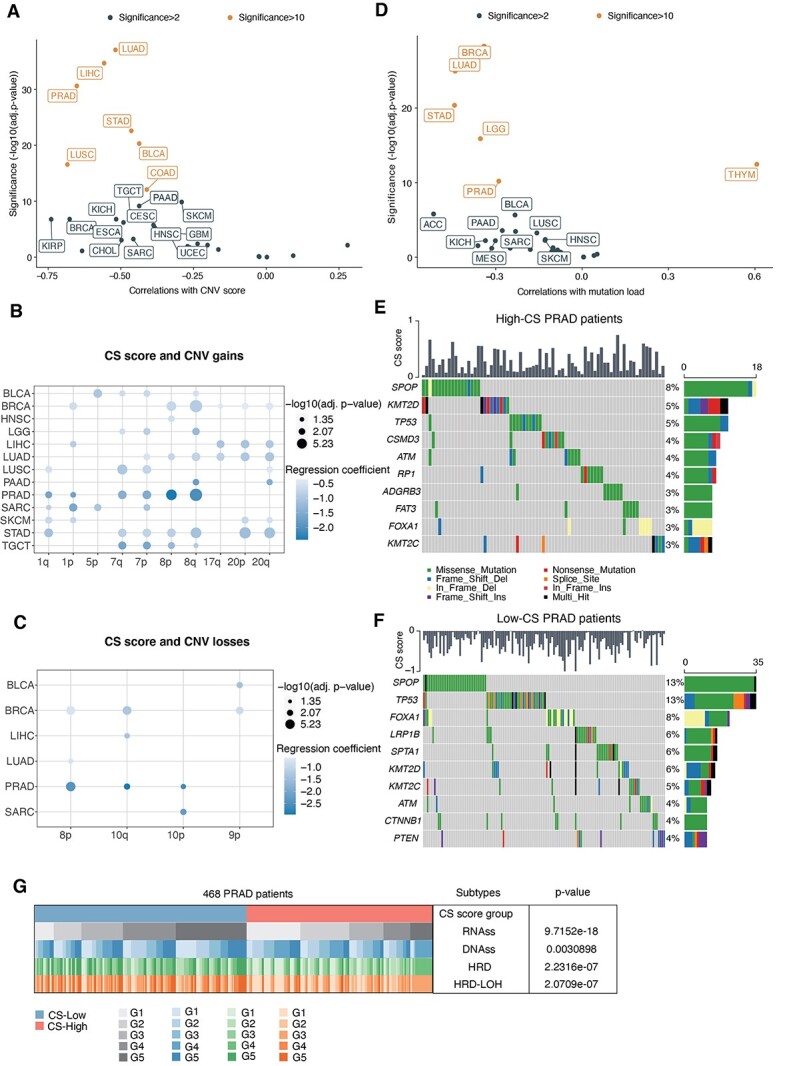
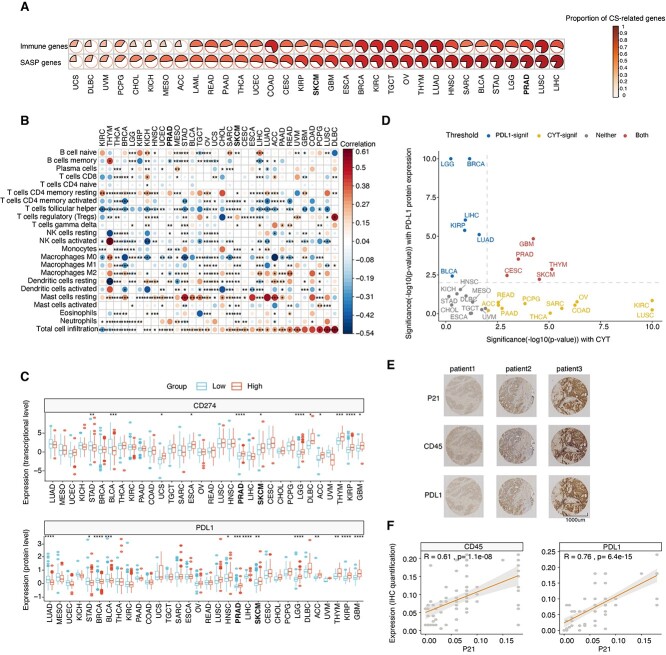
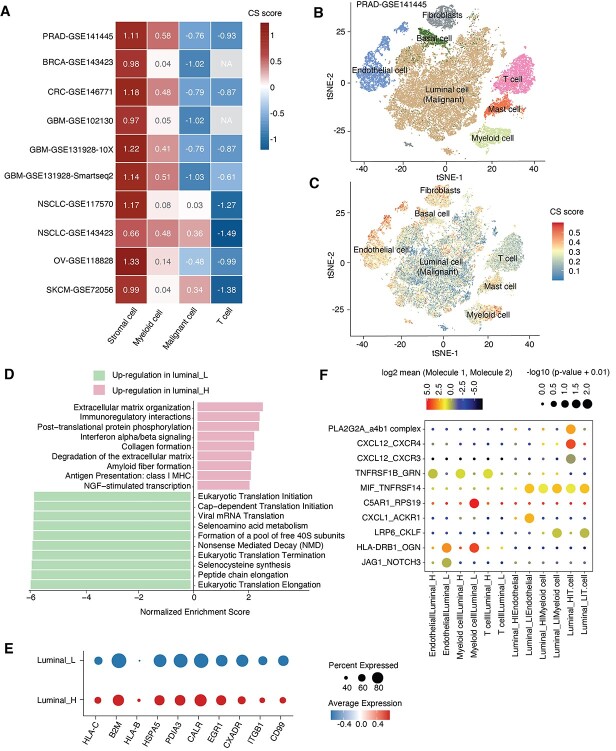
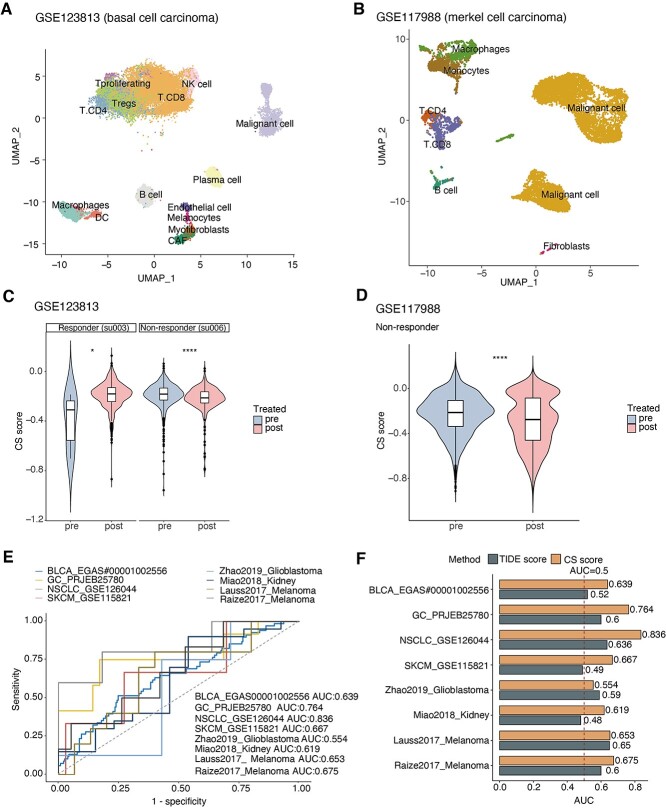
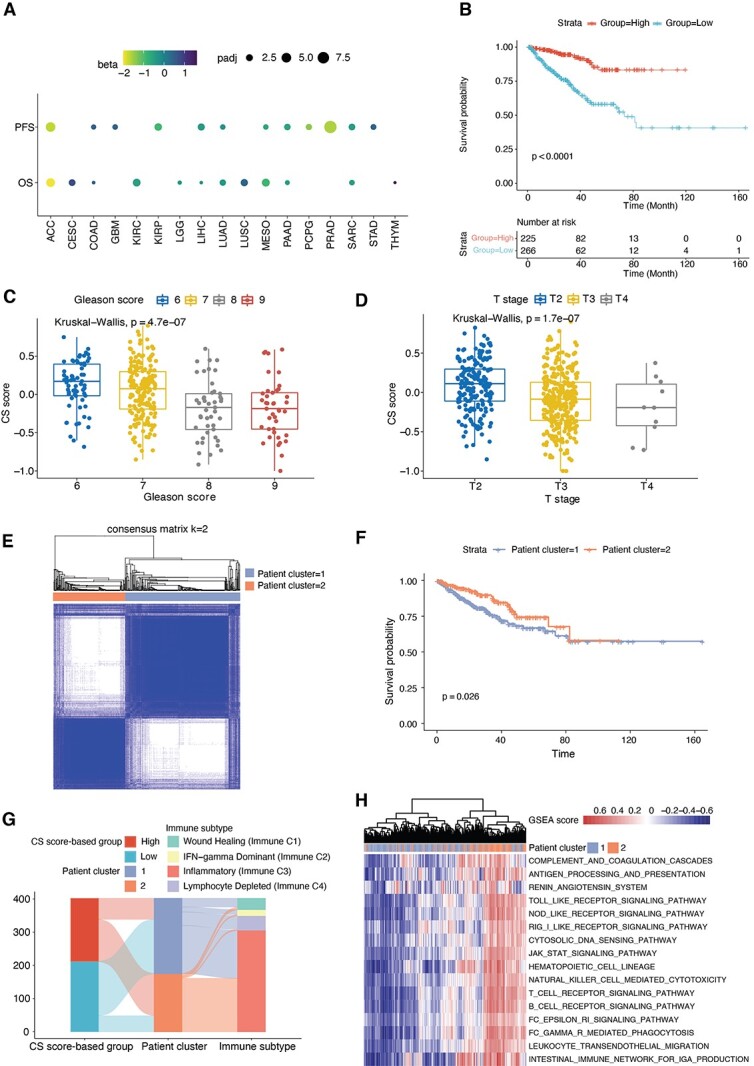
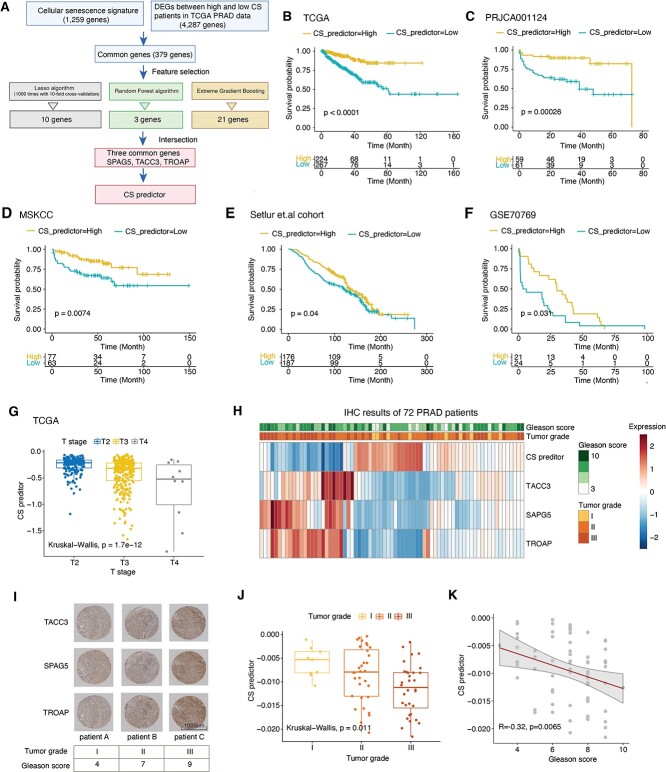
Cellular senescence (CS), a state of permanent growth arrest, is intertwined with tumorigenesis. Due to the absence of specific markers, characterizing senescence levels and senescence-related phenotypes across cancer types remain unexplored. Here, we defined computational metrics of senescence levels as CS scores to delineate CS landscape across 33 cancer types and 29 normal tissues and explored CS-associated phenotypes by integrating multiplatform data from ~20 000 patients and ~212 000 single-cell profiles. CS scores showed cancer type-specific associations with genomic and immune characteristics and significantly predicted immunotherapy responses and patient prognosis in multiple cancers. Single-cell CS quantification revealed intra-tumor heterogeneity and activated immune microenvironment in senescent prostate cancer. Using machine learning algorithms, we identified three CS genes as potential prognostic predictors in prostate cancer and verified them by immunohistochemical assays in 72 patients. Our study provides a comprehensive framework for evaluating senescence levels and clinical relevance, gaining insights into CS roles in cancer- and senescence-related biomarker discovery.

Keywords: cellular senescence; immunotherapy; machine learning; pan-cancer; single-cell.


Figures

Figure 1
Figure 1
Comprehensive quantification of senescence levels in cancers and tissues. (A) Overall methodology. Workflow for integrative analysis of the CS landscape across cancers using multi-omic data. (B) Heatmaps showing correlations between the CS score and GSVA scores of oncogenic processes across 33 TCGA cancer types. (C) Average CS scores in individual cancer types. Tissue types, cancer types and average CS scores are shown from the inner circle to the outer circle. (D) Average CS scores across normal tissues in the GTEx dataset. (E) Lower CS scores in primary tumors (orange) in comparison to adjacent normal solid tissues (gray). The Wilcoxon test P-values are stated. NES, normalized enrichment score; **** indicates P < 0.0001; * indicates P < 0.05.
Figure 2
Figure 2
Associations between senescence levels and genomic variations at the pan-cancer level. (A) Associations between CS scores and CNV scores across TCGA cancer types (dots). Spearman correlations and significance [−log10(Benjamini–Hochberg-adjusted P-values)] are shown on the x-axis and y-axis. Labeled are significant CS-related cancers (significance > 2), and colored are those with significance >10. (B and C) Dot plots showing the associations between CS scores and arm-level CNV gains (B) and CNV losses (C). Circle size indicates significance [−log10(Benjamini–Hochberg-adjusted P-values)], and the circle color denotes coefficients in multiple logistic regression. (D) Associations between CS scores and mutation loads across TCGA cancer types (dots). (E and F) Heatmap showing the top mutation events for individual TCGA PRAD patients in the high-CS (E) and low-CS groups (F), respectively. Bar plots in the top panel represent the CS scores of individual patients. Statistical graph of mutation events for each gene is shown in the left panel. Colors are variant classifications. (G) Comparative analysis of different PRAD subtypes. Cochran–Mantel–Haenszel test P-values are stated. PRAD patients were classified into five equal subtypes (G1–G5, from the 20% to 80% quantile) based on the range of RNAss, DNAss, HRD and HRD-LOH, respectively.
Figure 3
Figure 3
Cancer type-specific associations of senescence levels with tumor immunity. (A) Proportions of genes significantly correlated with the CS score in SASP genes and all immune genes. Cancer types are ordered by increasing proportions of CS score-correlated genes in SASP genes. (B) Spearman correlations (color) between CS scores and the absolute abundance of 22 immune cell types estimated by CIBERSORT for individual TCGA cancer types. Columns are ordered by increased correlations of the CS score with total cell infiltration. (C) Boxplots comparing the differences in PD-L1 expression between the low- and high-CS groups for individual TCGA cancer types at the transcriptional level (upper panel) and protein level (bottom panel). (D) Significance of the Spearman correlations of CS scores with immune CYT (x-axis) and PD-L1 protein expression (y-axis) at the pan-cancer level. Colored cancer types are these with P-value < 0.01 and absolute Spearman correlation >0.1 in either direction (blue, significant in PD-L1 protein expression; yellow, significant in CYT; red, significant in both; gray, nonsignificant in both). The gray-dashed lines represent the P-value equals 0.01. (E) Representative graph of IHC staining of p21, CD45 and PD-L1 proteins in 72 PRAD patients. (F) Scatter plots showing the correlations of p21 expression with CD45 (left panel) and PD-L1 (right panel) in the IHC assay. Spearman correlations and the corresponding P-values are labeled. **** indicates P < 0.0001, *** indicates P < 0.001, ** indicates P < 0.01 and * indicates P < 0.05.
Figure 4
Figure 4
Senescence heterogeneity and associated immune characteristics in tumor microenvironments. (A) Heatmaps showing the average CS scores of different cell types (stromal cells, myeloid cells, malignant cells and T-cells) in 10 single-cell datasets, which are labeled as the cancer type with accession numbers in the GEO database. (B and C) The t-distributed stochastic neighbor embedding visualization shows seven main cell types in single-cell prostate cancer data (GSE141445), colored by cell type (B) and the CS score (C). (D) Bar plots showing the top 10 enriched Reactome pathway terms of DEGs in malignant luminal cells between the high-CS (pink) and low-CS groups (green). (E) Dot plots showing the expression of selected DEGs in malignant cells between the high-CS and low-CS groups. The dot color corresponds to the average expression, and the dot size indicates the percent expressed. (F) Bubble chart showing significant ligand–receptor interactions between high-CS/low-CS malignant luminal cells (luminal_H/luminal_L) and neighboring cells. Ligands and receptors are shown on the x-axis; ligand-expressed cells and receptor-expressed cells are shown on the y-axis. The color denotes the average expression levels of ligands and receptors in interacting cells, and the bubble size indicates the significance of the interactions (permutation test in CellPhoneDB).
Figure 5
Figure 5
Associations of senescence levels with immunotherapy responses. (A and B) Uniform manifold approximation and projection plot showing main cell types in single-cell datasets of BCC patients (A, GSE123813) and MCC patients (B, GSE117988) receiving immunotherapy treatment, colored by cell types. (C and D) Violin plot showing posttreated changes of CS scores in malignant cells from responders and nonresponders of immunotherapy (C, BCC patients; D, MCC patients). The Wilcoxon test was used for P-value calculations. (E) receiver operating characteristic (ROC) curves of the CS score in distinguishing responders and nonresponders to immunotherapy in eight different cohorts (color). AUCs were calculated by ROC analysis and are labeled in the bottom right. (F) Bar plots showing the AUCs of the TIDE score (brown) and CS score (orange) for predicting the immunotherapy responses of patients in multiple cohorts. The TIDE score was calculated using the TIDE tool. The red-dashed line represents the AUC equals 0.5. **** indicates P < 0.0001, *** indicates P < 0.001, ** indicates P < 0.01 and * indicates P < 0.05. CAF, cancer-associated fibroblast; NK cell, natural killer cell; DC, dendritic cell.
Figure 6
Figure 6
Identifying the clinical relevance of senescence levels. (A) Cox proportional hazards model analysis of the CS score for PFS (top) and OS (bottom). The circle size denotes the Benjamini–Hochberg-adjusted −log10 P-value, and the color denotes the beta coefficient of the CS score. A beta value < 0 indicates a trend toward a high CS score with better survival. (B) Kaplan–Meier curves of PFS for the high and low groups stratified by the median CS score in TCGA PRAD. Time is measured in months, and the log-rank test P-value is reported. The numbers of patients at risk are shown over time in the bottom panel. (C and D) Box plots showing the CS score across Gleason scores (C) and T stages (D) of PRAD patients in the TCGA. Kruskal–Wallis test P-values are stated. (E) Consensus clustering identified two distinct clusters based on the CS signature in transcriptome data of PRAD patients (k = 2). (F) Kaplan–Meier curves of PFS for PRAD patient clusters (Cluster 1 and Cluster 2) identified from the consensus clustering results. Time is measured in months, and the log-rank test P-value is reported. (G) Sankey diagrams illustrating the associations between patients grouped by CS scores, patient clusters and TCGA immune subtypes. (H) Hierarchical clustering of GSEA scores for all immune-related pathways in the KEGG database, annotated by patient cluster in the color bar.
Figure 7
Figure 7
Senescence genes are potential predictors of patient prognosis in prostate cancer. (A) Overall strategies for selecting three key genes in the CS signature to predict the PFS of PRAD patients in the TCGA. (BF) Kaplan–Meier curves of PFS for patients with high and low CS predictor scores in five published PRAD cohorts, including the testing dataset (TCGA) and four validation datasets (PRJCA001124, MSKCC cohort, Setlur et al.’s cohort and GSE70769). Time is measured in months, and the log-rank test P-value is reported. The numbers of patients at risk are shown over time in the bottom panel. (G) Boxplots showing the CS predictor scores among different T stages in TCGA PRAD, colored by T stage. The Kruskal–Wallis test was used for P-value calculation. (H) Heatmap showing the quantitative results of the TACC3, SAPG5, TROAP proteins, and their corresponding CS predictor scores in IHC assays of 72 PRAD patients. (I) Representative IHC graph of TACC3, SAPG5 and TROAP expression in three PRAD patients. Tumor grades and Gleason scores are indicated in the bottom panel. (J) Boxplots comparing CS predictor scores among different tumor grades of PRAD patients. Kruskal–Wallis test P-values are stated. (K) Correlations of Gleason scores with CS predictor scores in PRAD patients. Linear regression lines are drawn (red line) with 95% CIs (gray zone); Spearman correlation and corresponding P-values are stated.

References

    1. Siegel RL, Miller KD, Jemal A. Cancer statistics, 2020. CA Cancer J Clin 2020;70:7–30. - PubMed
    1. Mathon NF, Lloyd AC. Cell senescence and cancer. Nat Rev Cancer 2001;1:203–13. - PubMed
    1. Zhang R, Chen HZ, Liu DP. The four layers of aging. Cell Syst 2015;1:180–6. - PubMed
    1. Collado M, Serrano M. Senescence in tumours: evidence from mice and humans. Nat Rev Cancer 2010;10:51–7. - PMC - PubMed
    1. Chen Z, Trotman LC, Shaffer D, et al. . Crucial role of p53-dependent cellular senescence in suppression of Pten-deficient tumorigenesis. Nature 2005;436:725–30. - PMC - PubMed

Publication types