. 2022 Aug;239(8):2457-2470.
doi: 10.1007/s00213-022-06139-z. Epub 2022 Apr 14.

Memantine treatment does not affect compulsive behavior or frontostriatal connectivity in an adolescent rat model for quinpirole-induced compulsive checking behavior

Collaborators, Affiliations

Memantine treatment does not affect compulsive behavior or frontostriatal connectivity in an adolescent rat model for quinpirole-induced compulsive checking behavior

Milou Straathof et al. Psychopharmacology (Berl). 2022 Aug.

Abstract

Rationale: Compulsivity often develops during childhood and is associated with elevated glutamate levels within the frontostriatal system. This suggests that anti-glutamatergic drugs, like memantine, may be an effective treatment.

Objective: Our goal was to characterize the acute and chronic effect of memantine treatment on compulsive behavior and frontostriatal network structure and function in an adolescent rat model of compulsivity.

Methods: Juvenile Sprague-Dawley rats received repeated quinpirole, resulting in compulsive checking behavior (n = 32; compulsive) or saline injections (n = 32; control). Eight compulsive and control rats received chronic memantine treatment, and eight compulsive and control rats received saline treatment for seven consecutive days between the 10th and 12th quinpirole/saline injection. Compulsive checking behavior was assessed, and structural and functional brain connectivity was measured with diffusion MRI and resting-state fMRI before and after treatment. The other rats received an acute single memantine (compulsive: n = 12; control: n = 12) or saline injection (compulsive: n = 4; control: n = 4) during pharmacological MRI after the 12th quinpirole/saline injection. An additional group of rats received a single memantine injection after a single quinpirole injection (n = 8).

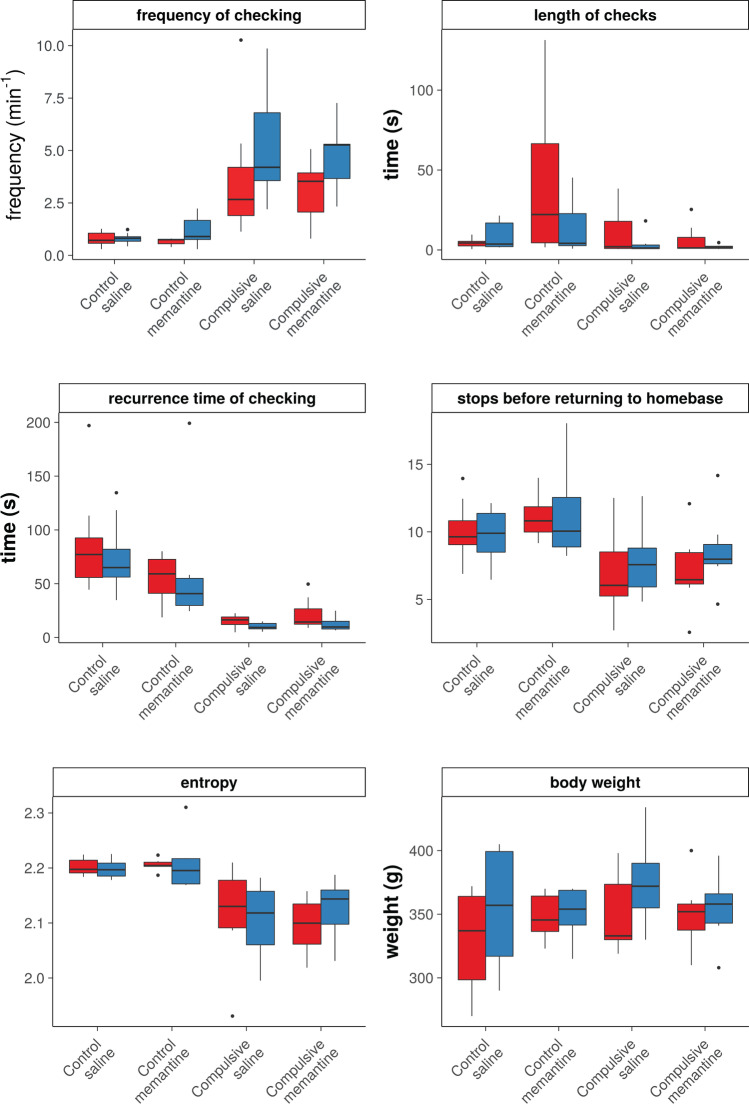
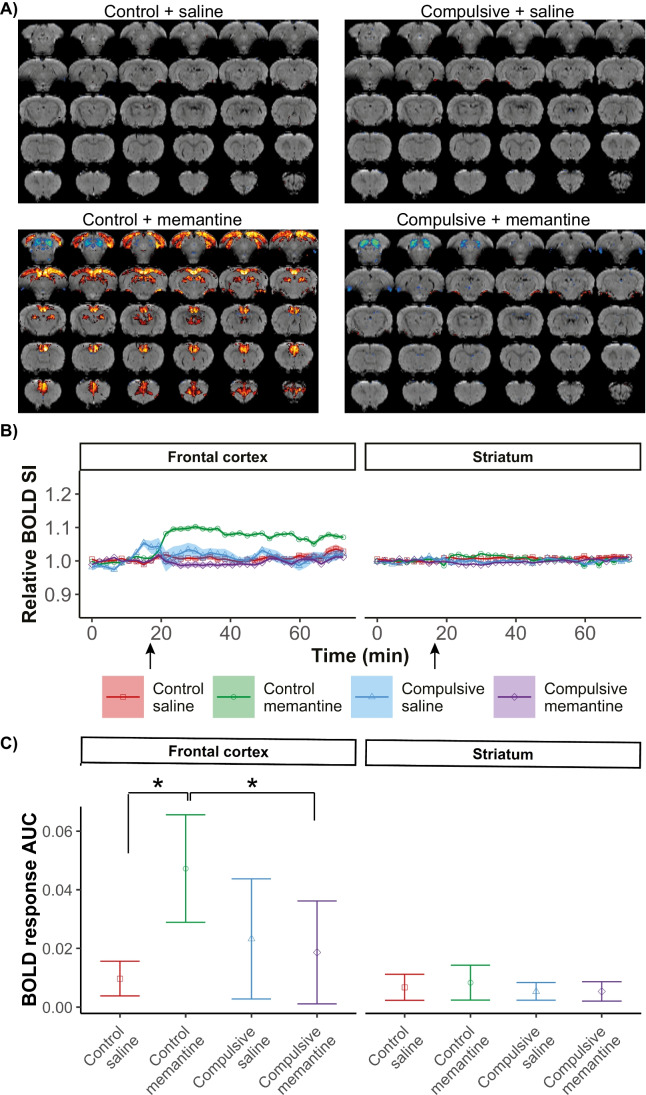
Results: Memantine treatment did not affect compulsive checking nor frontostriatal structural and functional connectivity in the quinpirole-induced adolescent rat model. While memantine activated the frontal cortex in control rats, no significant activation responses were measured after single or repeated quinpirole injections.

Conclusions: The lack of a memantine treatment effect in quinpirole-induced compulsive adolescent rats may be partly explained by the interaction between glutamatergic and dopaminergic receptors in the brain, which can be evaluated with functional MRI.

Keywords: Compulsive behavior; Diffusion magnetic resonance imaging; Frontostriatal circuitry; Functional magnetic resonance imaging; NMDA antagonist.


Conflict of interest statement

The authors declare no competing interests.

Figures

Fig. 1
Fig. 1
Measures of compulsive checking behavior and body weight, before, and after saline/memantine treatment in control and compulsive rats. Compulsive behavior measures (frequency of checking (number of visits at the home base per minute (observed during 15 min for compulsive rats, and during 30 min for controls)), length of checks (average time (s) spent at the home base), recurrence time of checking (average time (s) before returning to the home base), stops before returning to the home base (average number of zones visited in between two visits of the home base)), entropy (predictability of the visited zones), and body weight (g), before (red), and after (blue) 7 days of daily saline/memantine treatment (control + saline: n = 8; control + memantine: n = 6; compulsive + saline: n = 7; compulsive + memantine: n = 7). Error bars represent 1.5 times the interquartile range, and dots represent values that exceeded 1.5 times the interquartile range
Fig. 2
Fig. 2
Functional and structural connectivity in the frontostriatal system before and after saline/memantine treatment in control and compulsive rats. Bar graphs of functional connectivity (Fisher’s Z-transformed correlation coefficient) (A) and structural connectivity (median fractional anisotropy (FA)) (B) of intra- and interhemispheric connections within the frontostriatal system before (red) and after (blue) 7 days of daily saline/memantine treatment (control + saline: n = 8; control + memantine: n = 6; compulsive + saline: n = 7; compulsive + memantine: n = 7). Structural connectivity between the left and right frontal cortex could not be determined because of unreliable tractography results. Error bars represent 1.5 times the interquartile range and dots represent values that exceed 1.5 times the interquartile range
Fig. 3
Fig. 3
Brain activation directly after memantine/saline injection in control and compulsive rats. Brain activation maps, overlaid on anatomical images, show positive BOLD activation responses in yellow/red (z > 3.1) and negative responses in blue (z <  − 3.1) (A). The normalized BOLD signal intensity (SI) time course is shown as averaged time series for the regions-of-interest, with the arrow indicating the time of memantine/saline injection (B). BOLD responses to memantine or saline injection quantified as area under the curve (AUC) (relative positive BOLD SI change per second) (C). Control + saline: n = 4; control + memantine: n = 12; compulsive + saline: n = 4; compulsive + memantine: n = 12. *Corrected p < 0.05. Shades in B represent the standard error. Error bars in C represent the standard deviation
Fig. 4
Fig. 4
Brain activation directly after memantine injection following a single-quinpirole injection. Brain activation maps, overlaid on anatomical images, show positive BOLD activation responses in yellow/red (z > 3.1) and negative responses in blue (z <  − 3.1) (A). The normalized BOLD signal intensity (SI) time-course is shown as averaged time series for the regions-of-interest, with the arrow indicating the time of memantine injection (B). BOLD responses to memantine injection quantified as area under the curve (AUC) (relative positive BOLD SI change per second) (C). Acute quinpirole + memantine: n = 8. Shades in B represent the standard error. Error bars in C represent the standard deviation

References

    1. Accordino RE, Kidd C, Politte LC, Henry CA, Mcdougle CJ. Psychopharmacological interventions in autism spectrum disorder. Expert Opin Pharmacother. 2016;17(7):937–952. doi: 10.1517/14656566.2016.1154536. - DOI - PubMed
    1. Andersson JLR, Jenkinson M, Smith S (2007) Non-linear registration aka Spatial normalisation. FMRIB Tech Rep TR07JA2:1–22
    1. Beckmann CF, Smith SM. Probabilistic independent component analysis for functional magnetic resonance imaging. IEEE Trans Med Imaging. 2004;23:137–152. doi: 10.1109/TMI.2003.822821. - DOI - PubMed
    1. Benjamini Y, Yekutieli D. The control of the false discovery rate in multiple testing under dependence. Ann Stat. 2001;29:1165–1188. doi: 10.1214/aos/1013699998. - DOI
    1. Boileau B. A review of obsessive-compulsive disorder in children and adolescents. Dialogues Clin Neurosci. 2011;13:401–411. doi: 10.31887/DCNS.2011.13.4/bboileau. - DOI - PMC - PubMed

MeSH terms