. 2022 May 6;50(8):4436-4449.
doi: 10.1093/nar/gkac244.

Psoralen mapping reveals a bacterial genome supercoiling landscape dominated by transcription

Affiliations

Psoralen mapping reveals a bacterial genome supercoiling landscape dominated by transcription

Bryan J Visser et al. Nucleic Acids Res. .

Abstract

DNA supercoiling is a key regulator of all DNA metabolic processes including replication, transcription, and recombination, yet a reliable genomic assay for supercoiling is lacking. Here, we present a robust and flexible method (Psora-seq) to measure whole-genome supercoiling at high resolution. Using this tool in Escherichia coli, we observe a supercoiling landscape that is well correlated to transcription. Supercoiling twin-domains generated by RNA polymerase complexes span 25 kb in each direction - an order of magnitude farther than previous measurements in any organism. Thus, ribosomal and many other highly expressed genes strongly affect the topology of about 40 neighboring genes each, creating highly integrated gene circuits. Genomic patterns of supercoiling revealed by Psora-seq could be aptly predicted from modeling based on gene expression levels alone, indicating that transcription is the major determinant of chromosome supercoiling. Large-scale supercoiling patterns were highly symmetrical between left and right chromosome arms (replichores), indicating that DNA replication also strongly influences supercoiling. Skew in the axis of symmetry from the natural ori-ter axis supports previous indications that the rightward replication fork is delayed several minutes after initiation. Implications of supercoiling on DNA replication and chromosome domain structure are discussed.


Figures

Figure 1.
Figure 1.
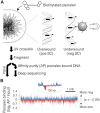
Psora-seq supercoiling assay. (A) Schematic of Psoralen crosslinking and DNA purification steps. Live cells are treated with biotinylated psoralen, which binds most strongly to highly negative supercoiled regions and most weakly to highly positive supercoiled regions. Psoralen–DNA adducts are crosslinked with UV light, genomic DNA is prepared and fragmented, then psoralen-bound fragments are affinity-purified using streptavidin magnetic beads. Pull-down and input samples are identified and quantified by whole genome sequencing. (B) Psora-seq profile of the E. coli genome. Binding is calculated as the number of sequencing reads per kb in the pull-down sample relative to the input sample, then log2 transformed. Final values indicate fold-difference in psoralen binding, with values above and below the genome average colored blue and red, respectively. Profile is from a single Psora-seq experiment with wild-type cells at mid-exponential phase in LB medium at 37°C.
Figure 2.
Figure 2.
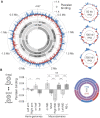
Large-scale supercoiling features of the E. coli chromosome. (A) Circular Psora-seq maps at 1-kb resolution (large plot on left) or at various moving averages (right plots). Psoralen binding values (log2 pull-down/input) are the average of six independent Psora-seq experiments with mid-exponential wild-type cells. Blue and red tracks indicate supercoiling that is more negative or more positive than the genome average, respectively. Higher-resolution extended plot shown in Supplementary Figure S3. Shaded grey arcs indicate the positions of macrodomains and hemi-genome regions. (B) Quantification of psoralen binding within hemi-genome and macrodomain regions (left) and corresponding heatmap (right). Error bars indicate ± s.e.m.; ****P< 0.0001; ***P < 0.001; **P < 0.01; *P < 0.05; NS = not significant (p> 0.05); two-tailed t test with df = 5 (n = 6 independent experiments).
Figure 3.
Figure 3.
Symmetrical supercoiling about a skewed ori-ter axis. (A) Psoralen binding profile (250 kb moving average) from mid-exponential wild-type cells (n = 6; data from Figure 2) is shown with positions of ribosomal operons and Tus-binding termination (ter) sites. Blue and red tracks indicate supercoiling that is more negative or more positive than the genome average, respectively. (B) Psoralen binding (100 kb moving average) along left (cyan line) and right (orange line) chromosome arms displaced leftward by 14°. Average of left and right arms is shown (black dashed line). Determination of optimal skew shown in Supplementary Figure S5. (C) Binding of nucleoid proteins and topoisomerases within the most negative and most positive supercoiled regions. Genomic protein binding data for H-NS (27), HU (45), FIS (27), RNAP (27), Topo I (GEO GSM1696179), gyrase (46), and Topo IV (46) was standardized (z-score) and average binding was determined within psoralen enriched (blue) and psoralen depleted (red) regions (Materials and Methods). Error bars indicate ± s.e.m.; ****P < 0.0001; ***P < 0.001; **P < 0.01; *P < 0.05; NS = not significant (p> 0.05); two-tailed t test with df = 17 (n = 18 psoralen enriched regions, n = 24 psoralen depleted regions). Genome-wide protein correlation analyses are shown in Supplementary Figure S6. (D) Gyrase and Topo IV binding along skewed ori-ter replication axis. Protein binding z-scores as in (C) were averaged within 100 kb bins along left and right chromosome arms skewed leftward as in (B).
Figure 4.
Figure 4.
Twin-domain supercoiling at ribosomal operons. (A) Psoralen binding along an 80-kb region surrounding each of the seven ribosomal operons in mid-exponential wild-type cells (n = 6; data as in Figure 2). Psoralen profiles were co-oriented such that transcription is in the left to right direction. Sequencing reads within ribosomal gene open reading frames (dashed lines) is highly repetitive and thus cannot be mapped. (B) The consensus ribosomal operon twin-domain. Average psoralen binding near all 7 ribosomal operons in 6 independent experiments was plotted as in (A) and twin-domain size was determined by regression analysis. Linear regression lines (thick black lines) on each side of the operon were drawn using the set of contiguous data points (dark circles) that resulted in the maximum Pearson correlation coefficient. Length (magnitude) and height (amplitude) of each domain is given by the corresponding regression x- and y-intercepts. Statistical ranges were determined from the intercepts of 95% confidence intervals (dashed lines). (C) Inversion of the rrnA operon results in an oppositely oriented twin-domain. Average psoralen binding is shown for wild-type (black, n = 6) and invA mutant cells (red, n = 3) carrying an 18.4 kb inversion (red arrowheads) around the rrnA locus (39). Transcription profile and psoralen regression analysis is shown in Supplementary Figure S8. (D) Psoralen binding at ribosomal operons after rifampicin treatment. Mid-exponential wild-type cells were treated with rifampicin for one hour before crosslinking (n = 4). Profiles plotted as in (A). (E) Changes in ribosomal supercoiling after drug treatment. Average psoralen binding at seven aligned ribosomal operons is shown for: untreated cells (WT; n = 6; data as in Figure 2), cells put through a mock pull-down without psoralen (n = 2), cells treated with bleomycin for 10 minutes (n = 2), cells treated with rifampicin for one hour (n = 4), or cells treated with norfloxacin for 20 min (n = 2). Raw psoralen profiles shown in Supplementary Figure S9. (F) Change in supercoiling domain amplitude after drug treatment. Positive and negative supercoiling domain amplitudes were determined for above samples (E) by regression analysis as in (B). Error bars indicate ± s.d.; ****P < 0.0001; ***P < 0.001; **P < 0.01; *P < 0.05; NS = not significant (p> 0.05); two-tailed t test with df = 1–3.
Figure 5.
Figure 5.
Transcription-dependent supercoiling for all genes. Twin-domain amplitudes for all 2,598 E. coli transcription units (837 multi-gene operons and 1761 single genes) were calculated as the difference in psoralen binding 5 kb downstream and upstream of each transcription unit (n = 6; data from Figure 2). Gene expression was calculated as the cumulative RNAP binding (43) within each transcription unit, converted to standard (z) score. Ribosomal operons are indicated with a circle. Inset graph shows average twin-domain amplitude among the top 1% or 10% expressing genes, or all genes (right). Error bars indicate ± s.e.m. (n = 6 independent experiments).
Figure 6.
Figure 6.
Modeling genomic supercoiling from transcription. (A) Modeling method and resulting modeled supercoiling profiles. Drawing illustrates how supercoiling is modeled at two converging genes. E. coli transcriptome (grey tracks) from RNAP binding (top; 43) or relative mRNA abundance (bottom; 59) is shown with modeled supercoiling (red and green lines) at 1-kb resolution. Dashed vertical lines mark the locations of ribosomal operons. (B) Genome supercoiling measured by Psora-seq (light blue and light red tracks) with RNAP and mRNA transcription models (red and green lines, respectively). Data are smoothed to a 50 kb moving average. (C) Sliding correlation plot showing model fitness along the chromosome. Pearson correlation coefficients were determined within a 300-kb window every 1 kb between Psora-seq data from mid-exponential wild-type cells (n = 6; Figure 2) and RNAP-modeled supercoiling (red) or mRNA-modeled supercoiling (green), between scrambled Psora-seq data and RNAP-modeled supercoiling (grey), or between Psora-seq data from rifampicin-treated cells and RNAP-modeled supercoiling (dark red). Detailed modeling analysis of rifampicin-treated cells is shown in Supplementary Figure S11. (D) Zoomed plot of a region with high transcription. RNAP (rrn depleted) and mRNA transcriptomes (top) and supercoiling profiles from Psora-seq or transcription models (bottom) are shown as above (A, B). (E) Model fitness within different chromosome regions. Error bars indicate ± s.e.m. (n = 6 Psora-seq experiments).

References

    1. Dorman C.J., Dorman M.J.. DNA supercoiling is a fundamental regulatory principle in the control of bacterial gene expression. Biophys. Rev. 2016; 8:209–220. - PMC - PubMed
    1. Magnan D., Bates D.. Regulation of DNA replication initiation by chromosome structure. J. Bacteriol. 2015; 197:3370–3377. - PMC - PubMed
    1. Postow L., Crisona N.J., Peter B.J., Hardy C.D., Cozzarelli N.R.. Topological challenges to DNA replication: conformations at the fork. Proc. Natl. Acad. Sci. U.S.A. 2001; 98:8219–8226. - PMC - PubMed
    1. Masse E., Drolet M.. Escherichia coli DNA topoisomerase i inhibits R-loop formation by relaxing transcription-induced negative supercoiling. J. Biol. Chem. 1999; 274:16659–16664. - PubMed
    1. Mikheikin A.L., Lushnikov A.Y., Lyubchenko Y.L.. Effect of DNA supercoiling on the geometry of holliday junctions. Biochemistry. 2006; 45:12998–13006. - PMC - PubMed

Publication types