. 2022 May 2;12(5):1378-1395.
doi: 10.1158/2159-8290.CD-21-1168.

EGFR Inhibition Potentiates FGFR Inhibitor Therapy and Overcomes Resistance in FGFR2 Fusion-Positive Cholangiocarcinoma

Affiliations

EGFR Inhibition Potentiates FGFR Inhibitor Therapy and Overcomes Resistance in FGFR2 Fusion-Positive Cholangiocarcinoma

Qibiao Wu et al. Cancer Discov. .

Abstract

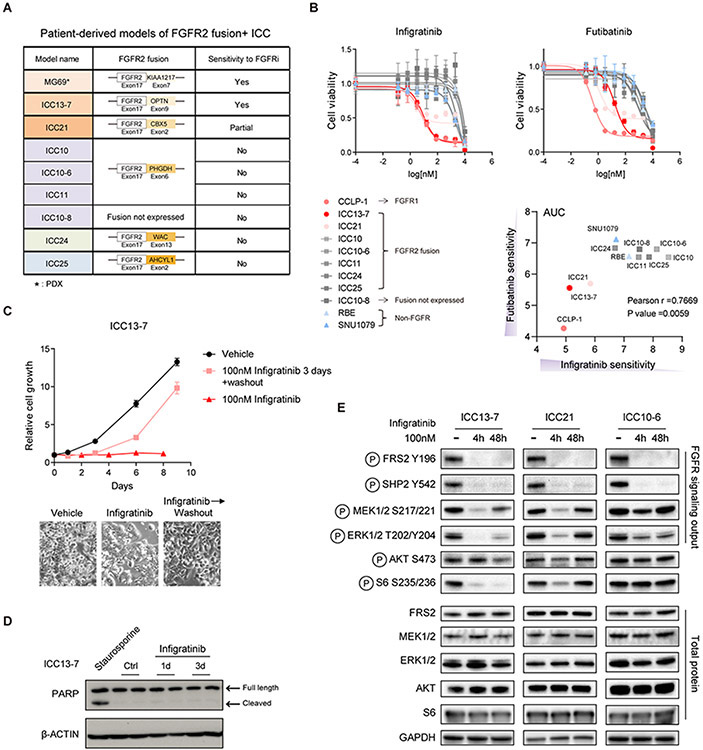
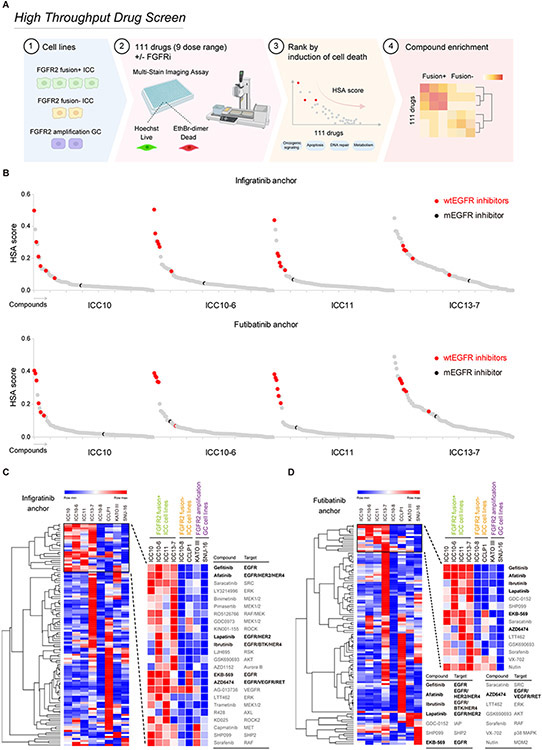
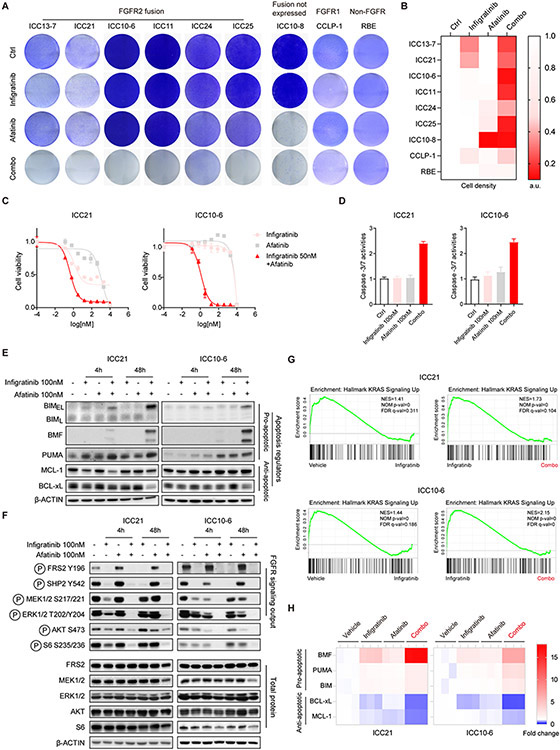
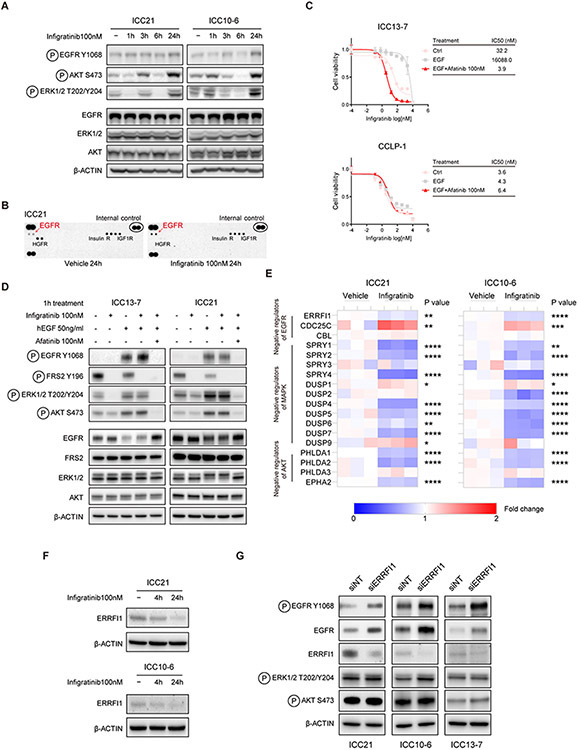
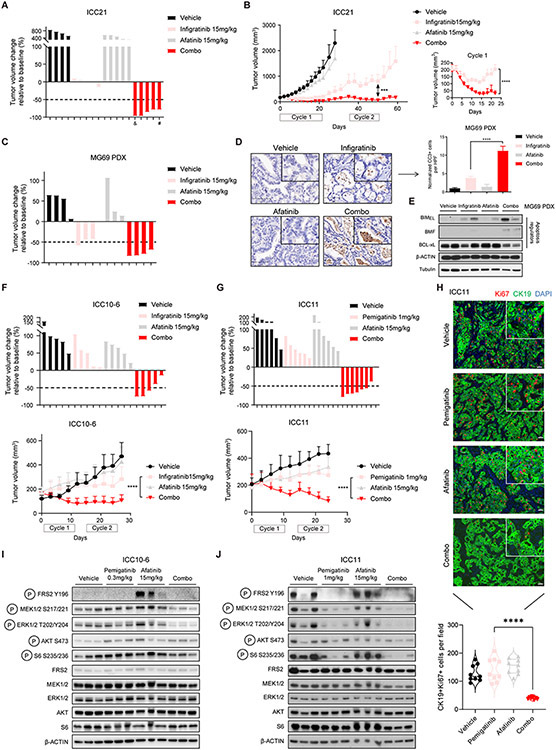
FGFR inhibitors are approved for the treatment of advanced cholangiocarcinoma harboring FGFR2 fusions. However, the response rate is moderate, and resistance emerges rapidly due to acquired secondary FGFR2 mutations or due to other less-defined mechanisms. Here, we conducted high-throughput combination drug screens, biochemical analysis, and therapeutic studies using patient-derived models of FGFR2 fusion-positive cholangiocarcinoma to gain insight into these clinical profiles and uncover improved treatment strategies. We found that feedback activation of EGFR signaling limits FGFR inhibitor efficacy, restricting cell death induction in sensitive models and causing resistance in insensitive models lacking secondary FGFR2 mutations. Inhibition of wild-type EGFR potentiated responses to FGFR inhibitors in both contexts, durably suppressing MEK/ERK and mTOR signaling, increasing apoptosis, and causing marked tumor regressions in vivo. Our findings reveal EGFR-dependent adaptive signaling as an important mechanism limiting FGFR inhibitor efficacy and driving resistance and support clinical testing of FGFR/EGFR inhibitor therapy for FGFR2 fusion-positive cholangiocarcinoma.

Significance: We demonstrate that feedback activation of EGFR signaling limits the effectiveness of FGFR inhibitor therapy and drives adaptive resistance in patient-derived models of FGFR2 fusion-positive cholangiocarcinoma. These studies support the potential of combination treatment with FGFR and EGFR inhibitors as an improved treatment for patients with FGFR2-driven cholangiocarcinoma. This article is highlighted in the In This Issue feature, p. 1171.


Conflict of interest statement

Disclosure of Potential Conflicts of Interest:

L. Goyal reports receiving research funding (to institution): Adaptimmune, Bayer, Eisai, Merck, Macrogenics, Genentech, Novartis, Incyte, Eli Lilly, Loxo Oncology, Relay Therapeutics, QED, Servier, Taiho Oncology, Leap Therapeutics, Bristol Meyers Squibb, Nucana; and she serves as an advisor/consultant to Alentis Therapeutics, Astra Zeneca, Exelixis, Genentech, H3Biomedicine, Incyte Corporation, QED Therapeutics, Servier, Sirtex Medical Ltd, and Taiho Oncology Inc. D. Juric reports receiving consulting fees from Novartis, Genentech, Syros, Eisai, Vibliome, Mapkure, and Relay Therapeutics, and commercial research support from Novartis, Genentech, Syros, Pfizer, Eisai, Takeda, Pfizer, Ribon Therapeutics, Infinity, InventisBio, and Arvinas, and has ownership interest in Relay Therapeutics, Transcode Therapeutics and PIC Therapeutics. N. Bardeesy reports receiving a commercial research grant from Taiho Pharmaceuticals. No potential conflicts of interest were disclosed by the other authors.

Figures

Figure 1.
Figure 1.. Characterization of models derived from patients with FGFR2-fusion+ ICC.
A. Summary of ICC models. (*) MG69 is a PDX model. The others are patient-derived cell lines. B. IC50 assay for evaluating the sensitivity of ICC cell lines to infigratinib and futibatinib. Each point on the dose-response curves represents 4 technical replicates (infigratinib) and 2 technical replicates (futibatinib). Data are shown as Mean ± SD. Bottom right: Correlation between infigratinib and futibatinib sensitivity. AUC denotes area under the curve calculated by GraphPad Prism 9. C. Growth curve of ICC13-7 cells treated with vehicle or 100 nM infigratinib for 8 days, or 100 nM infigratinib for 3 days followed by switch to vehicle-containing media (washout) for 5 days. Each point on the curves represents 5 technical replicates. Data are shown as Mean ± SD. Representative photomicrographs are shown below. D. Immunoblot analysis of PARP cleavage in ICC13-7 cells upon treatment with 100 nM infigratinib or vehicle for the indicated times. Staurosporine (1000 nM) served as the positive control. E. Immunoblot analysis of the indicated signaling proteins in ICC13-7 (left), ICC21 (middle), and ICC10-6 cells (right) upon treatment with 100 nM infigratinib for 4 or 48 hours versus vehicle.
Figure 2.
Figure 2.. High-throughput drug screen reveals cooperative induction of cell death by combined EGFR and FGFR inhibition in FGFR2 fusion+ ICC models.
A. Schematic of high-throughput combination drug screen (Created with BioRender.com). The cell lines screened were: FGFR2-fusion+ ICC (ICC10/ICC10-6/ICC11/ICC13-7), FGFR2-fusion- ICC (ICC10-8/CCLP-1), FGFR2 amplified GC (KATO III/SNU-16). B. Screen results for the four FGFR2-fusion+ ICC cell lines tested. The chart shows the cooperative induction of cell death across the 111 drugs screened in combination with infigratinib 100 nM (upper panel), or futibatinib 40 nM (bottom panel), based on second highest single agent (HSA) score. Inhibitors of WT EGFR/ERBB signaling are highlighted red. The mutant selective EGFR inhibitor, CO1686 (Rociletinib) is highlighted black. Other inhibitors are color coded grey. C and D. Heat map and hierarchical cluster analysis generated in Morpheus (https://software.broadinstitute.org/morpheus/) based on second HSA score with infigratinib (C) and futibatinib (D) for cell death across all cell lines screened (color scheme is based on the minimum and maximum HSA values in each row). The top ranked combinations are presented as blown-up images on the right.
Figure 3.
Figure 3.. Combined FGFR and EGFR inhibition induces apoptosis and durably inactivates downstream oncogenic signaling in FGFR2 fusion+ ICC cells.
A and B. ICC cell lines were tested for cell viability via crystal violet staining after 7 days (ICC13-7/ICC21) or 10 days treatment (all other cell lines) with single agent infigratinib 100 nM, afatinib 100 nM or the combination or vehicle control. Quantification of cell density from crystal violet staining is shown in (B). a.u. denotes arbitrary unit. C. IC50 assay evaluating the sensitivity of ICC21 (left) and ICC10-6 cells (right) to single agent infigratinib, afatinib or 50 nM infigratinib combined with a range of doses of afatinib. Each point on the dose-response curves represents 2 technical replicates. Data are shown as Mean ± SD. Experiments were repeated at least twice. D. Induction of apoptosis assessed by Caspase-3/7 activity after 3 days treatment with the indicated single agents or combination. Error bars on the graph represent 4 technical replicates. Data are shown as Mean± SD. E, F. FGFR2-fusion+ ICC cell lines were treated with vehicle, 100 nM infigratinib, 100 nM afatinib or the combination for 4 hours or 48 hours, and lysates were subjected to immunoblot analysis for (E) pro-apoptotic (BIM, BMF, PUMA) and anti-apoptotic proteins (MCL-1, BCL-xL) or (F) the indicated signaling proteins. G and H. ICC21 and ICC10-6 cells were treated with vehicle, 100 nM infigratinib, 100 nM afatinib, or the combination for 4 hours and then profiled by RNA sequencing. (G) Pathway enrichment was determined by Gene Set Enrichment Analysis (GSEA). (H) Heatmap showing relative expression changes of apoptosis regulators under different treatment conditions (normalized to vehicle). Only significantly changed genes are shown. Each column shows a biological replicate (3/condition).
Figure 4.
Figure 4.. Feedback activation of EGFR signaling limits effectiveness of FGFR inhibition.
A. ICC21 and ICC10-6 cells were treated with 100 nM infigratinib or vehicle for the indicated times and lysates were subjected to immunoblot analysis using antibodies against indicated the proteins. B. Phospho-RTK array analysis of ICC21 cells treated with vehicle or 100 nM infigratinib for 24 hours. C. ICC13-7 and CCLP-1 cells were treated with human EGF (50 ng/ml) and/or afatinib (100 nM), or with vehicle control, and tested for sensitivity to infigratinib (IC50 assay). Each point on the dose-response curves represents 4 technical replicates. Data are shown as Mean ± SD. The charts on the right report the IC50 values. D. Immunoblot analysis of ICC13-7 and ICC21 cells treated for 1 hour with human EGF (50 ng/ml), afatinib (100 nM), and/or infigratinib (100 nM) as indicated. E. RNA-seq analysis of FGFR2-fusion+ ICC models. FGFR2-fusion+ ICC cell lines (ICC21 and ICC10-6 cells) were treated with 100 nM infigratinib or vehicle for 4 hours. The heatmaps show the relative expression of negative regulators of EGFR, RTK/MAPK and PI3K/AKT signaling. Each column shows a biological replicate (3/condition). *P<0.05, **P<0.01, ***P<0.001, ****P<0.0001. F. Immunoblot analysis of ICC21 and ICC10-6 cells treated with vehicle or 100 nM infigratinib for the indicated timepoints. G. FGFR2-fusion+ ICC cell lines (ICC21/ICC10-6/ICC13-7 cells) were transfected with ERRFI1 siRNA or non-targeting control siRNA and then subjected to immunoblot analysis.
Figure 5.
Figure 5.. Combination FGFR/EGFR inhibitor treatment is effective against FGFR2+ ICC models in vivo.
A and B. Mice harboring ICC21 subcutaneous xenografts with a starting tumor volume ~200 mm3 were treated with vehicle (n=4), infigratinib 15 mg/kg (n=5), afatinib 15 mg/kg (n=5), or the combination of both drugs (n=5). Mice were treated daily for 21 days, provided an intervening 14-day drug holiday, and then received a second cycle of treatment. (A) Waterfall plot showing tumor volume changes after first treatment cycle (21 days). #: treatment stopped at day-15 and resumed on day 19. &: euthanized after 20-days treatment. (B) Serial monitoring of tumor size. Right panel: Blown up image of tumor growth curves of the infigratinib and combination groups during treatment cycle 1 (21 days). ***P<0.001. ****P<0.0001. Data are shown as Mean ± SD. C-E. Mice bearing subcutaneous tumors from the MG69 PDX model (starting tumor volume ~600 mm3) were treated daily for 10 days with vehicle (n=4), infigratinib 15 mg/kg (n=4), afatinib 15 mg/kg (n=3), or the combination of both drugs (n=4). C: waterfall plot showing tumor volume changes after 10 days treatment. D: representative images of immunohistochemistry staining for cleaved caspase-3 in tumor samples after 10 days treatment. Data are quantified in the chart. Bar: 100 μm. HPF: high power field. One-way ANOVA multiple comparisons with Tukey correction were used to analyze the data. ****P<0.0001. Data are shown as Mean ± SEM. E: immunoblot analysis of apoptosis regulators from tumor lysates after 10 days treatment. F. Mice bearing ICC10-6 subcutaneous xenograft tumors were treated with vehicle, infigratinib 15 mg/kg, afatinib 15 mg/kg, or the combination for cycles of 10 days, with an intervening 4-day drug holiday. Upper: waterfall plot of tumor volume changes at the end of treatment cycle 1 (10 days). Lower: serial monitoring of tumor size. n = 5 mice per group. Two-way ANOVA multiple comparisons with Tukey correction were used to analyze the data. ****P<0.0001. Data are shown as Mean± SD. G. Mice bearing ICC11 subcutaneous xenograft tumors were treated with vehicle (n=6), pemigatinib (1 mg/kg) (n=6), afatinib 15 mg/kg (n=6), or the combination of both drugs (n=8). Treatment was given daily for 10-day cycles with intervening 4-day drug holidays. Upper: Waterfall plot of tumor volume changes at the end of the second cycle of treatment. Lower: Serial monitoring of tumor size. H. Representative immunofluorescence staining for CK19 (green) and Ki67 (red) in tumors from ICC11 dose escalation study after cycle 3 of treatment. Data are quantified in the chart at the bottom. One-way ANOVA multiple comparisons with Tukey correction were used to analyze the data. ****P<0.0001. I. Immunoblot analysis of tumor lysates from the ICC10-6 subcutaneous xenograft model subjected to the indicated treatments for 8 days. Tumors were harvested 6 hours after the last dose of treatment. J. Immunoblot analysis of tumor lysates from ICC11 dose escalation study after cycle 3 of treatment. Tumors were harvested 6 hours after the last dose of treatment.

References

    1. Valle JW, Lamarca A, Goyal L, Barriuso J, Zhu AX. New Horizons for Precision Medicine in Biliary Tract Cancers. Cancer Discov. 2017;7:943–62. - PMC - PubMed
    1. Valle J, Wasan H, Palmer DH, Cunningham D, Anthoney A, Maraveyas A, et al. Cisplatin plus Gemcitabine versus Gemcitabine for Biliary Tract Cancer. N Engl J Med. 2010;362:1273–81. - PubMed
    1. Wu Y-M, Su F, Kalyana-Sundaram S, Khazanov N, Ateeq B, Cao X, et al. Identification of Targetable FGFR Gene Fusions in Diverse Cancers. Cancer Discov. 2013;3:636–47. - PMC - PubMed
    1. Arai Y, Totoki Y, Hosoda F, Shirota T, Hama N, Nakamura H, et al. Fibroblast growth factor receptor 2 tyrosine kinase fusions define a unique molecular subtype of cholangiocarcinoma. Hepatology. 2014;59:1427–34. - PubMed
    1. Nakamura H, Arai Y, Totoki Y, Shirota T, Elzawahry A, Kato M, et al. Genomic spectra of biliary tract cancer. Nat Genet. 2015;47:1003–10. - PubMed

Publication types

MeSH terms