. 2022 Jul 6;12(7):1742-1759.
doi: 10.1158/2159-8290.CD-21-0900.

Vitamin E Enhances Cancer Immunotherapy by Reinvigorating Dendritic Cells via Targeting Checkpoint SHP1

Affiliations

Vitamin E Enhances Cancer Immunotherapy by Reinvigorating Dendritic Cells via Targeting Checkpoint SHP1

Xiangliang Yuan et al. Cancer Discov. .

Abstract

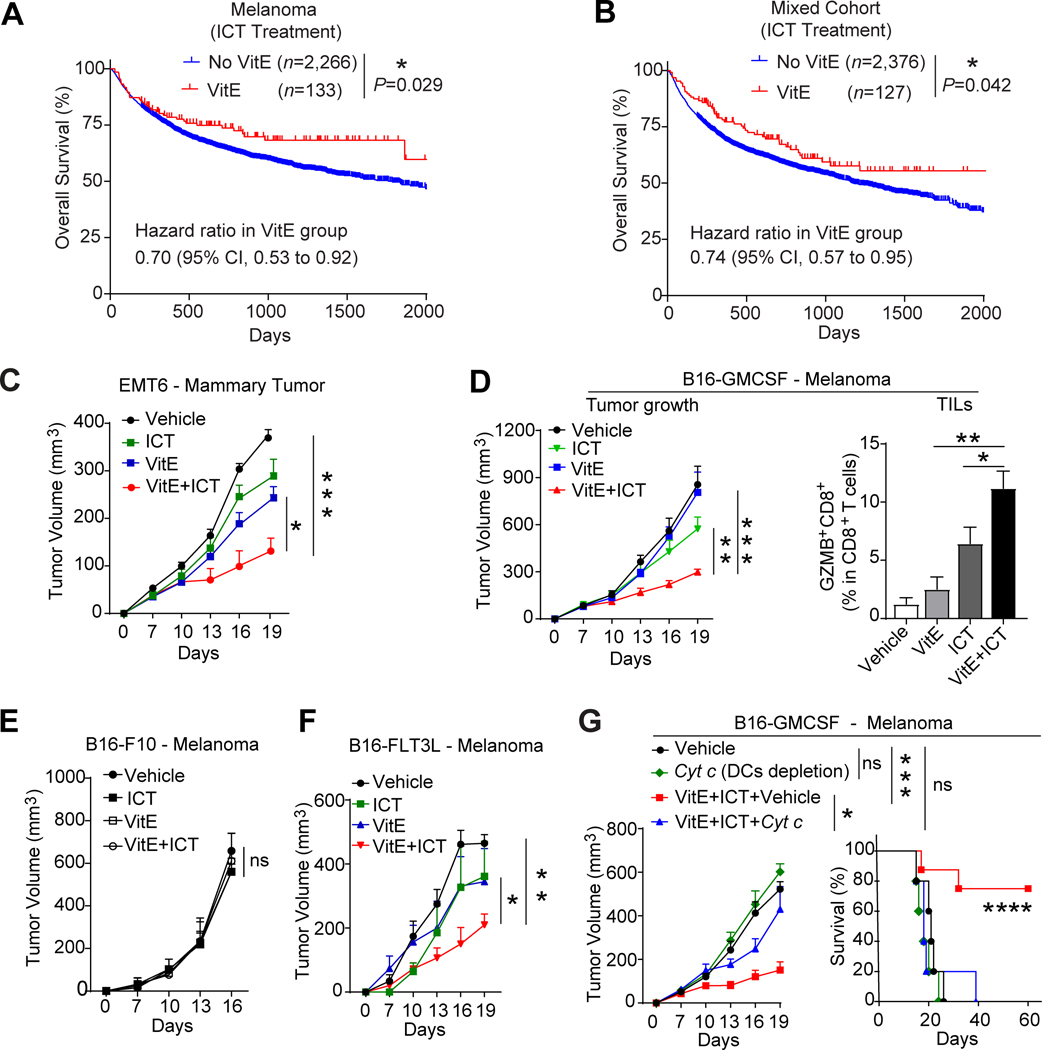
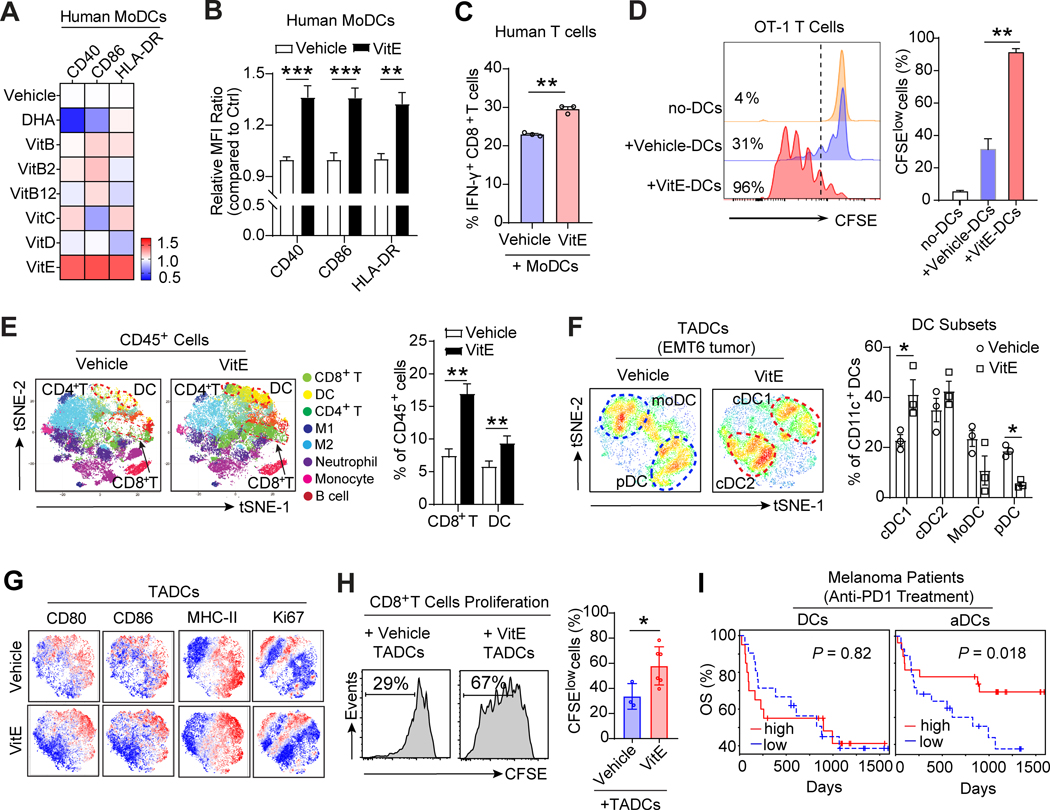
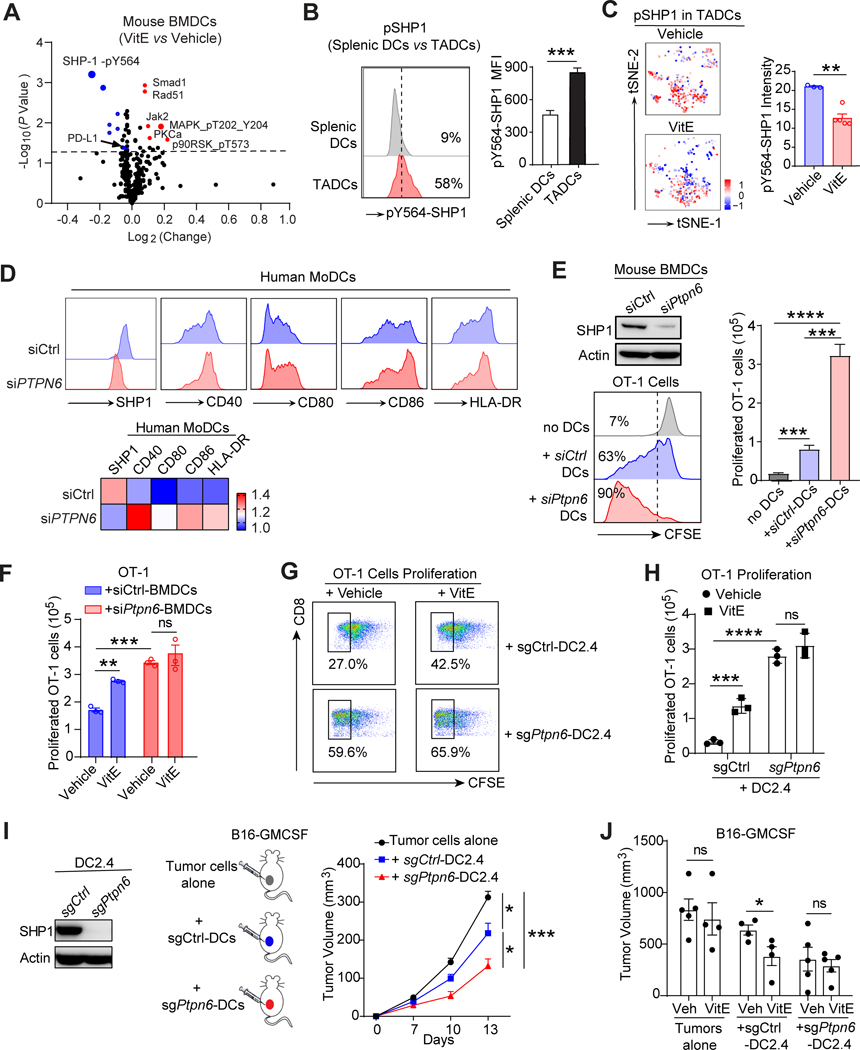
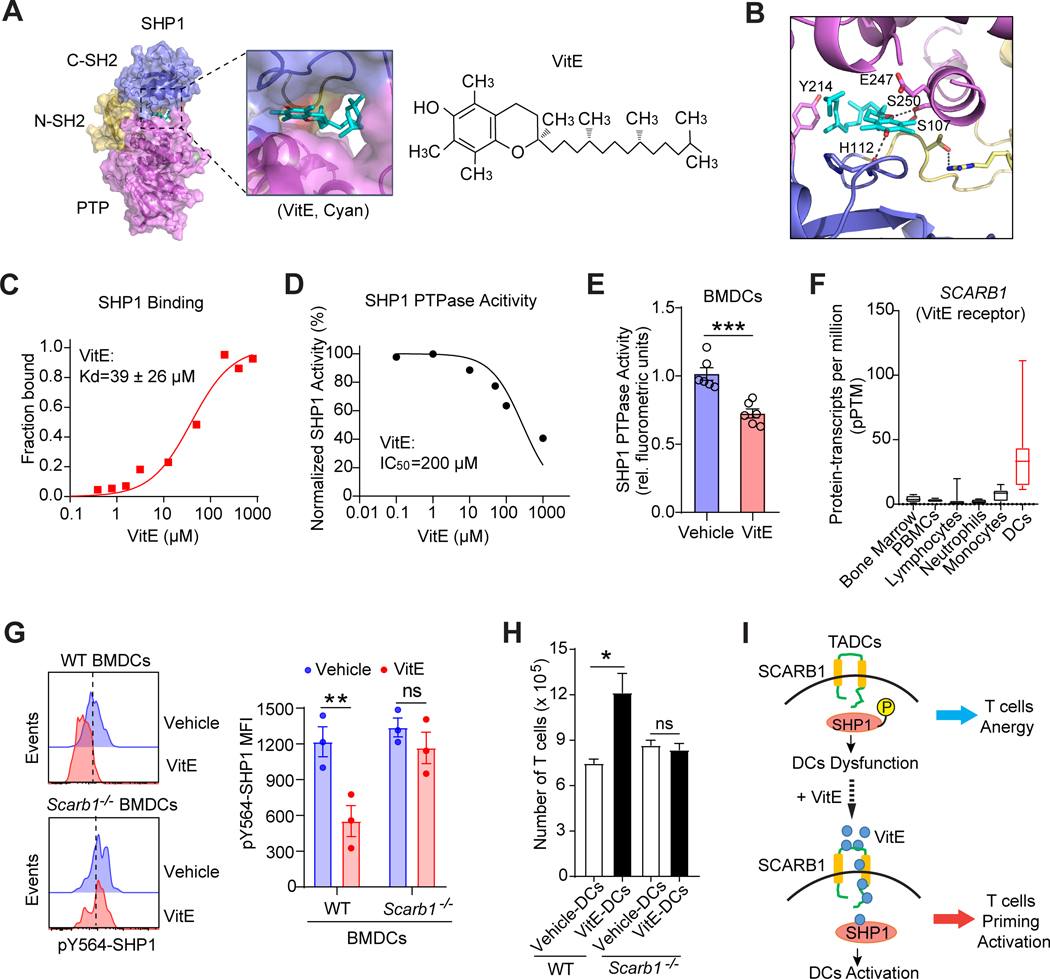
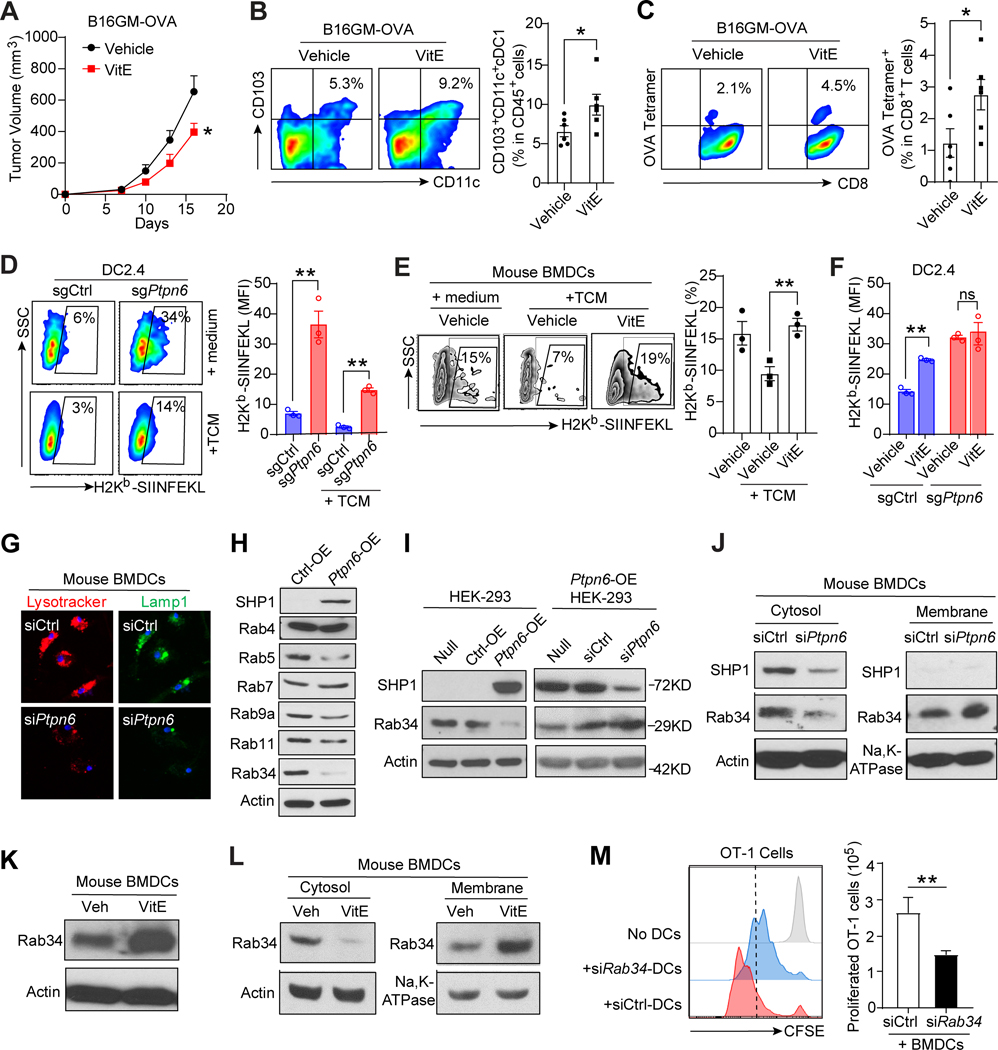
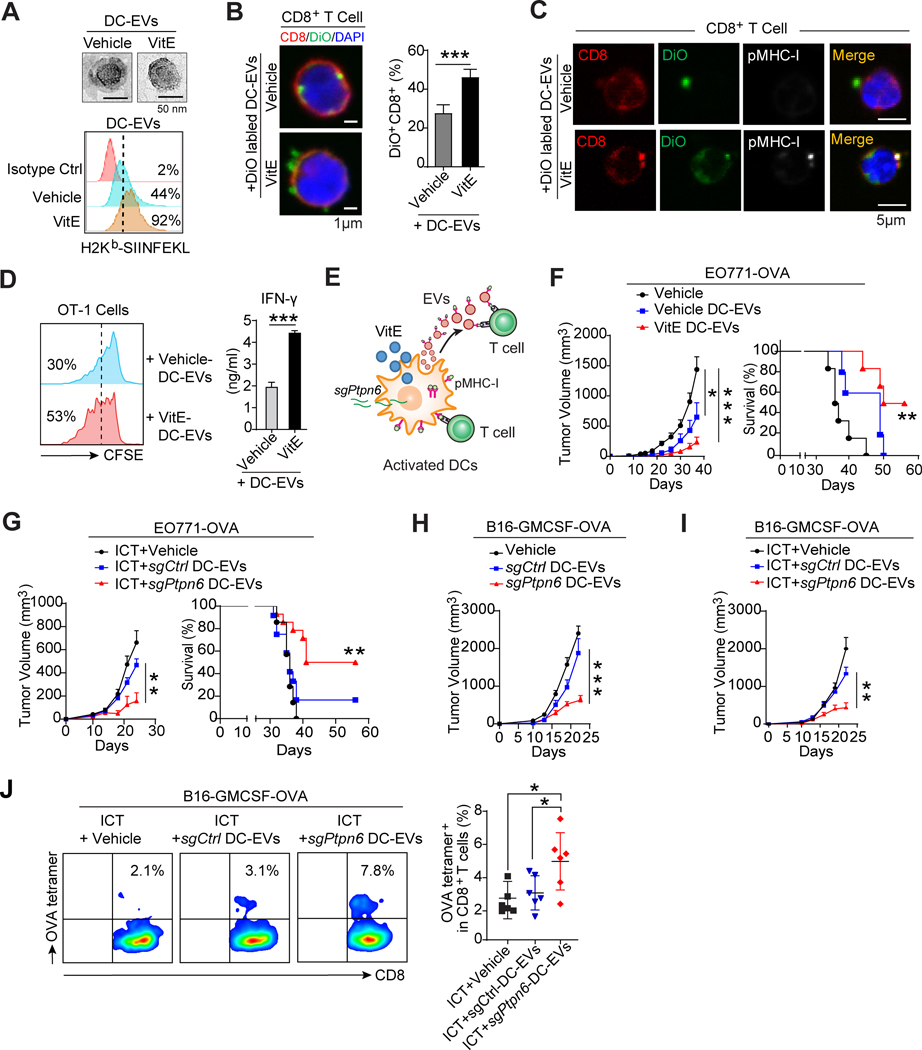
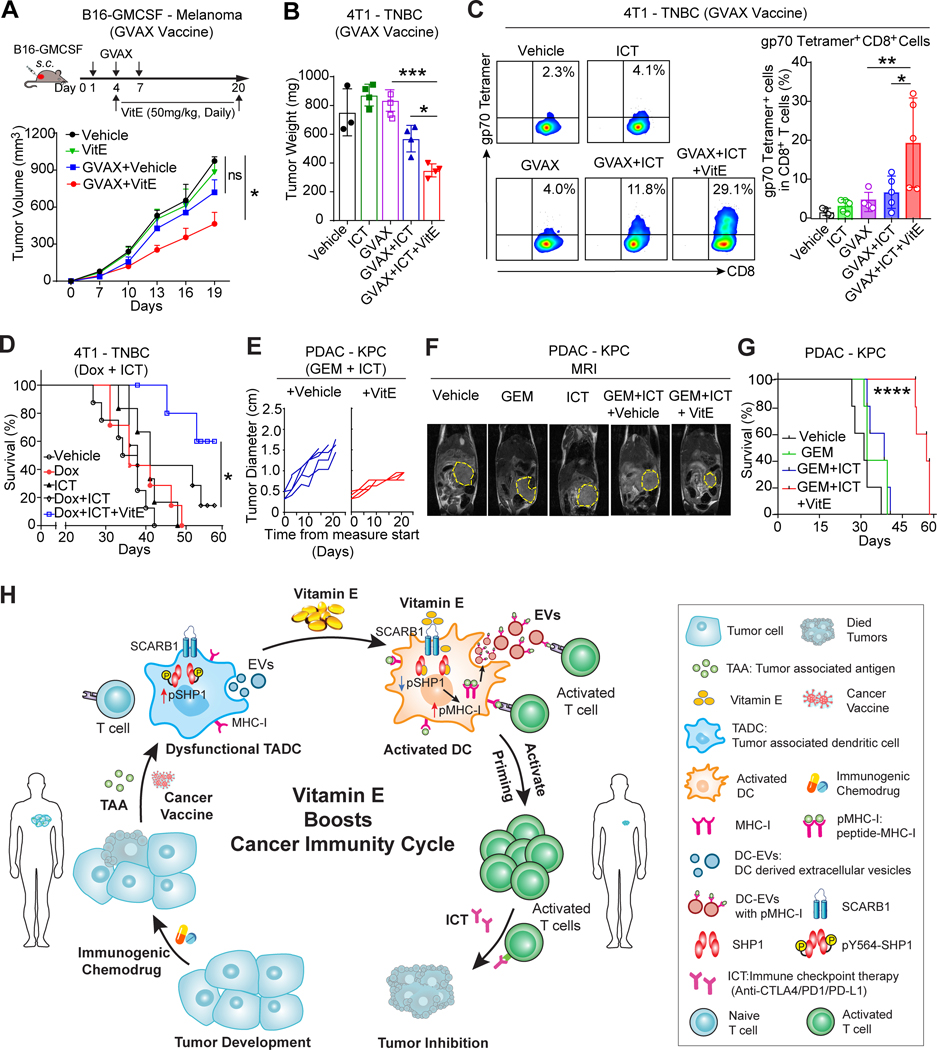
Despite the popular use of dietary supplements during conventional cancer treatments, their impacts on the efficacies of prevalent immunotherapies, including immune-checkpoint therapy (ICT), are unknown. Surprisingly, our analyses of electronic health records revealed that ICT-treated patients with cancer who took vitamin E (VitE) had significantly improved survival. In mouse models, VitE increased ICT antitumor efficacy, which depended on dendritic cells (DC). VitE entered DCs via the SCARB1 receptor and restored tumor-associated DC functionality by directly binding to and inhibiting protein tyrosine phosphatase SHP1, a DC-intrinsic checkpoint. SHP1 inhibition, genetically or by VitE treatment, enhanced tumor antigen cross-presentation by DCs and DC-derived extracellular vesicles (DC-EV), triggering systemic antigen-specific T-cell antitumor immunity. Combining VitE with DC-recruiting cancer vaccines or immunogenic chemotherapies greatly boosted ICT efficacy in animals. Therefore, combining VitE supplement or SHP1-inhibited DCs/DC-EVs with DC-enrichment therapies could substantially augment T-cell antitumor immunity and enhance the efficacy of cancer immunotherapies.

Significance: The impacts of nutritional supplements on responses to immunotherapies remain unexplored. Our study revealed that dietary vitamin E binds to and inhibits DC checkpoint SHP1 to increase antigen presentation, prime antitumor T-cell immunity, and enhance immunotherapy efficacy. VitE-treated or SHP1-silenced DCs/DC-EVs could be developed as potent immunotherapies. This article is highlighted in the In This Issue feature, p. 1599.


Figures

Figure 1.
Figure 1.. Dietary VitE augments ICT efficacy dependent on DCs.
A, Overall survival of melanoma patients who took dietary vitamin E supplement (VitE, n=133) during ICT treatment (Anti-PD-1/PDL1) compared with patients who didn’t take VitE and/or multivitamins (No VitE, n=2,266). B, Overall survival of a mixed cohort of cancer patients (599 breast cancer, 914 colon cancer, and 990 kidney cancer) who took dietary vitamin E supplement (VitE, n=127) during ICT treatment compared with patients who didn’t take VitE and/or multivitamins (No VitE, n=2, 376). C, Growth curve of EMT6 mammary tumors in mammary fat pads of BALB/c mice treated with vehicle, VitE (50mg/kg, oral gavage), ICT (anti-PD1, 200 mg/mouse, by i.p.) or VitE+ICT. D-F, Growth curves of orthotopic B16-GMCSF (D, left), B16-F10 (E), B16-FLT3L (F) melanomas in C57BL/6 mice treated with vehicle, VitE (50mg/kg, oral gavage), ICT (anti-PD1, 200μg/mouse and anti-CTLA4, 100μg/mouse by i.p.), or VitE+ICT. Flow cytometry quantification of GranzymeB+CD8+ tumor-infiltrating lymphocytes (TILs) in B16-GMCSF tumor tissues collected 20 days post-implantation (D, right). (n=5/group). G, Growth curves (left) and Kaplan–Meier survival curves (right) of C57BL/6 mice bearing B16-GMCSF melanomas treated with vehicle (n=4), Cyt c that depletes DCs (n=5), ICT (anti-PD1/anti-CTLA4) +VitE (n=8), or ICT+VitE+Cyt c (n=10). Mean ± s.e.m (C, D, E, F, G). One-way analysis of variance (ANOVA) and Tukey’s test for multiple comparisons (C, D, E, F, G tumor growth), log-rank (Mantel-Cox) test survival comparison (A, B, G). The statistical significance is defined by P-value: ns, no significant. *P < 0.05, **P < 0.01, ***P < 0.001, ****P < 0.0001.
Figure 2.
Figure 2.. VitE enhances DCs activation in vitro and reinvigorates DCs function in vivo.
A, Heat-map depicting relative expressions of co-stimulatory molecules in human MoDCs treated with indicated dietary supplements, including VitE (50μg/ml), VitC (20μg/ml), VitD (100ng/ml), VitB (folate, 200ng/ml), VitB2 (2μg/ml), VitB12 (10ng/ml), and DHA (Omega-3, 100μM) for 48h, and then stimulated with LPS (20ng/ml) for 24h. The mean fluorescence intensity (MFI) of each molecule was normalized to the MFI of the vehicle-treated group measured by flow cytometry. B, Quantification of the indicated DC activation marker expressions in human MoDCs treated with vehicle or VitE (50μg/ml) for 48h in the presence of LPS (20ng/ml), and MFI were calculated relative to vehicle treatment (defined as 1). C, Percentage of human IFN-γ+CD8+ T cells out of total CD8+ T cells in coculture with the vehicle- or VitE-treated autologous MoDCs (n=3). D, Representative flow cytometric analysis and quantification of antigen-specific OT-1 T cell proliferation cocultured with the vehicle- or VitE-treated and OVA-loaded mouse BMDCs at day3. E, t-Distributed stochastic neighbor embedding (t-SNE) plot of tumor-infiltrating CD45+ immune cells overlaid with color-coded clusters from the vehicle- or VitE-treated EMT6 tumors. Dotted ellipses highlight clusters with significant differences between the two groups at day 15 post-implantation (n=6). The quantification of CD8+ T cells and DCs are shown (left panel, n=6). F, The overlaid density plots of CD11c+ tumor-associated dendritic cells (TADCs) from vehicle- or VitE-treated EMT6 tumors in BALB/c mice. The quantification of distinct DCs subsets was shown (left panel, n=3). The distinct DCs subsets are labeled: cDC1, conventional type 1 DC; cDC2, conventional type 2 DC; pDC, plasmacytoid DC; MoDC, monocyte-derived DC. G, t-SNE plots of TADCs overlaid with the expressions of indicated markers from the vehicle- versus VitE-treated EMT6 mammary tumors. H, Representative histograms of CD8+ T cell proliferation. CD8+ T cells were cocultured with TADCs at 10:1 ratio (left panel) and quantified using CFSE dilution (right panel). TADCs were purified from EMT6 tumor-bearing mice at day 10 post-treatment with vehicle or VitE. I, Overall survival of melanoma patients who had tumor-infiltrating total DCs high (n=20) vs. low (n=21) or activated DCs (aDCs) high (n=20) vs. low (n=21) before anti-PD-1 treatment. High and low were defined as higher or lower, respectively, than the median for the cohort (PRJEB23709). Mean ± s.e.m (B, C, D, E, F, H, I). Two-sided Student’s t-test (B, C, E, F, H). One-way analysis of variance (ANOVA) and Tukey’s test for multiple comparisons (D), log-rank (Mantel-Cox) test survival comparison (I). The statistical significance is defined by P-value: *P < 0.05, **P < 0.01, ***P < 0.001.
Figure 3.
Figure 3.. VitE restores TADCs function by inhibiting SHP1 and boosts DCs-induced antitumor immunity.
A, Volcano plot of reverse phase protein array (RPPA) data of vehicle- or VitE (50μg/ml)-treated mouse BMDCs growing in tumor conditioned media (TCM) for 48 hours. Differentially expressed proteins are labeled, and the top hits are marked in red (up-regulated proteins) or blue (down-regulated proteins). The grey dashed line indicates P-value of 0.05. B, Flow cytometric analysis of the intensity of pY564-SHP1 in spleen DCs and TADCs from EMT6 mammary tumor-bearing mice (n=6). C, t-SNEs by CyTOF and quantification comparing the intensity of pY564-SHP1 in TADCs from the vehicle- or VitE-treated EMT6 tumors at day 15 post-implantation. D, Flow cytometry analysis (top) and heat-map (bottom) depicting relative expressions of SHP1 and co-stimulatory molecules on siCtrl or siPTPN6 transfected human MoDCs. E, The effective SHP1 knockdown in BMDCs by siPtpn6 versus siCtrl (left, top). CFSE-dilution analysis (left, bottom) and quantification (right panel) of OT-1 T cells co-cultured with OVA-pulsed BMDCs (ratio 10:1) transfected with siPtpn6 versus with siCtrl as a control (n=3). F, Quantified proliferation of OT-1 T cell cocultured with OVA-loaded vehicle- or VitE-treated siCtrl- or siPtpn6-mouse BMDCs (n = 3). G, Representative flow cytometric CFSE-dilution analysis of OT-1 T cells co-cultured with OVA-pulsed sgCtrl-DC2.4 or sgPtpn6-DC2.4 cells treated with vehicle or VitE (ratio 10:1) (n=3). H, Quantification (absolute numbers) of OT-1 T cells co-cultured with OVA-pulsed sgCtrl-DC2.4 or sgPtpn6-DC2.4 cells treated with vehicle or VitE (ratio 10:1) (n=3) as in G. I, Growth curves of B16-GMCSF melanoma cells alone (n=6), versus co-implanted with sgCtrl-DC2.4 cells (n=10) or sgPtpn6-DC2.4 cells (n=10) in C57BL/6 mice. J, The quantification of tumor size (Day 20) in C57BL/6 mice transplanted with B16-GMCSF tumor cells alone, or co-implanted with sgCtrl- or sgPtpn6-DC2.4 cells and under the vehicle- or VitE- (50mg/kg, oral gavage, daily) treatment (n=4–5). Mean ± s.e.m (B, C, E, F, H, I, J). Two-sided Student’s t-test (B, C). One-way analysis of variance (ANOVA) and Tukey’s test for multiple comparisons (E, F, H, I, J). The statistical significance is defined by P-value: *P < 0.05, **P < 0.01, ***P < 0.001, ****P < 0.0001.
Figure 4.
Figure 4.. VitE directly binds and inhibits SHP1 activity after entering DCs via SCARB1.
A, Docking model of VitE (α-tocopherol) and auto-inhibitory SHP1 (PDB ID: 2B3O). Surface presentation of SHP1 in complex with VitE (cyan) bound in its central cavity, which is formed at the interface of all three domains of SHP1 (N-SH2, brown; C-SH2, blue; PTP, magenta). B, Interactions of VitE with all three domains of SHP1 stabilized in its inhibitory conformation. Molecular forces implied in the interactions are hydrogen bonds with His112 (C-SH2) and Ser250 (PTP), hydrophobic interactions with His112 (C-SH2), Tyr214 (PTP) and Glu247 (PTP), and intramolecular hydrogen bonds between Ser 250 and Ser107. C, The binding of VitE to purified SHP1 was analyzed by microscale thermophoresis (MST) binding assay. The apparent dissociation constant Kd is 39 ± 26 μM (mean of triplicates). D, Relative tyrosine phosphatase activity of SHP1 immunoprecipitated from LPS (100ng/ml)-activated DC2.4 cells in the presence of indicated doses of VitE (mean of triplicates). E, SHP1 tyrosine phosphatase activity in LPS (100ng/ml)-activated BMDCs (n=6) treated with vehicle or VitE (50μg/ml). F, Normalized consensus protein-transcripts per million (pPTM) of SCARB1 in human immune cells from the Human Protein Atlas (HPA). G, FACS analyses of pSHP1 expression in the vehicle- or VitE-treated BMDCs from wild type (WT, Scarb1+/+) or Scarb1 knockout (Scarb1−/−) C57BL/6 mice (n=3). H, Quantification of T cell proliferation under coculture with WT or Scarb1−/− DCs (n=5). I, Model of VitE restoring TADCs function via SCARB1-SHP1 axis, leading to enhanced antitumor T cell immunity. Error bars, s.e.m. Two-sided Student’s t-test (E, G, H). The statistical significance is defined by P-value: ns, no significant. *P < 0.05, **P < 0.01, ***P < 0.001.
Figure 5.
Figure 5.. SHP1 inhibition enhances the antigen cross-presentation of DCs.
A, Growth curves of orthotopic B16-GMCSF-OVA (B16GM-OVA) melanomas in C57BL/6 mice treated with vehicle or 50mg/kg of VitE (n=5). B, Flow cytometry analysis and quantification of CD103+CD11c+ cross-presenting DCs in B16GM-OVA tumor tissues collected at 16 days post-implantation from vehicle- or VitE-treated C57BL/6 mice (n=5). C, Flow cytometry analysis and quantification of OVA antigen-specific OVA-tetramer+CD8+ T (SIINFEKL+CD8+) cells in tumor tissues as in B above (n=5). D, Flow cytometric analysis and quantification of H-2Kb-SIINFEKL MFI in OVA-loaded sgCtrl or sgPtpn6-DC2.4 cells cultured in RPMI1640+10%FBS without (medium) or with TCM (n=3). E, FCM analysis and quantification of H-2Kb-SIINFEKL (%) in BMDCs cultured in medium without or with TCM and treated with the vehicle- or VitE (n=3). F, Quantification of H-2Kb-SIINFEKL MFI in the vehicle- or VitE-treated sgCtrl-DC2.4 or sgPtpn6-DC2.4 (n=3). G, Confocal microscopy projections of staining of LysoTracker (red) and LAMP-1 (green) of scrambled siRNA (control) or Ptpn6 siRNA transfected BMDCs. H, Immunoblot of indicated Rab GTPase proteins in Ptpn6-transfected versus control HEK-293 cells. I, Immunoblot of Rab34 protein in HEK-293 cells with Ptpn6-overexpression (OE) or Ptpn6-OE-HEK-293 cells with Ptpn6 knockdown (KD). J, Cytosol and membrane Rab34 levels in siCtrl- and siPtpn6-BMDCs. K, Immunoblot of Rab34 proteins in BMDCs treated with vehicle (Veh) or VitE for 48h. L, Cytosol and membrane Rab34 levels in BMDCs pre-treated with vehicle (Veh) or VitE for 48h. M, CFSE-dilution analysis of OT-1 T cells co-cultured with OVA-pulsed BMDCs with knockdown of Rab34 by siRab34 versus control BMDCs transfected with siCtrl (n=3). Error bars, s.e.m. Two-sided Student’s t-test (B, C, M). One-way ANOVA with Tukey’s multiple comparison post-test (D, E, F). The statistical significance is defined by P-value: ns, no significant. *P < 0.05, **P < 0.01.
Figure 6.
Figure 6.. SHP1 inhibition enhances the antigen cross-presentation of DC-derived EVs to boost system antitumor immunity.
A, A representative transmission electron microscope (TEM) image of DC-EVs (top) and flow cytometric analysis of H-2Kb-SIINFEKL in DC-EVs (bottom) derived from OVA-loaded BMDCs treated with vehicle or VitE. B, Confocal microscopy analysis (left) and quantification (right, n=5) of DiO+CD8+ T cells after T cells were incubated with vehicle- or VitE-treated DiO-labelled DC-EVs for 48 hrs. C, Confocal microscopy analysis of pMHC-I+CD8+ T cells after incubating T cells with vehicle- or VitE-treated BMDCs-derived EVs and immunofluorescent staining with CD8 and pMHC-I antibodies. EVs were collected from DiO-labelled and OVA-loaded BMDCs. D, Flow cytometry analysis of the proliferation of OT-1 T cells cultured with the addition of EVs derived from OVA-loaded vehicle-DC-EVs or VitE-DC-EVs (left panel). IFN-γ production by OT-1 T cells with the indicated treatment was measured by ELISA (right panel, n=5). E, Schema of adjacent T cell activation by cell-cell contact with VitE-treated DCs or sgPtpn6-transfected DCs and of distal T cell activation via pMHC-I expressing DC-EVs. F, Growth of EO771-OVA mammary tumors and survival of mice treated with PBS (Vehicle), or DC-EVs (30 μg/mouse) isolated from DCs pretreated with vehicle (vehicle-DC-EVs), or with VitE (VitE-DC-EVs) (n=6/group). G, Growth of EO771-OVA mammary tumors and survival of mice treated with ICT (anti-PD1, 200μg/mouse by i.p. at day 7, 10, 13) in combination with PBS, or DC-EVs (30 μg/mouse) isolated from DC2.4 cells transfected with sgCtrl (sgCtrl-DC2.4-EVs), or with sgPtpn6 (sgPtpn6-DC2.4-EVs) by i.v. at day 2, 9, and 16 (n=6/group). H and I, Growth curves of subcutaneous B16-GMCSF-OVA tumors in mice treated with vehicle, sgCtrl-DC2.4-EVs or sgPtpn6-DC2.4-EVs (30μg/mouse) by i.v. at day 2, 9, and 16 (H, n = 6/group) and treated with ICT (anti-PD1) in combination with vehicle, sgCtrl-DC2.4-EVs or sgPtpn6-DC2.4-EVs (I, n=6/group). J, Flow cytometry analysis and quantification of OVA-tetramer+CD8+ T cells in B16-GMCSF-OVA tumors from the 3 mouse groups described in I (n=6/group). Error bars, s.e.m. Two-sided Student’s t-test (B, D). One-way ANOVA with Tukey’s multiple comparison post-test (F tumor volume, G tumor volume, H, I, and J). Two-sided log-rank test (F, G, survival curves). The statistical significance is defined by P-value: ns, no significant. *P < 0.05, **P < 0.01, ***P < 0.001.
Figure 7.
Figure 7.. VitE enhances immune induction therapies to augment immunotherapy.
A, Diagram of the experimental paradigm (top) and growth curves of orthotopic B16-GMCSF tumors (bottom) in mice vaccinated with or without GVAX (s.c. at day 1, 4, 7), then treated with vehicle or VitE (50mg/kg/day) by oral gavage from day 4 to day 20 (n=6/group). B, Tumor weight of 4T1 tumors from mice treated with vehicle, GVAX, ICT (anti-PD1/anti-CTLA4), or GVAX+ICT in combination with vehicle or VitE (50mg/kg/day, oral gavage from day 4 to day 25). Tumors were harvested on day 25 post-inoculation. C, Flow cytometric analysis (left) and quantification (right) of gp70 tetramer+ CD8+ T cells in 4T1 tumors collected at day 14 post-implantation from mice under indicated treatments (n=3–5/group). D, Kaplan-Meier survival curve of 4T1 tumor-bearing mice treated with vehicle, low dose of Doxorubicin (Dox, 5mg/kg by i.v.), ICT (anti-PD1/anti-CTLA4), or Dox+ICT plus vehicle- or VitE-administrations (n=5–10). E, Measurement of maximal tumor diameter in HY1936 KPC tumor-bearing mice treated with GEM (gemcitabine, 25 mg/kg, i.p.) and ICT (anti-PD1/anti-CTLA4) plus vehicle- or VitE-administrations (n=4–5). F, Representative magnetic resonance images (MRI) of mice with established HY19636KPC PDAC tumors (yellow outline) after indicated treatments for 20 days. G, Kaplan-Meier survival curve of HY19636KPC tumor-bearing mice treated with vehicle, GEM (gemcitabine, 25 mg/kg, i.p.), GEM + ICT (anti-PD1/anti-CTLA4) plus vehicle or VitE administrations. H, Model of VitE reinvigorating TADCs function and boosting antitumor immunity. Dendritic cells (DCs) are central regulators of the cancer-immunity cycle. Upon VitE treatment, VitE reinvigorates dysfunctional TADCs by inhibiting pSHP1/SHP1 to enhance cross-presentation of DCs and DC-EVs, which synergize with ICT and/or DC-enrichment immune induction therapies leading to effective antitumor immunity. Error bars, s.e.m. One-way ANOVA with Tukey’s multiple comparison post-test (A, B, C). Two-sided log-rank test (D, G). The statistical significance is defined by P-value: ns, no significant. *P < 0.05, ***P < 0.001, ****P < 0.0001.

References

    1. Kantor ED, Rehm CD, Du M, White E, Giovannucci EL. Trends in Dietary Supplement Use Among US Adults From 1999–2012. Jama 2016;316(14):1464–74 doi 10.1001/jama.2016.14403. - DOI - PMC - PubMed
    1. Du M, Luo H, Blumberg JB, Rogers G, Chen F, Ruan M, et al. Dietary Supplement Use among Adult Cancer Survivors in the United States. The Journal of nutrition 2020;150(6):1499–508 doi 10.1093/jn/nxaa040. - DOI - PMC - PubMed
    1. Tajan M, Vousden KH. Dietary Approaches to Cancer Therapy. Cancer cell 2020;37(6):767–85 doi 10.1016/j.ccell.2020.04.005. - DOI - PubMed
    1. Jordan S, Tung N, Casanova-Acebes M, Chang C, Cantoni C, Zhang D, et al. Dietary Intake Regulates the Circulating Inflammatory Monocyte Pool. Cell 2019;178(5):1102–14 e17 doi 10.1016/j.cell.2019.07.050. - DOI - PMC - PubMed
    1. Wei SC, Duffy CR, Allison JP. Fundamental Mechanisms of Immune Checkpoint Blockade Therapy. Cancer discovery 2018;8(9):1069–86 doi 10.1158/2159-8290.CD-18-0367. - DOI - PubMed

Publication types

Substances