. 2022 Apr 15;376(6590):eabf8271.
doi: 10.1126/science.abf8271. Epub 2022 Apr 15.

Inhibition of nonalcoholic fatty liver disease in mice by selective inhibition of mTORC1

Affiliations

Inhibition of nonalcoholic fatty liver disease in mice by selective inhibition of mTORC1

Bridget S Gosis et al. Science. .

Abstract

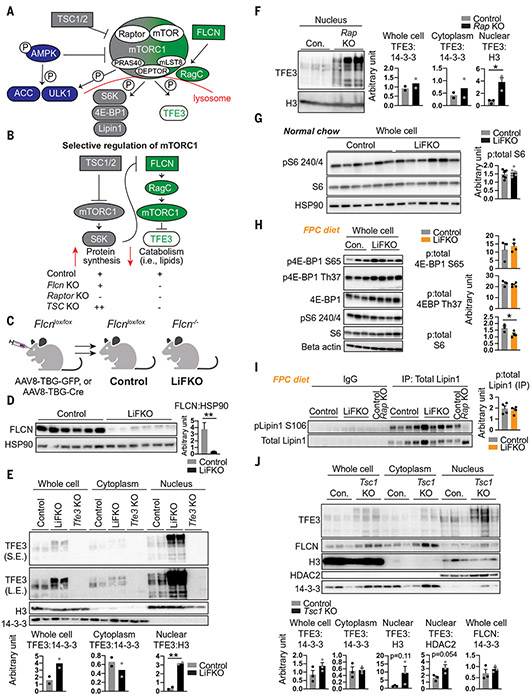
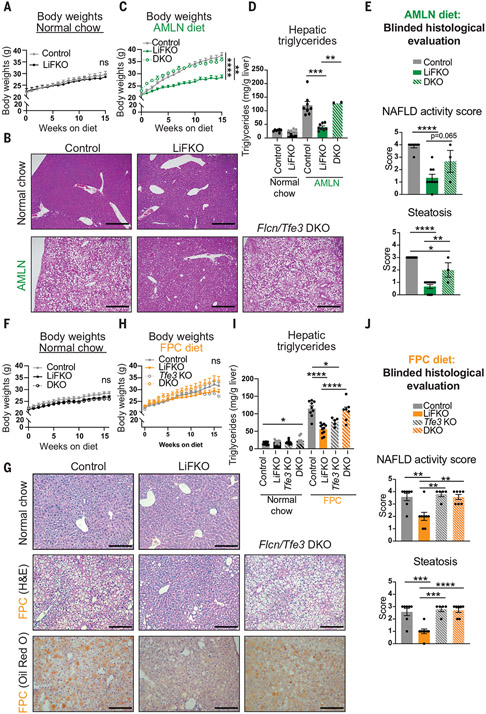
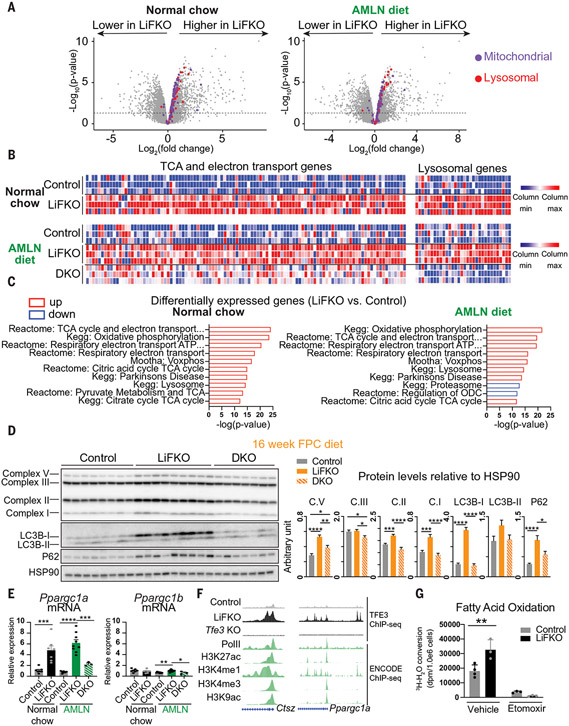
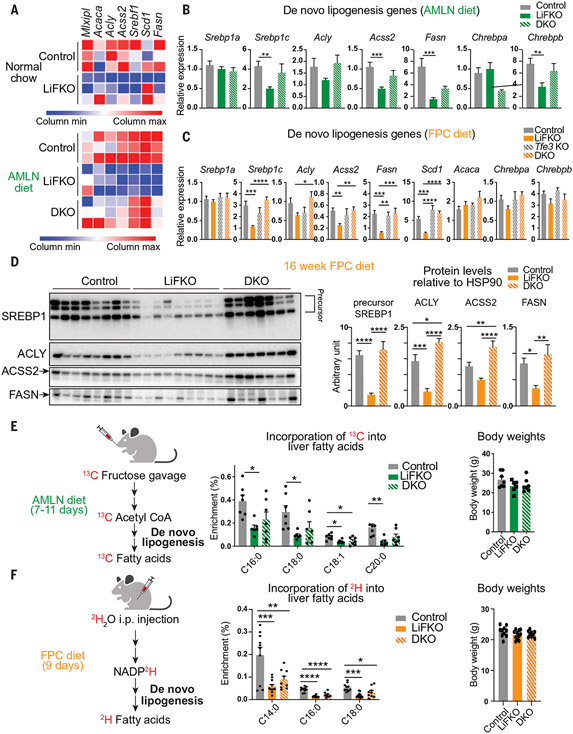
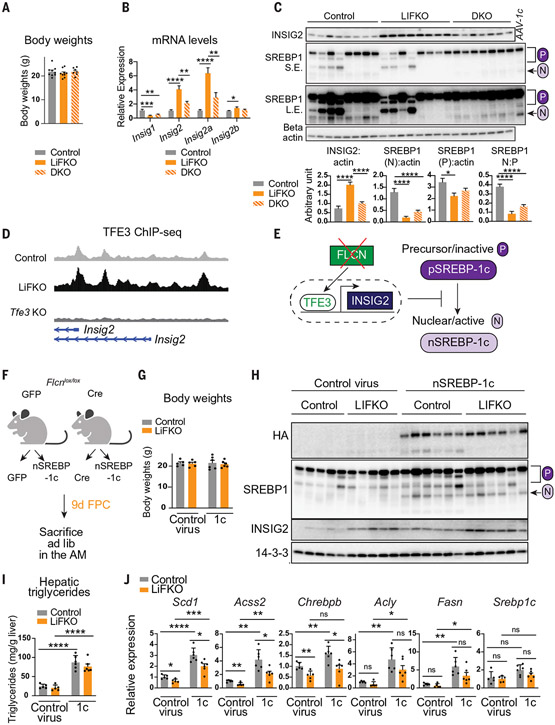
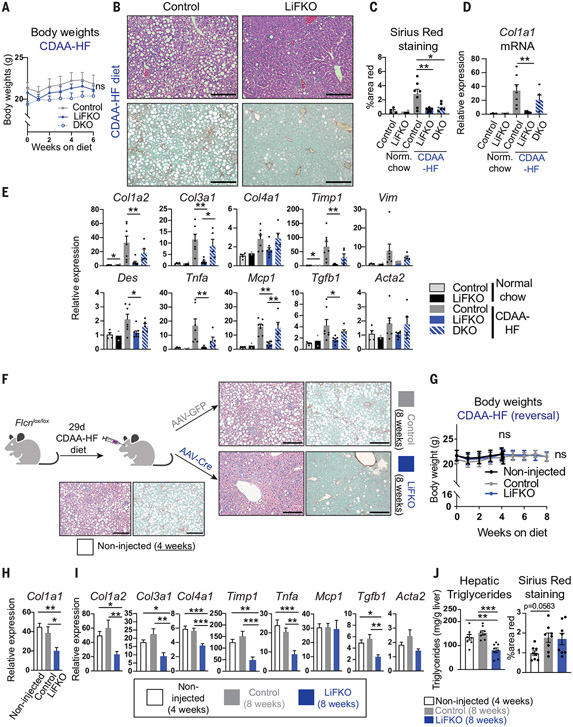
Nonalcoholic fatty liver disease (NAFLD) and nonalcoholic steatohepatitis (NASH) remain without effective therapies. The mechanistic target of rapamycin complex 1 (mTORC1) pathway is a potential therapeutic target, but conflicting interpretations have been proposed for how mTORC1 controls lipid homeostasis. We show that selective inhibition of mTORC1 signaling in mice, through deletion of the RagC/D guanosine triphosphatase-activating protein folliculin (FLCN), promotes activation of transcription factor E3 (TFE3) in the liver without affecting other mTORC1 targets and protects against NAFLD and NASH. Disease protection is mediated by TFE3, which both induces lipid consumption and suppresses anabolic lipogenesis. TFE3 inhibits lipogenesis by suppressing proteolytic processing and activation of sterol regulatory element-binding protein-1c (SREBP-1c) and by interacting with SREBP-1c on chromatin. Our data reconcile previously conflicting studies and identify selective inhibition of mTORC1 as a potential approach to treat NASH and NAFLD.


Figures

Fig. 1.
Fig. 1.. Liver FLCN selectively promotes mTORC1-mediated cytoplasmic sequestration of TFE3, without affecting canonical mTORC1 signaling.
(A and B) Model of selective mTORC1 regulation. P, phosphorylated; PRAS40, proline-rich AKT substrate of 40 kDa; DEPTOR, DEP domain-containing mTOR-interacting protein; mLST8, target of rapamycin complex subunit LST8. (C) Schematic of FLCN liver deletion to yield control and hepatocyte-specific Flcn-null (LiFKO) mice. (D) FLCN protein expression in livers of control and LiFKO mice fed normal chow and euthanized after overnight fast followed by 4 hours of refeeding. HSP90, heat shock protein 90. (E) TFE3 protein expression in the indicated subcellular fractions from livers of control, LiFKO, and Tfe3 knockout mice fed normal chow and euthanized ad lib. S.E., short exposure; L.E., long exposure; H3, histone H3. (F) TFE3 protein expression in the nucleus from livers of control (Con.) and Raptor liver-KO mice, euthanized after overnight fasting and 4 hours of refeeding. See fig. S1A for whole cell and cytoplasmic fractions. p:total, fraction of phosphorylated protein to total protein. (G and H) Phosphorylation of mTORC1 targets in control and LiFKO mice fed either (G) normal chow or (H) 7 or 8 days of FPC diet (TD190142) and sugar water, and euthanized after overnight fast and ~4 hours of refeeding. pS6 240/4, phospho-ribosomal protein S6 (Ser240/244); S6, ribosomal protein S6; p4E-BP1 S65, phospho-4E-BP1 (Ser65); p4E-BP1 Th37, phospho-4E-BP1 (Thr37). (I) Phosphorylation of Lipin1, assayed by immunoprecipitation (IP) with anti-Lipin1 followed by immunoblotting for phospho-Lipin1, in liver lysates of control and LiFKO mice fed 9 days of FPC diet (TD190142) and sugar water and euthanized at 10 p.m. ad lib. IgG, immunoglobulin G. (J) TFE3 protein expression in the indicated subcellular fractions from control and liver Tsc1 KO mice fed normal chow and euthanized ad lib. *P < 0.05, **P < 0.01; Student’s two-tailed t test. Data are depicted as mean ± SEM.
Fig. 2.
Fig. 2.. Loss of FLCN in the liver potently protects against NAFLD, and the protection requires TFE3.
(A to E) Control, LiFKO, and DKO mice were fed a normal chow (n = 7) or AMLN diet (n = 3 to 9) for 17 to 18.5 weeks and euthanized after a 4- to 6-hour fast. (A) Body weights on normal chow. (B) Representative images of liver H&E staining. Scale bars, 500 μm. (C) Body weights on AMLN diet. (D) Quantification of liver triglycerides. (E) Blinded histological evaluation of liver H&E slides. (F to J) Control, LiFKO, Tfe3 KO, and DKO mice were fed normal chow (n = 10 to 13) or FPC diet regimen (TD160785 with sugar water; n = 5 to 11) for 16 weeks and euthanized after removing their food for 4 to 6 hours. (F) Body weights on normal chow. (G) Representative images of liver H&E staining. Scale bars, 200 μm. (H) Body weights on FPC diet. (I) Quantification of hepatic liver triglycerides. (J) Blinded histological evaluation of liver H&E slides. *P < 0.05, **P < 0.01, ***P < 0.001, ****P < 0.0001; ns, not significant. Statistical values are indicated for the final body weight measurement. Statistical analysis was done with two-way repeated measures or mixed effects analysis of variance (ANOVA) with multiple comparisons test in (A), (C), (F), and (H). Student’s two-tailed t test was used for normal chow controls for the AMLN diet experiment. One-way ANOVA with Tukey’s multiple comparisons test was used otherwise. Data are depicted as mean ± SEM.
Fig. 3.
Fig. 3.. Loss of FLCN in the liver activates pathways of lipid catabolism.
(A to C) RNA-seq was performed on the livers of control, LiFKO, and DKO mice (n = 3) on normal chow or AMLN diet (as described in Fig. 2). (A) −Log10(adjusted p-value) versus log2(LiFKO/control fold change) volcano plot. Dotted line: P = 0.05. (B) Heatmap of normalized expression of mitochondrial and lysosomal gene sets. (C) Top 10 differentially expressed gene sets between LiFKO and control livers. Red indicates pathways up-regulated in LiFKO, blue indicates pathways down-regulated in LiFKO. (D) Protein expression of components of mitochondrial electron transport chain complexes (C.I, C.II, C.III, and C.V), LC3B-I and LCSB-II, p62, and HSP90, in livers of control, LiFKO, and DKO mice fed an FPC diet regimen (TD160785 with sugar water) for 16 weeks. (E) mRNA expression of Ppargc1a and Ppargc1b in livers of control, LiFKO, and DKO mice fed a normal chow (n = 7) or AMLN diet (n = 3 to 9) for 17 to 18.5 weeks. (F) Genome browser tracks of the Ctsz and Ppargc1a promoters. TFE3 ChIP-seq was performed on livers of mice fed normal chow (n = 2 to 4). Depicted are tracks from one representative sample per genotype. Green indicates publicly available ENCODE liver ChIP-seq datasets. (G) Hepatocytes were isolated from three control and LiFKO mice and pooled. Fatty acid oxidation was measured from three or four wells of each genotype by incubating them with 3H-palmitate for 120 min and either vehicle or 100 μM etomoxir (an inhibitor of fatty acid oxidation). Conversion of 3H-palmitate to 3H2O was measured by scintillation counting and normalized to cell count. dpm, disintegrations per minute. One-way ANOVA with Tukey’s multiple comparisons test (for three groups) or Student’s two-tailed t test (for two groups) was used. *P < 0.05, **P < 0.01, ***P < 0.001, ****P < 0.0001. Data are depicted as mean ± SEM.
Fig. 4.
Fig. 4.. Loss of FLCN in the liver suppresses de novo lipogenesis.
(A) Heatmap of normalized expression values of de novo lipogenesis genes from RNA-seq described in Fig. 3. (B and C) mRNA expression of de novo lipogenesis genes in livers of control, LiFKO, Tfe3 KO, and DKO mice fed (B) an AMLN diet (n = 3 to 9) for 17 to 18.5 weeks or (C) an FPC diet regimen (TD160785 with sugar water; n = 5 to 11) for 16 weeks. (D) Protein expression of SREBP1, ACLY, ACSS2, and FASN in livers from control, LiFKO, and DKO mice fed an FPC diet regimen (TD160785 with sugar water) for 16 weeks. HSP90 from Fig. 3D was used as loading control. Mice were euthanized after a 4- to 6-hour fast, and thus only the precursor form of SREBP1 was detected. (E) Control, LiFKO, and DKO mice (n = 6 or 7) were fed an AMLN diet for 7 to 11 days, fasted from 9 a.m. to 7 p.m., refed for 2 hours, and force-fed a bolus of 13C-fructose and 12C-glucose. The mice were fed overnight and killed the next morning. LC-MS was performed to examine the amount of 13C label incorporation into hepatic fatty acids. (F) Control, LiFKO, and DKO mice (n = 9 to 11) were fed an FPC diet regimen (TD190142 with sugar water) for 9 days and then injected intraperitoneally (i.p.) with deuterium oxide (2H2O) at ~7 p.m. Five hours later, the mice were killed, and their livers harvested. LC-MS was performed to examine the amount of deuterium label incorporation into hepatic fatty acids. *P < 0.05, **P < 0.01, ***P < 0.001, ****P < 0.0001; one-way ANOVA with Tukey’s multiple comparisons test. Data are depicted as mean ± SEM.
Fig. 5.
Fig. 5.. TFE3 suppresses SREBP-1c proteolytic processing and activation.
(A to D) Control, LiFKO, and DKO mice were fed an FPC diet regimen (TD190142 with sugar water) for 9 days and euthanized at 10 p.m. ad lib (n = 7 to 9). One-way ANOVA with Tukey’s multiple comparisons test was used. (A) Body weights. (B) mRNA expression of DNL genes. (C) Liver protein expression of SREBP-1, INSIG2, and beta actin. AAV-1c, positive control from liver injected with AAV8 expressing constitutively nuclear SREBP-1c; P, precursor form of SREBP-1; N, nuclear (processed) form of SREBP-1. (D) Genome browser tracks of the Insig2 promoter. Depicted are TFE3 ChIP-seq tracks (described in Fig. 3F) from one representative sample per genotype. (E) Schematic of FLCN:TFE3 regulation of SREBP-1c proteolytic processing. (F to J) Flcnlox/lox mice (n = 5 or 6) were injected with either “control virus” (AAV8-GFP or AAV8-Cre; to generate control or LiFKO mice) or AAV8-ApoE/AAT-HA-nSREBP-1c (“1c”) and then maintained for 9 days on an FPC diet (TD190142 with sugar water). Student’s two-tailed t test was used for analysis. (F) Experimental outline. (G) Body weights. (H) Liver protein expression of exogenous HA-tagged nuclear SREBP-1c (HA), total SREBP-1, INSIG2, and 14-3-3. (I) Hepatic triglyceride quantification. (J) Liver mRNA expression of indicated DNL genes. *P < 0.05, **P < 0.01, ***P < 0.001, ****P < 0.0001. Data are depicted as mean ± SEM.
Fig. 6.
Fig. 6.. Loss of FLCN in the liver prevents and reverses NASH.
(A to E) Prevention of NASH. Control, LiFKO, and DKO mice were maintained on normal chow (n = 2 to 4) or CDAA-HF diet (n = 5 to 8) for 6 weeks and then euthanized after a 4- to 6-hour fast. (A) Weekly body weights. (B) Representative images of liver H&E and Sirius Red staining of mice fed CDAA-HF diet. (C) Quantification of Sirius Red positive staining. [(D) and (E)] Liver mRNA expression of the indicated fibrosis and inflammation markers. (F to J) Reversal of NASH. (F) Experimental outline. Flcnlox/lox mice were fed a CDAA-HF diet for 29 days to induce NASH, at which time “non-injected” mice were euthanized (n = 8). The remaining mice were injected with AAV8-TBG-GFP or AAV8-TBG-Cre to yield control and LiFKO mice (n = 8 in each group), and subsequently maintained for another 4 weeks on a CDAA-HF diet. Representative liver H&E and Sirius Red images depicted for each group. (G) Weekly body weights. [(H) and (I)] Liver mRNA expression of the indicated fibrosis and inflammation markers. (J) Quantification of hepatic liver triglycerides and Sirius Red positive staining. Two-way repeated measures ANOVA with multiple comparisons test were used in (A) and (G). One-way ANOVA with Tukey’s multiple comparisons test was used to assess differences between CDAA-HF–fed control, LiFKO, and DKO mice [(C) to (E)] or noninjected, control, and LiFKO mice [(H) to (J)]. Student’s two-tailed t test was used to compare control and LiFKO mice on normal chow. *P < 0.05, ** P < 0.01, *** P < 0.001, ****P < 0.0001. Scale bars, 200μm. Data are depicted as mean ± SEM.

Comment in

References

    1. Rinella ME, Nonalcoholic fatty liver disease: A systematic review. JAMA 313, 2263–2273 (2015). doi: 10.1001/jama.2015.5370 - DOI - PubMed
    1. Schuster S, Cabrera D, Arrese M, Feldstein AE, Triggering and resolution of inflammation in NASH. Nat. Rev. Gastroenterol. Hepatol 15, 349–364 (2018). doi: 10.1038/s41575-018-0009-6 - DOI - PubMed
    1. Schwabe RF, Tabas I, Pajvani UB, Mechanisms of fibrosis development in nonalcoholic steatohepatitis. Gastroenterology 158, 1913–1928 (2020). doi: 10.1053/j.gastro.2019.11.311 - DOI - PMC - PubMed
    1. Sheka AC et al., Nonalcoholic steatohepatitis: A review. JAMA 323, 1175–1183 (2020). doi: 10.1001/jama.2020.2298 - DOI - PubMed
    1. Kawano Y, Cohen DE, Mechanisms of hepatic triglyceride accumulation in non-alcoholic fatty liver disease. J. Gastroenterol 48, 434–441 (2013). doi: 10.1007/s00535-013-0758-5 - DOI - PMC - PubMed

MeSH terms

Substances