. 2022 May 18;13(5):408-425.e12.
doi: 10.1016/j.cels.2022.03.001. Epub 2022 Apr 13.

Ligand-receptor promiscuity enables cellular addressing

Affiliations

Ligand-receptor promiscuity enables cellular addressing

Christina J Su et al. Cell Syst. .

Abstract

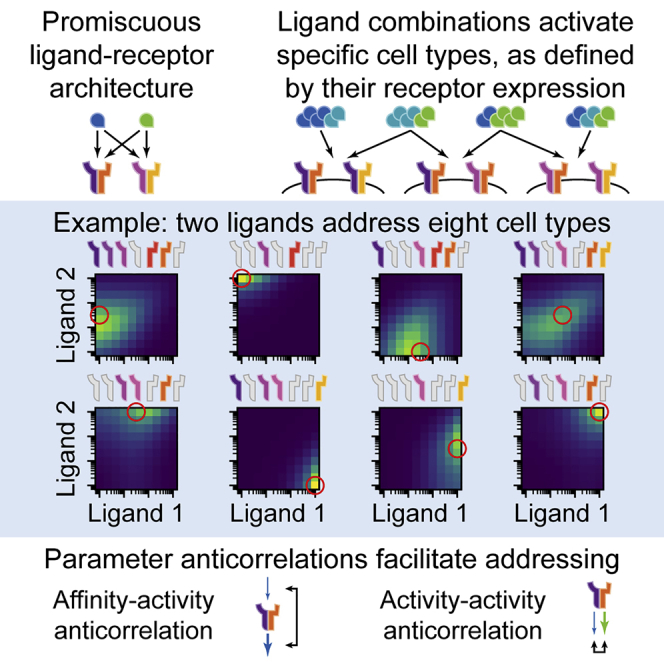
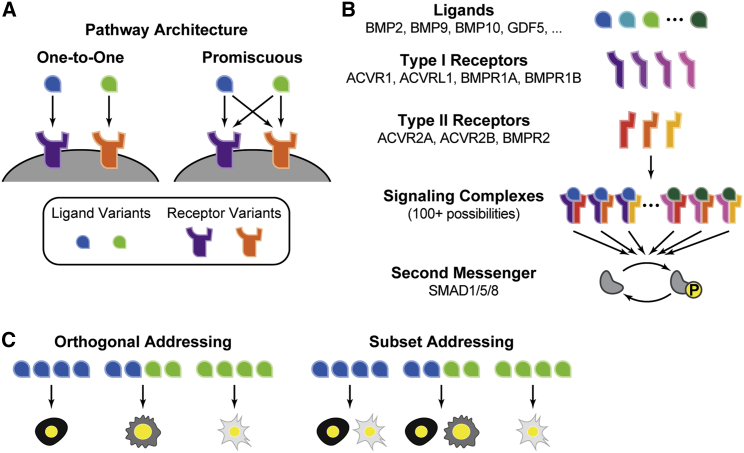
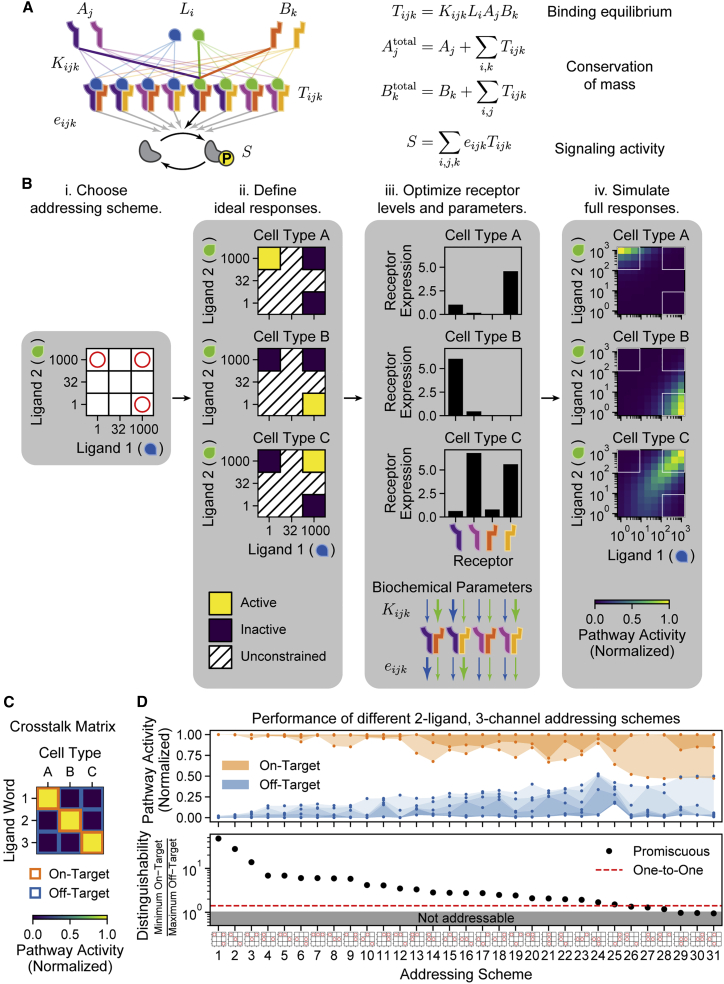
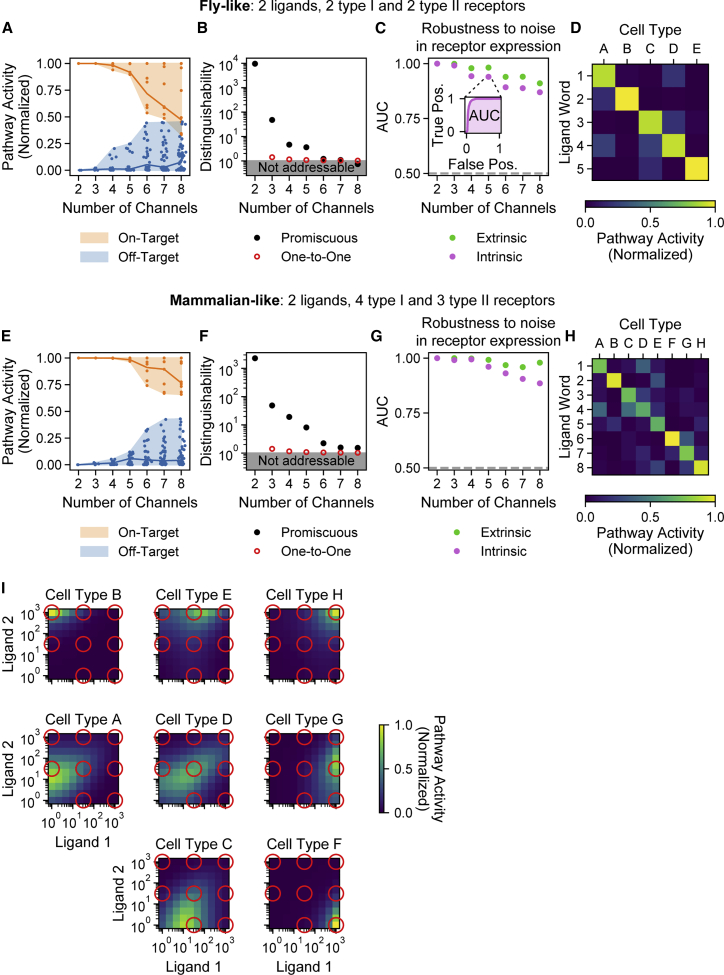
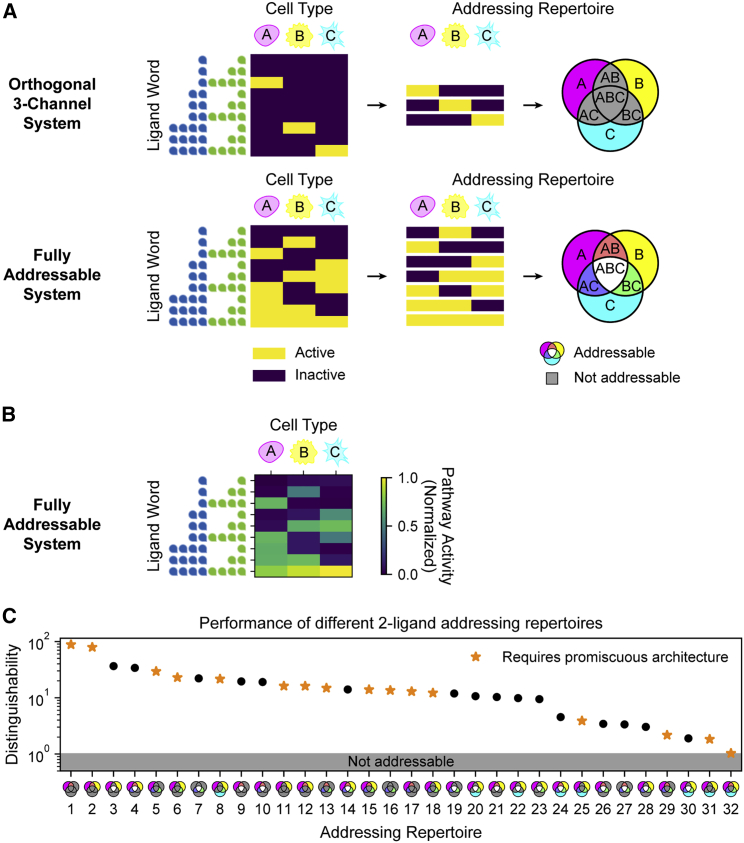
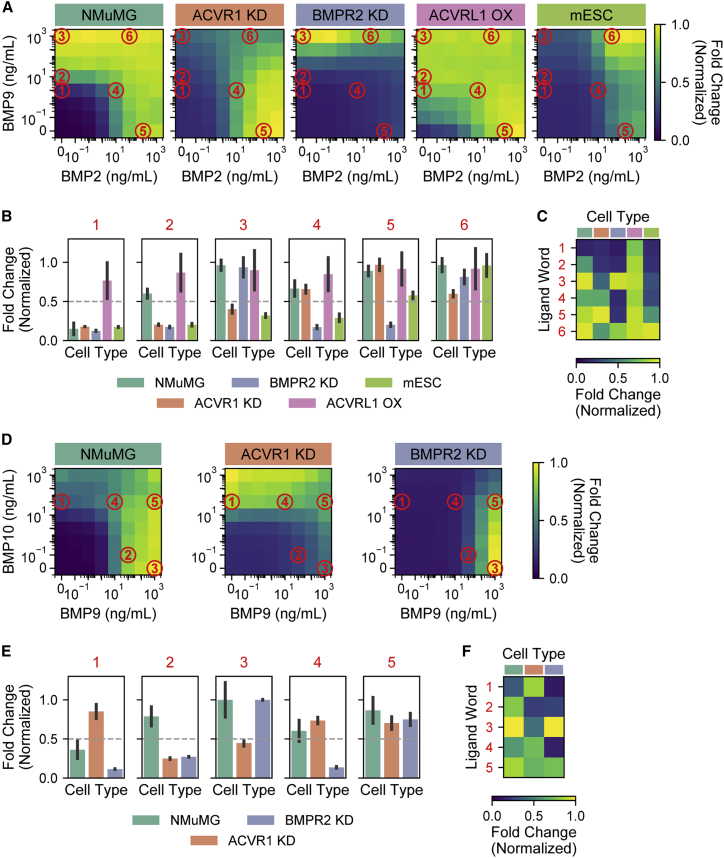
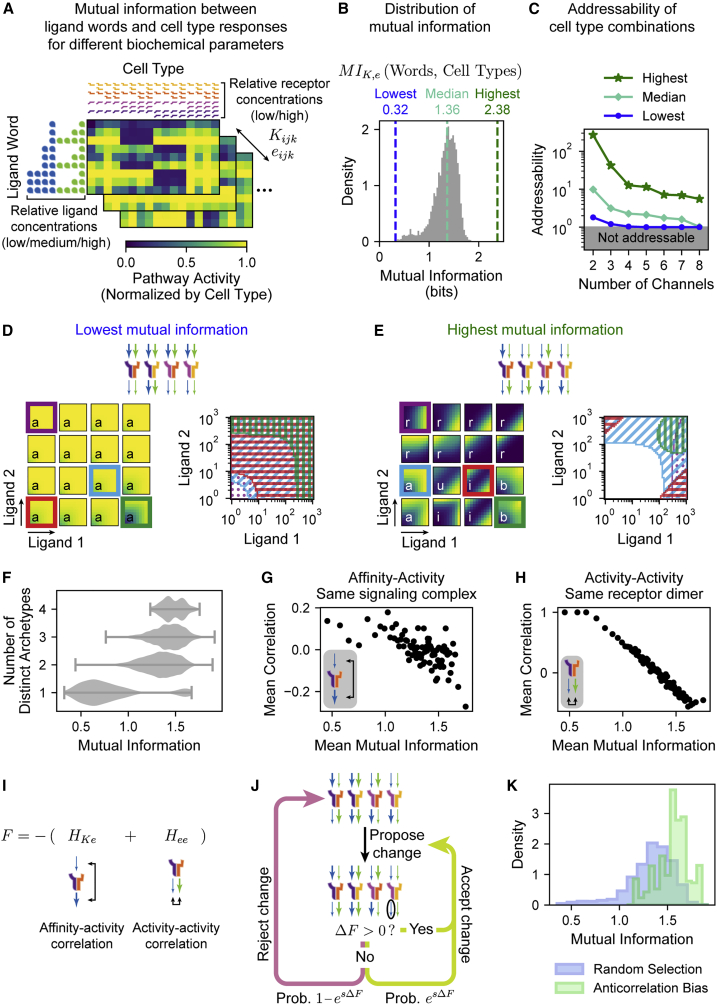
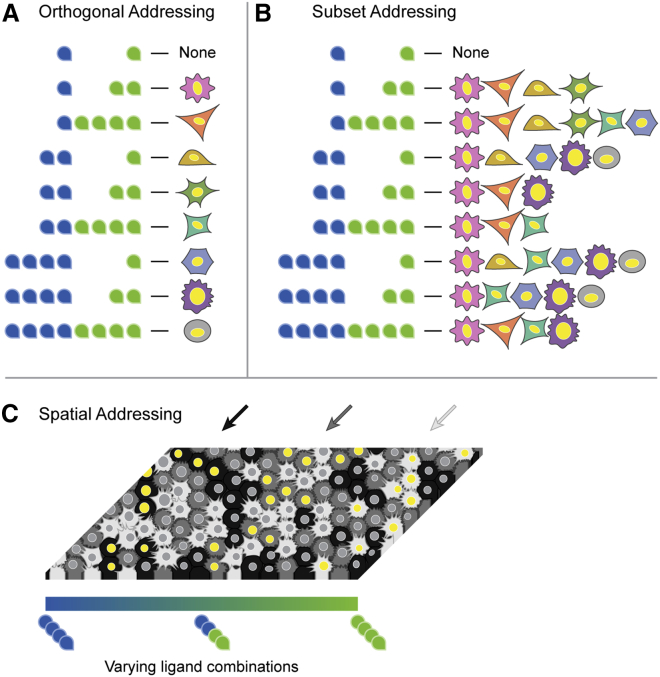
In multicellular organisms, secreted ligands selectively activate, or "address," specific target cell populations to control cell fate decision-making and other processes. Key cell-cell communication pathways use multiple promiscuously interacting ligands and receptors, provoking the question of how addressing specificity can emerge from molecular promiscuity. To investigate this issue, we developed a general mathematical modeling framework based on the bone morphogenetic protein (BMP) pathway architecture. We find that promiscuously interacting ligand-receptor systems allow a small number of ligands, acting in combinations, to address a larger number of individual cell types, defined by their receptor expression profiles. Promiscuous systems outperform seemingly more specific one-to-one signaling architectures in addressing capability. Combinatorial addressing extends to groups of cell types, is robust to receptor expression noise, grows more powerful with increases in the number of receptor variants, and is maximized by specific biochemical parameter relationships. Together, these results identify design principles governing cellular addressing by ligand combinations.

Keywords: BMP; bone morphogenetic protein; cell-type specificity; combinatorial signaling; communication systems; information theory; ligand-receptor interactions; promiscuity; signal processing; signaling pathways.


Conflict of interest statement

Declaration of interests C.J.S. is presently at the University of Illinois College of Medicine. H.K. is currently at the Department of Biomedical Engineering at Boston University. The authors have a patent related to this work (U.S. patent number 10,527,631).

Figures

None
Graphical abstract
Figure 1
Figure 1
Promiscuous ligand-receptor interactions in the BMP pathway may allow combinatorial addressing (A) In a one-to-one ligand-receptor architecture (left), each ligand interacts exclusively with a single receptor, whereas in a promiscuous architecture (right), ligands interact with multiple receptor variants. (B) In this simplified schematic of the BMP pathway, ligands interact combinatorially with type I and type II receptors at the cell membrane to form signaling complexes, which then activate SMAD1/5/8 effector proteins. (C) Signaling pathways could enable different forms of addressing. In orthogonal addressing (left), different combinations of ligands each activate a distinct cell type. More generally, subset addressing (right) could allow the activation of different groups of cell types by different ligand combinations.
Figure 2
Figure 2
A mathematical model of promiscuous ligand-receptor interactions allows systematic optimization of addressing capabilities (A) A minimal model of the BMP signaling pathway includes ligand variants (Li, blue and green), which interact with type I receptors (Aj, purple and pink) and type II receptors (Bk, orange and yellow) to form a combinatorial set of trimeric signaling complexes (Tijk) with varying affinities (Kijk). Active signaling complexes phosphorylate the SMAD effector with varying efficiencies (eijk). Equations describe the steady-state levels of each component and the total signal S (STAR Methods: One-step model for promiscuous interactions). (B) Optimization systematically identifies potential combinatorial addressing schemes in four steps. (i) An orthogonal addressing scheme is specified as orthogonal activation by a set of desired ligand words (red circles). Discretization of ligand space (3 × 3 grid) enables the enumeration of all such addressing schemes. (ii) A given orthogonal addressing scheme can be translated into target response functions in which each cell type is activated by exactly one ligand word (yellow) and not by others (blue). Responses to other ligand words (hatched) are unconstrained. (iii) Least-squares optimization identifies a global set of affinity (Kijk) and efficiency (eijk) parameters, along with a set of receptor expression levels for each cell type, which yield responses similar to the target functions. Upper and lower arrows represent affinity and activity parameters, respectively, for each receptor dimer complexed with each of the two ligands (blue and green arrows). Thin and thick arrows correspond to low and high values, respectively. (iv) Responses can be simulated at higher resolution for visualization and further analysis. (C) After optimization, the crosstalk matrix represents the responses of each cell type at the selected ligand words (orthogonal channels). For orthogonal addressing, this matrix should ideally be diagonal, with each ligand word activating only its target cell type (orange border) with no off-target activation (blue border). (D) Best optimization results are shown for all 31 possible three-channel orthogonal addressing schemes (STAR Methods: Enumeration of orthogonal addressing schemes). (Top) Distributions of on-target (orange) and off-target (blue) activation levels are plotted, representing all elements in the crosstalk matrix. Shaded regions span all activity values. (Bottom) The corresponding distinguishability value for each addressing scheme is shown (black). Distinguishability values below 1 (gray region) indicate that the corresponding scheme cannot be successfully addressed. For comparison, the best distinguishability achieved in a one-to-one architecture is shown (red). Addressing schemes (x axis) are shown in order of decreasing distinguishability. See also Figures S1 and S2.
Figure 3
Figure 3
Two ligand variants can independently address eight cell types with high specificity and robustness (A) In the fly-like model with two type I and two type II receptor subunits, the pathway activities of each cell type in response to each ligand word (y axis) are plotted for varying numbers of channels (x axis), using the optimal parameters for each bandwidth. Shaded regions span full distribution of on-target (orange) and off-target (blue) activities, and lines indicate median values. (B) Distinguishability values are plotted for each number of channels (black), together with the optimal values achieved for the same bandwidths in a one-to-one architecture (red). The five-channel system is further analyzed in (D). (C) Robustness to receptor expression fluctuations was evaluated for the top-performing system of each bandwidth. Optimized receptor expression levels were perturbed in a correlated or uncorrelated way to represent, respectively, extrinsic (green) or intrinsic (purple) noise, with a coefficient of variation of 0.5. The resulting receiver operating characteristic (ROC) curves are computed by comparing true and false positive rates for classifying on- and off-target values at different thresholds (inset), and the corresponding area under the curve (AUC) values are plotted for each bandwidth. A perfect classifier has AUC 1, and a random classifier has AUC 0.5 (gray dashed line). (D) The crosstalk matrix shows the response of each cell type at each ligand word of interest for the five-channel example from (A)–(C). Perfect orthogonal specificity would yield a diagonal matrix. (E)The pathway activities for a mammalian-like model with four type I and three type II receptors are shown, as in (A). (F) As in (B), distinguishability values are plotted for the mammalian-like model from (E) (black), along with the optimal values achieved for the same bandwidths in a one-to-one architecture (red). The eight-channel system is further analyzed in (H) and (I). (G) AUC values for the top parameter set of each bandwidth are shown, as in (C). (H) The crosstalk matrix for the eight-channel system in the mammalian-like model is shown, as in (D). (I) The full responses of each cell type are shown for the eight-channel system analyzed in (H). Red circles correspond to the eight ligand words, and cell types are spatially arranged according to the ligand word to which they preferentially respond. For example, the bottom right cell type (cell type F) is orthogonally activated by high levels of ligand 1 only, whereas the top right cell type (cell type H) would be activated by combining high levels of ligand 1 and 2 together. The bottom left ligand word, with low levels of both ligands, is non-activating and, therefore, omitted. See also Figures S3–S5.
Figure 4
Figure 4
Promiscuous architecture enables diverse addressing repertoires (A) For different parameter sets, the responses of three cell types (A, magenta; B, yellow; and C, cyan) to a titration of two ligands (blue and green) are shown (left). Unique rows reveal the subsets of cell types that can be activated across all ligand words (center). Addressable subsets can also be represented as a Venn diagram (right), where colored regions represent subsets that are activated by at least one ligand combination and gray regions represent subsets that cannot be addressed by any ligand combination. These subsets constitute the “addressing repertoire” of a system. Addressing capability can vary widely. Examples include purely orthogonal activation (top) and all possible subsets (bottom). (B) We optimized parameters to achieve the fully addressable system of (A). Simulating the responses of the three cell types to each ligand word confirms that any of the seven possible subsets can be successfully addressed. (C) We generalized the optimization approach to identify parameters achieving each possible addressing repertoire of three cell types in a mammalian-like model with four type I and three type II receptors. The optimal distinguishability value for each repertoire is plotted. Orange stars indicate addressing repertoires that cannot be achieved in the one-to-one architecture (STAR Methods: Subset addressing in one-to-one model).
Figure 5
Figure 5
Cell lines preferentially respond to different ligand combinations (A) Responses were measured for, from left to right, NMuMG cells, NMuMG cells with ACVR1 knockdown (KD), NMuMG cells with BMPR2 KD, NMuMG cells with ACVRL1 overexpression (OX), and mESCs, using flow cytometry of an integrated fluorescent protein reporter (STAR Methods: Addressing of cell lines). Each cell line was exposed to a double titration of BMP2 and BMP9, and responses were quantified by taking the mean of at least 3 replicates. For each cell line, fold change is calculated relative to the baseline fluorescence with no added ligand and then normalized by the maximum value. Responses at select ligand words (red circles) are analyzed further in (B). (B) For select ligand words from (A), the responses of each cell line are shown. Error bars indicate SD of at least 3 repeats. Ligand words were chosen by fixing a threshold of 0.5 (gray dashed line) and identifying those ligand combinations yielding unique on- and off-target activation patterns. (C) Data from (B) are summarized by showing the response of each cell type (columns) to each ligand word (rows), illustrating that distinct ligand words can activate different subsets of cell types. (D) Responses of NMuMG, NMuMG with ACVR1 KD, and NMuMG with BMPR2 KD to BMP9 and BMP10 are shown, as in (A). (E) As in (B), the responses of each cell type at selected ligand words are shown. (F) As in (C), the responses of each cell type (columns) to each ligand word (rows) confirm that distinct ligand words preferentially activate distinct groups of cell types. See also Table S1.
Figure 6
Figure 6
Information theoretic analysis reveals design principles for combinatorial addressing (A) Mutual information between a comprehensive library of ligand words (rows) and the corresponding activation patterns across a library of cell types (columns) can be computed across a systematic grid-based sampling of the biochemical parameters K and e (matrices). For each row, one, two, and four ligand symbols indicate low (100), medium (101.5), or high (103) concentrations of the indicated ligand. Similarly, one or two receptor symbols indicate low (1) or high (100) levels of the indicated receptor for each column. (B) The distribution of mutual information across biochemical parameters is shown. Dashed lines indicate the lowest (blue), median (cyan), and highest (green) values. High mutual information indicates that many distinct cell-type combinations can be specifically activated by distinct ligand words. (C) The addressability values of the activated subsets are shown for different numbers of channels. The addressability reflects the minimal fold difference in the response of at least one cell type when exposed to any two distinct ligand words (STAR Methods: Addressability of ligand words). Results are shown for three sets of biochemical parameters generating the lowest, median, and highest mutual information values. (D) The parameter set with the lowest mutual information is represented schematically (top), as in Figure 2Biii. For these parameters, the responses for the library of 16 cell types are shown as a 4 × 4 grid (bottom left). In each response, the x and y axes represent logarithmic titrations of ligands 1 and 2, respectively. All show the same qualitative response of additive (“a”) behavior, differing only in their quantitative sensitivity. Schematically, overlaying four differing responses (highlighted in purple, cyan, red, and green) reveals that different ligand words largely address similar combinations of cell types (bottom right), with relatively few distinct subsets represented. (E) For the parameter set with the highest mutual information (top), the cell types in the library show a variety of response patterns (bottom left): ratiometric (“r”), additive (“a”), imbalance (“i”), and balance (“b”), matching the response archetypes (Figure S1) previously observed experimentally (Antebi et al., 2017). One response not fully matching any archetype is unclassified (“u”). Schematically, overlaying four differing responses (purple, cyan, red, and green) reveals that different ligand words can address many distinct subsets of cell types (bottom right). Note that complexes tend to have opposite values of affinity and activity parameters as well as other parameter anticorrelations, as analyzed in (G) and (H). (F) Violin plots indicate the distribution of mutual information values for systems with different numbers of distinct archetypes represented among individual cell response functions. Note that greater archetype diversity enriches for high mutual information. (G) Anticorrelation of affinity and activity parameters for the same complex is associated with higher mutual information. We analyzed average properties across bins of 800 parameter sets. To measure the correlation between affinity and activity of complexes, we represented low and high values as -1 and 1 and computed the dot product between K and e vectors. The average correlation and mutual information across bins are plotted. (H) Parameter sets with high mutual information show anticorrelation in the activities of complexes with the same receptor but different ligands. Analysis was done analogous to (G). (I) We defined a fitness function F that rewards parameter sets exhibiting the anticorrelations observed in (G) and (H). (J) An evolutionary algorithm identifies parameter sets that maximize F. At each iteration, a random parameter value is flipped from low to high or vice versa. Changes that increase F are accepted. Changes that decrease F are accepted with indicated probability (bottom), which depends on a selection pressure parameter s. This process is repeated iteratively (STAR Methods: Evolutionary algorithm as a generative model). (K) An evolutionary algorithm enriches for high mutual information. We ran the algorithm with s>0 to favor anticorrelations or with s=0 to randomly sample parameters. For each case, we randomly initialized 2,000 parameter sets and performed 200 iterations. We then evaluated the mutual information for the final value of the parameter set and visualized the resulting distributions. Random selection (s=0, blue) led to a similar distribution of values as the systematically sampled parameter sets (cf. Figure 6B), whereas favoring anticorrelations (s>0, green) resulted in an overall increase in mutual information. See also Figure S6.
Figure 7
Figure 7
Promiscuous ligand-receptor interactions allow flexible, high-bandwidth addressing (A) Promiscuous ligand-receptor interactions enable orthogonal addressing in which individual cell types can be specifically activated using combinations of only two different ligand variants (cf. Figures 3E–3I). (B) Promiscuous ligand-receptor interactions enable subset addressing in which different ligand words address diverse cell-type combinations (cf. Figure 6E). (C) This notional schematic shows how two antiparallel morphogen gradients could address different cell types (black, dark gray, and light gray) in specific spatial regions. Yellow nuclei indicate activation. In this example, high levels of blue ligand activate the black cell type (left), the combination of both ligands (blue and green) activates the dark gray cell type (center), and high levels of green ligand activate the light gray cell type (right).

Comment in

References

    1. Albilia J.B., Tenenbaum H.C., Clokie C.M.L., Walt D.R., Baker G.I., Psutka D.J., Backstein D., Peel S.A.F. Serum levels of BMP-2, 4, 7 and AHSG in patients with degenerative joint disease requiring total arthroplasty of the hip and temporomandibular joints. J. Orthop. Res. 2013;31:44–52. - PubMed
    1. Andrews M.G., del Castillo L.M., Ochoa-Bolton E., Yamauchi K., Smogorzewski J., Butler S.J. BMPs direct sensory interneuron identity in the developing spinal cord using signal-specific not morphogenic activities. eLife. 2017;6:e30647. - PMC - PubMed
    1. Antebi Y.E., Linton J.M., Klumpe H., Bintu B., Gong M., Su C., McCardell R., Elowitz M.B. Combinatorial signal perception in the BMP pathway. Cell. 2017;170:1184–1196.e24. - PMC - PubMed
    1. Axelrod J.D., Miller J.R., Shulman J.M., Moon R.T., Perrimon N. Differential recruitment of Dishevelled provides signaling specificity in the planar cell polarity and Wingless signaling pathways. Genes Dev. 1998;12:2610–2622. - PMC - PubMed
    1. Baur S.T., Mai J.J., Dymecki S.M. Combinatorial signaling through BMP receptor IB and GDF5: shaping of the distal mouse limb and the genetics of distal limb diversity. Development. 2000;127:605–619. - PubMed

Publication types

LinkOut - more resources