. 2022 Apr 25;57(8):1068-1080.e6.
doi: 10.1016/j.devcel.2022.03.013. Epub 2022 Apr 13.

Rapid and efficient degradation of endogenous proteins in vivo identifies stage-specific roles of RNA Pol II pausing in mammalian development

Affiliations

Rapid and efficient degradation of endogenous proteins in vivo identifies stage-specific roles of RNA Pol II pausing in mammalian development

Abderhman Abuhashem et al. Dev Cell. .

Abstract

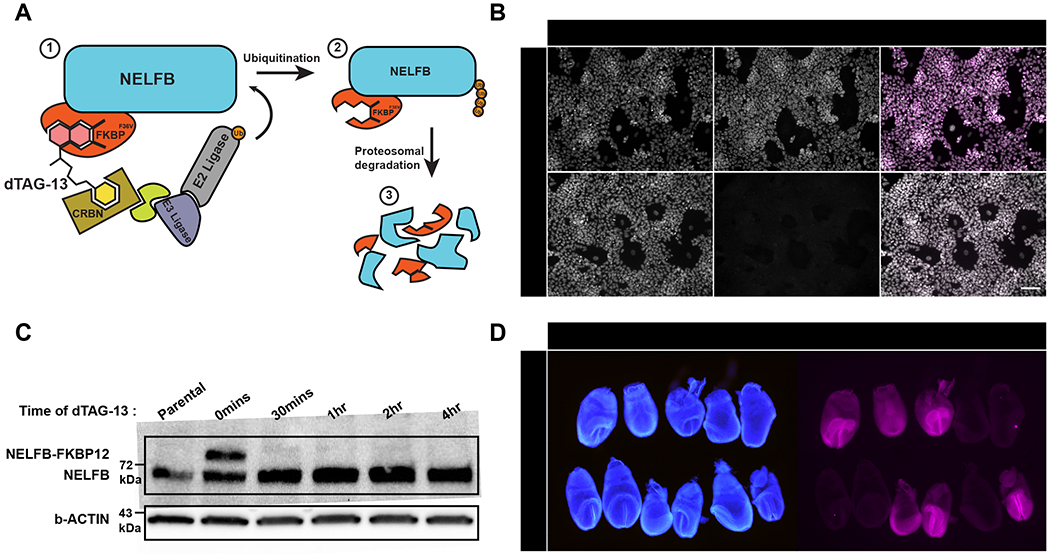
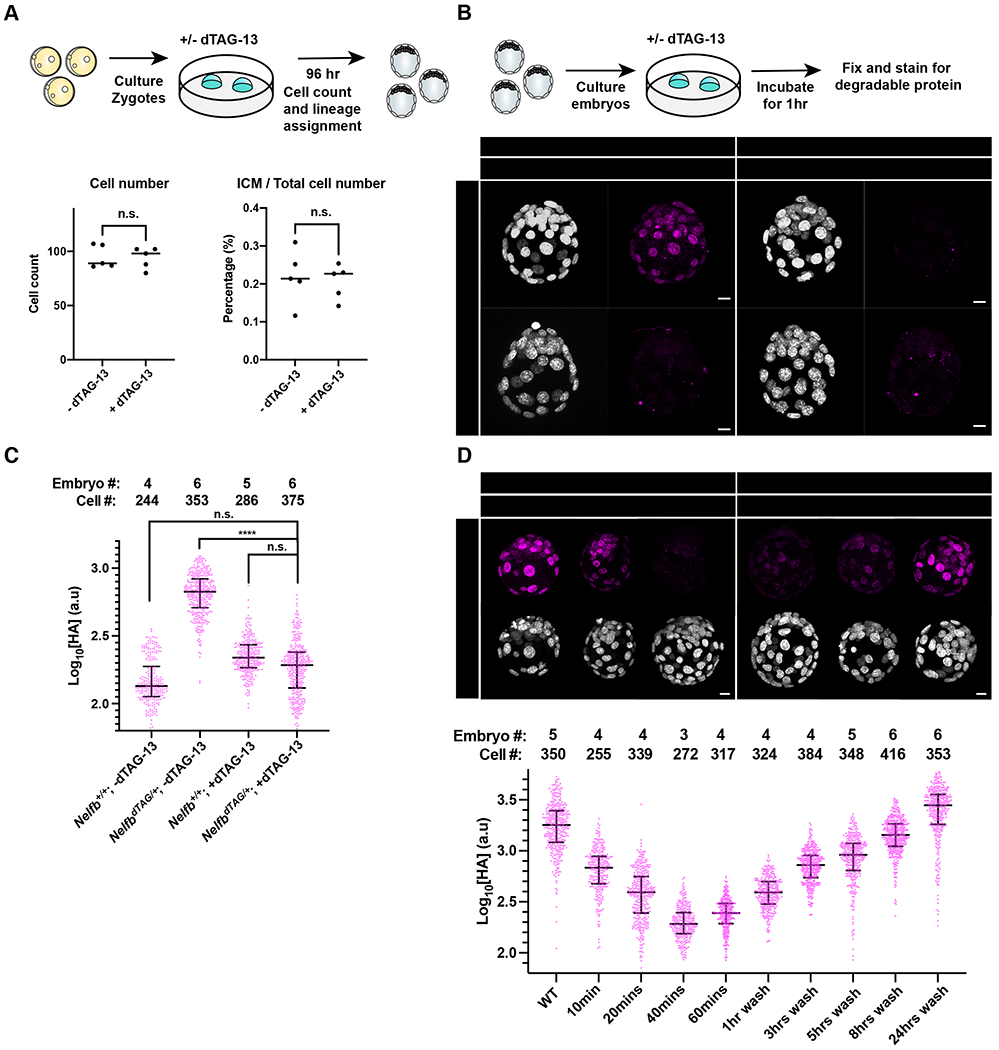
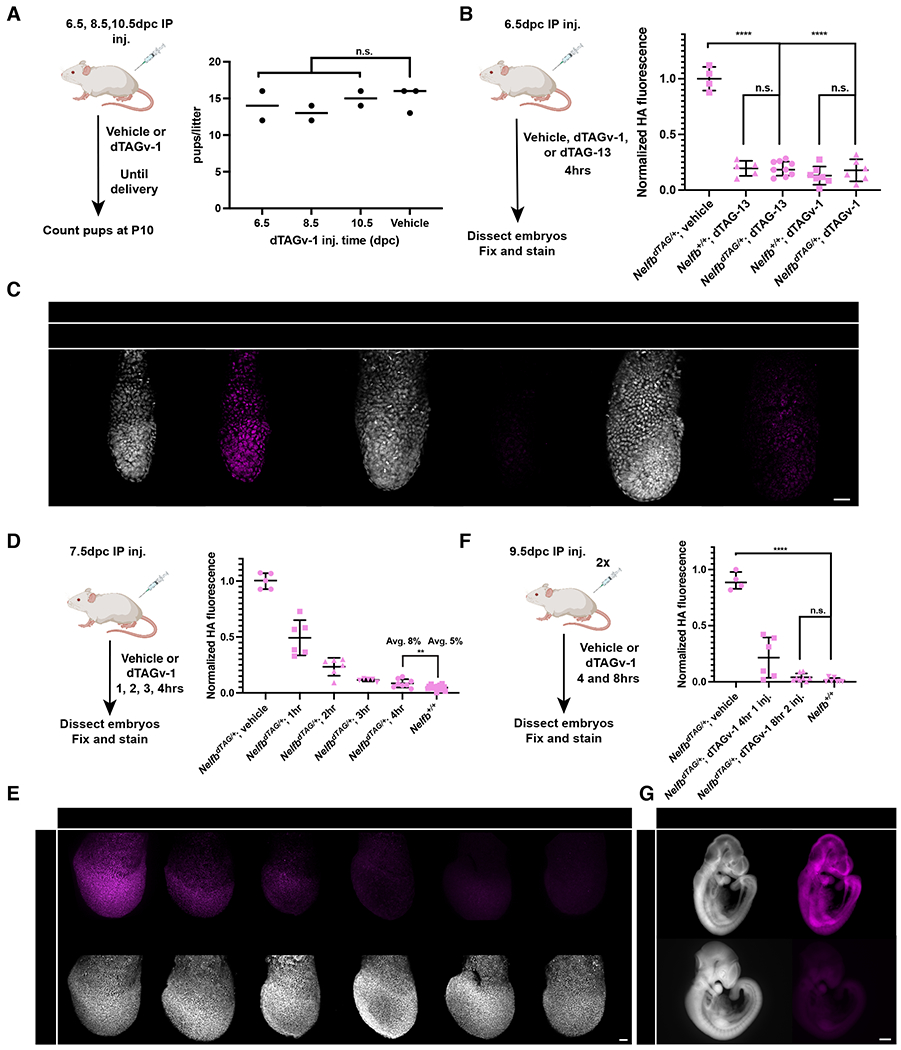
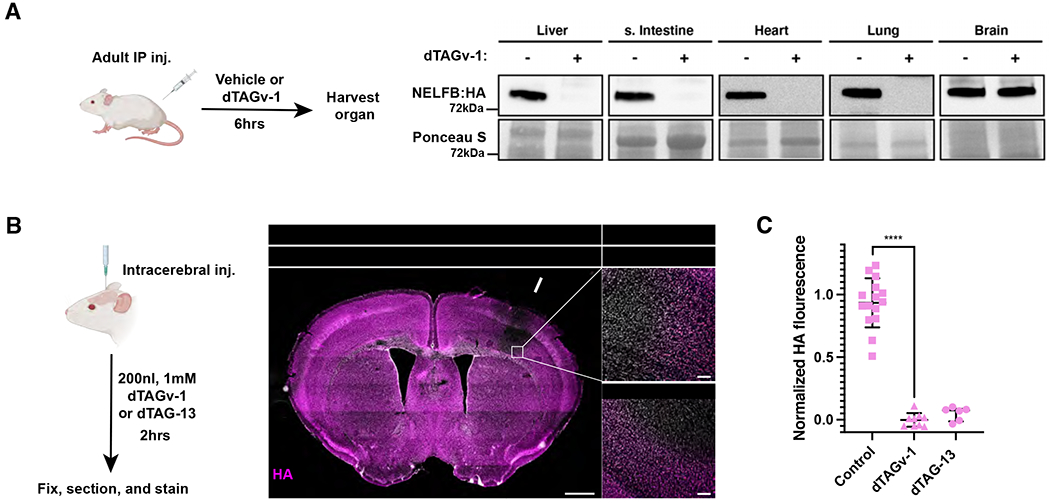
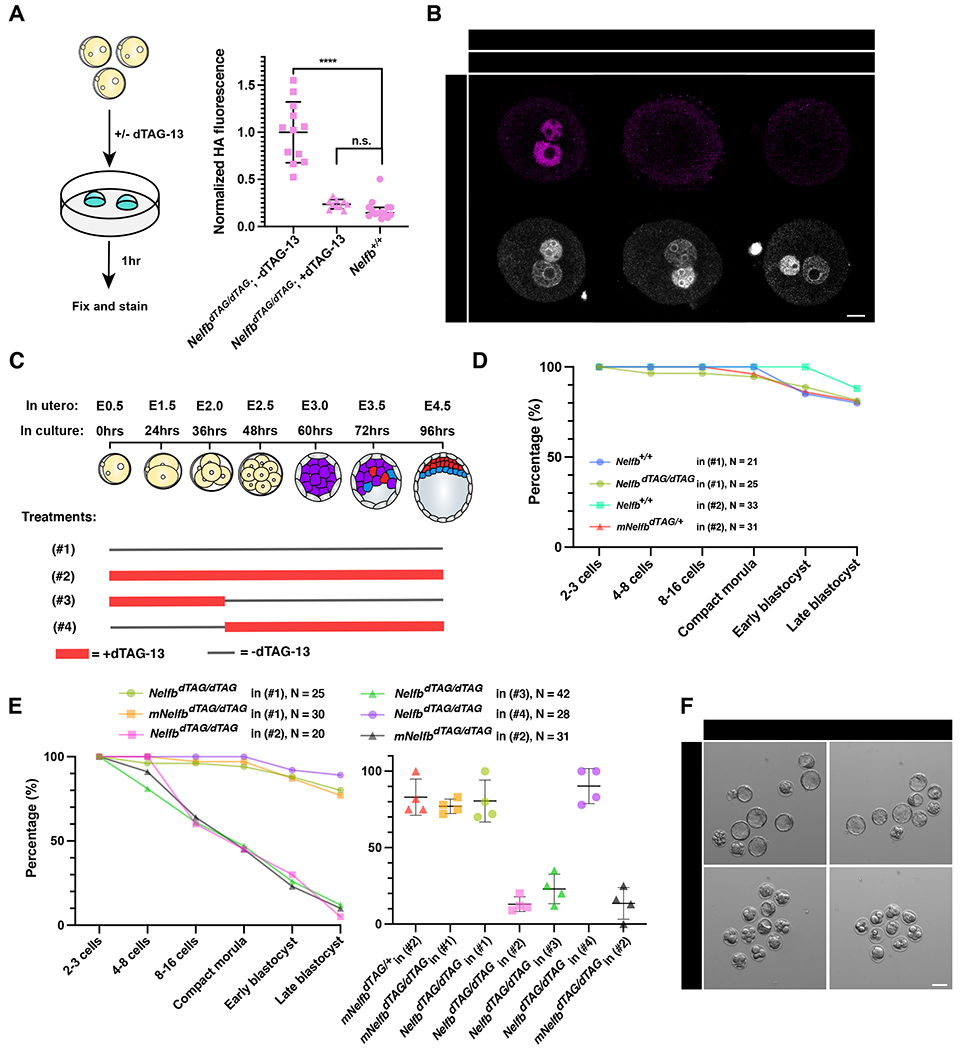
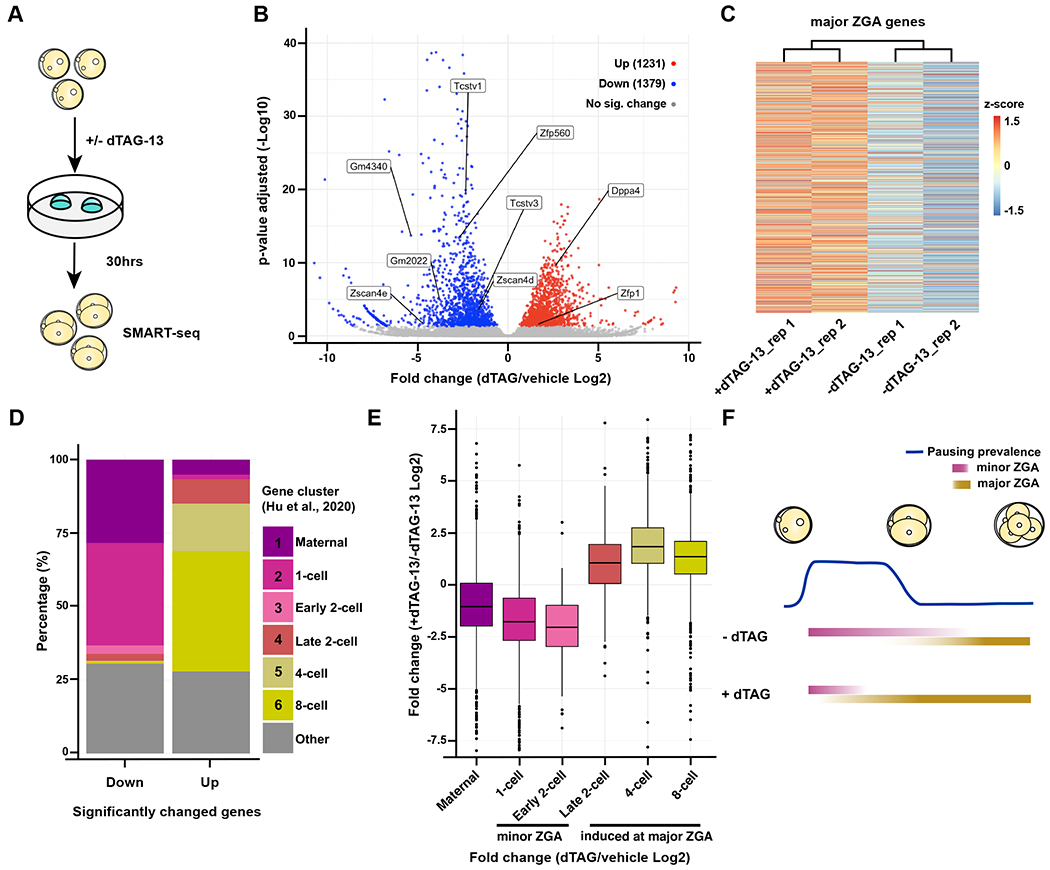
Targeted protein degradation methods offer a unique avenue to assess a protein's function in a variety of model systems. Recently, these approaches have been applied to mammalian cell culture models, enabling unprecedented temporal control of protein function. However, the efficacy of these systems at the tissue and organismal levels in vivo is not well established. Here, we tested the functionality of the degradation tag (dTAG) degron system in mammalian development. We generated a homozygous knock-in mouse with a FKBP12F36V tag fused to negative elongation factor b (Nelfb) locus, a ubiquitously expressed regulator of transcription. In our validation of targeted endogenous protein degradation across mammalian development and adulthood, we demonstrate that irrespective of the route of administration the dTAG system is non-toxic, rapid, and efficient in embryos from the zygote-to-mid-gestation stages. Additionally, acute depletion of NELFB revealed a specific role in zygote-to-2-cell development and zygotic genome activation (ZGA).

Keywords: NELF; ZGA; dTAG; degron; mouse embryo; pausing; post-implantation; pre-implantation; transcription; zygote.


Conflict of interest statement

Declaration of interests A.-K.H. is on the advisory board for Developmental Cell. All other authors have no competing interests to declare.

Figures

Figure 1.
Figure 1.
Generation of NelfbdTAG mouse model to study the dTAG system in vivo. (A) Schematic illustration of the proteasomal degradation in the dTAG system. The numbers represent the sequence of events from recognition of tag to degradation. (B) Immunofluorescence of targeted mESCs showing nuclear localized HA signal corresponding to NELFB +/− 500nM dTAG-13 treatment for 30 mins. Nuclei labeled with Hoechst. Scale bar, 70μm. (C) Western blot of targeted mES cells’ whole cell lysates +/− dTAG-13 treatment for indicated time intervals. Anti-NELFB antibody was used. 20ug of protein loaded/lane. (D) Immunofluorescence of a single E7.5 litter from a heterozygous NelfbdTAG/+ male and wild-type Nelfb+/+ female showing germline transmission of the targeted allele. Nuclei labeled with Hoechst. Scale bar, 500μm.
Figure 2.
Figure 2.
Establishing safety and efficiency of the dTAG system in pre-implantation stages. (A) (Top) Schematic representation of experimental design to test dTAG-13 safety in pre-implantation culture from zygote to blastocyst stages. (Bottom) Dot plots showing total cell counts (left) or percent ICM cells (right). Cell counts were determined following Hoechst staining and nuclei counting. ICM cells were identified via NANOG/GATA6 staining. Individual dots represent single embryos. Bars represent group means. (B) (Top) Schematic representation of experimental design to determine efficacy of tagged protein degradation. E3.5 blastocysts were cultured +/− 500nM dTAG-13 for 1hr prior to fixation and immunostaining. (Bottom) Immunofluorescence of HA to determine degradation of tagged protein. Nuclei labeled with Hoechst. Total cell count per embryo is shown in the top left corner. Scale bar, 10μm. (C) Quantification of mean HA signal intensity per nucleus. Wild type embryos used to show background fluorescence with staining. (D) (Top) E3.5 immunofluorescence of HA to determine degradation of tagged protein following several indicated incubation periods or following degradation and recovery in dTAG-13-free medium. Nuclei labeled with Hoechst. (Bottom) Quantification of mean HA signal intensity per nucleus. Scale bar, 10μm. For all experiments, maximum intensity projection (MIP) is shown in images. Plots show each data point with group mean and interquartile range. Student t-test was used to determine significance. Statistical significance is classified based on p-value as: n.s. > 0.05, * < 0.05, ** < 0.01, *** < 0.001, **** < 0.0001.
Figure 3.
Figure 3.
Establishing safety and efficiency of the dTAG system in post-implantation stages. (A) (Left) Schematic of testing dTAGv-1 safety in post-implantation development in vivo. Wild type pregnant females were given IP injection of 35mg kg−1 dTAGv-1 at 6.5, 8.5, 10.5 days post conception (dpc). (Right) Resulting healthy pups at term were counted. (B) Quantification of HA mean signal intensity in E6.5 embryos 4hrs after heterozygous NelfbdTAG/+ pregnant females received dTAGv-1 or dTAG-13 injection. Each dot represents an embryo. HA signal was normalized to Hoechst, then vehicle injected litters. (C) Immunofluorescence images of E6.5 embryos retrieved 4hrs after pregnant females received IP injection of dTAGv-1 or dTAG-13. Nuclei are labeled by Hoechst. Scale bars, 50μm. (D) Quantification of HA mean signal intensity in E7.5 embryos 1,2,3, or 4hrs after heterozygous NelfbdTAG/+ pregnant females received dTAGv-1 injection. Each dot represents an embryo. HA signal was normalized to Hoechst, then vehicle injected litters. (E) Immunofluorescence images of E7.5 embryos retrieved 1,2,3 and 4hrs after pregnant females received IP injection of dTAGv-1. Nuclei are labeled by Hoechst. Scale bars, 50μm. (F) Quantification of HA mean signal intensity in E9.5 embryos 4 and 8hrs after heterozygous NelfbdTAG/+ pregnant females received one dTAGv-1 injection, or two separated by 2hrs and followed for 6hrs after the second for a total 8hrs from first injection. Each dot represents an embryo. HA signal was normalized to Hoechst, then vehicle injected litters. (G) Immunofluorescence images of E9.5 embryos retrieved 8hrs after pregnant females received two IP injections of dTAGv-1. Nuclei are labeled by Hoechst. Scale bars, 500μm. For all experiments, maximum intensity projection (MIP) is shown in images. Plots show each data point with group mean and interquartile range. Student t-test was used to determine significance. Statistical significance is classified based on p-value as: n.s. > 0.05, * < 0.05, ** < 0.01, *** < 0.001, **** < 0.0001.
Figure 4.
Figure 4.
Establishing efficiency of the dTAG system in adult mouse tissues. (A) Western blot of HA signal levels in lysates from several organs 6hrs after IP injection of dTAGv-1. (B) (Left) Schematic of stereotaxic intracerebral injection of dTAGv-1 and dTAG-13 into the somatosensory cortex to determine the dTAG system degradation efficiency in brain tissue. (Middle) Immunofluorescence of stitched images of a whole brain coronal section post injection of dTAG-13 at the level of the somatosensory cortex/striatum. Arrow points to the injection site. Nuclei are labeled by Hoechst. Scale bars, 1mm. (Right) Zoom-in image of the injection area border showing loss of HA in nuclei in brains injected with dTAGv-1 or dTAG-13. Scale bars, 100 μm. (C) Quantification of HA mean signal intensity in adult mouse brain tissue 2hrs after homozygous NelfbdTAG/dTAG females received dTAGv-1 or dTAG-13 injection. Region immediately outside of the injection area was used as control. Three measurements were taken from three sections per biological replicate/mouse. The regions are squares on high magnification images with several nuclei included. HA signal was normalized to Hoechst, then control regions. Student t-test was used to determine significance and p-value **** < 0.0001.
Figure 5.
Figure 5.
NELFB is required for pre-implantation development during zygote-2-cell stage. (A) (Left) Schematic of testing the dTAG system in zygotes. Homozygous NelfbdTAG/dTAG embryos were collected at E0.5 and cultured with or without 500nM dTAG-13 for 1hr. (Right) Quantified mean HA signal in zygotes +/− 1 hr dTAG-13. Each dot represents a pro-nuclei. HA signal is normalized to non-treated embryos. (B) Immunofluorescence images of zygotes retrieved after 1hr culture +/− dTAG-13. Pro nuclei were labeled with Hoechst. Scale bars, 20μm. (C) Schematic of culture conditions for following panels D and E, showing when dTAG-13 is added and removed for each condition in zygote to blastocyst culture. The treatment numbers: (#1): no dTAG-13, (#2) constant dTAG-13, (#3) 36hrs dTAG-13 from zygote to 4-cell stage followed by washing, (#4) 60hrs dTAG-13 from 4-cell stage to late blastocyst stage. (D) Average number of embryos reaching the indicated developmental stage per group/treatment. Control conditions are shown. Figure legends show genotype, treatment regiment, and total number of cultured embryos. mNlfb refers to maternal Nelfb genotype. (E) (Left) Average number of embryos reaching the indicated developmental stage per group/treatment. Control conditions are shown. Figure legends show genotype, treatment regiment, and total number of cultured embryos. Testing conditions are shown with littermate controls in each experiment. (Right) plot shows the average number of embryos successfully reaching late blastocyst stage in each separate litter per condition. mNelfb refers to maternal Nelfb genotype. (F) Representative images of cultured embryos at hour 96. Scale bars, 50μm. For all experiments, maximum intensity projection (MIP) is shown in images. Plots show each data point with group mean and interquartile range. Student t-test was used to determine significance. Statistical significance is classified based on p-value as: n.s. > 0.05, * < 0.05, ** < 0.01, *** < 0.001, **** < 0.0001.
Figure 6.
Figure 6.
NELFB facilitates ZGA in mouse development (A) Schematic of experiment. NelfbdTAG/dTAG zygotes were cultured for 30hrs +/− dTAG-13 to late 2-cell stage, then collected for sequencing using SMART-seq. (B) Volcano plot of differentially expressed genes determined by DEseq2. P. adj of 0.05 was used as a cutoff. (C) Heatmap showing z-score of major ZGA genes +/− dTAG-13. 3481 genes are shown representing cluster one from Abe et al., 2018. (D) Identifying the clusters of up- and downregulated genes using clusters from Hu et al., 2020. (E) Boxplot showing the overall change of expression levels +/− dTAG-13 in each cluster from Hu et al., 2020. (F) Working model to explain the results. NELF may serve to stabilize RNA Pol II pausing prior to major ZGA, resulting in major ZGA attenuation.

References

    1. Abe K-I, Funaya S, Tsukioka D, Kawamura M, Suzuki Y, Suzuki MG, Schultz RM, and Aoki F (2018). Minor zygotic gene activation is essential for mouse preimplantation development. Proc. Natl. Acad. Sci. U. S. A 115, E6780–E6788. - PMC - PubMed
    1. Abuhashem A, Garg V, and Hadjantonakis A-K (2022). RNA polymerase II pausing in development: orchestrating transcription. Open Biol. 12, 210220. - PMC - PubMed
    1. Adelman K, and Lis JT (2012). Promoter-proximal pausing of RNA polymerase II: emerging roles in metazoans. Nat Rev. Genet 13, 720–731. - PMC - PubMed
    1. Amleh A, Nair SJ, Sun J, Sutherland A, Hasty P, and Li R (2009). Mouse cofactor of BRCA1 (Cobra1) is required for early embryogenesis. PLoS One 4, 2–9. - PMC - PubMed
    1. Bardot ES, and Hadjantonakis A-K (2020). Mouse gastrulation: Coordination of tissue patterning, specification and diversification of cell fate. Mech. Dev 163, 103617. - PMC - PubMed

Publication types

Substances