. 2022 Jul:61:101494.
doi: 10.1016/j.molmet.2022.101494. Epub 2022 Apr 12.

Hmgcs2-mediated ketogenesis modulates high-fat diet-induced hepatosteatosis

Affiliations

Hmgcs2-mediated ketogenesis modulates high-fat diet-induced hepatosteatosis

Shaza Asif et al. Mol Metab. 2022 Jul.

Abstract

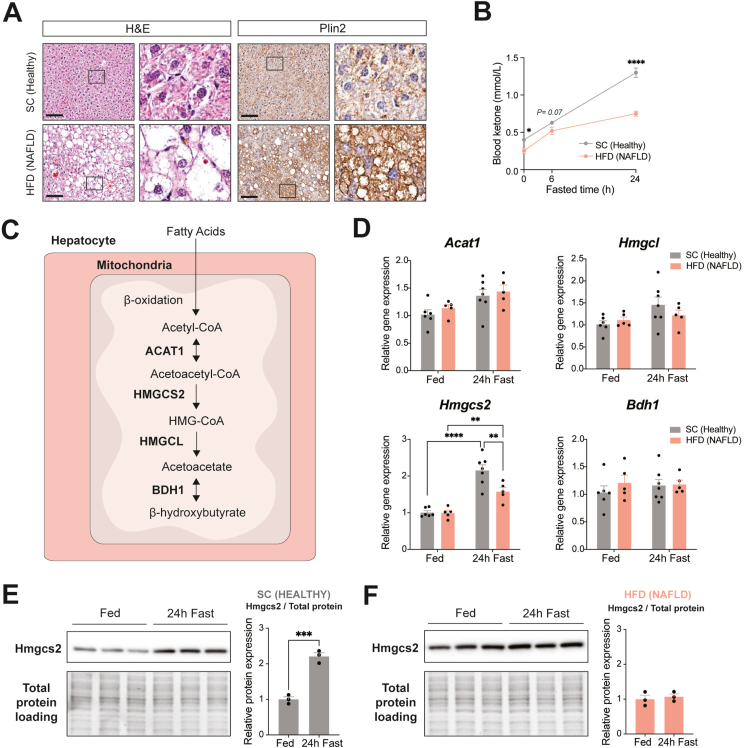
Objective: Aberrant ketogenesis is correlated with the degree of steatosis in non-alcoholic fatty liver disease (NAFLD) patients, and an inborn error of ketogenesis (mitochondrial HMG-CoA synthase deficiency) is commonly associated with the development of the fatty liver. Here we aimed to determine the impact of Hmgcs2-mediated ketogenesis and its modulations on the development and treatment of fatty liver disease.

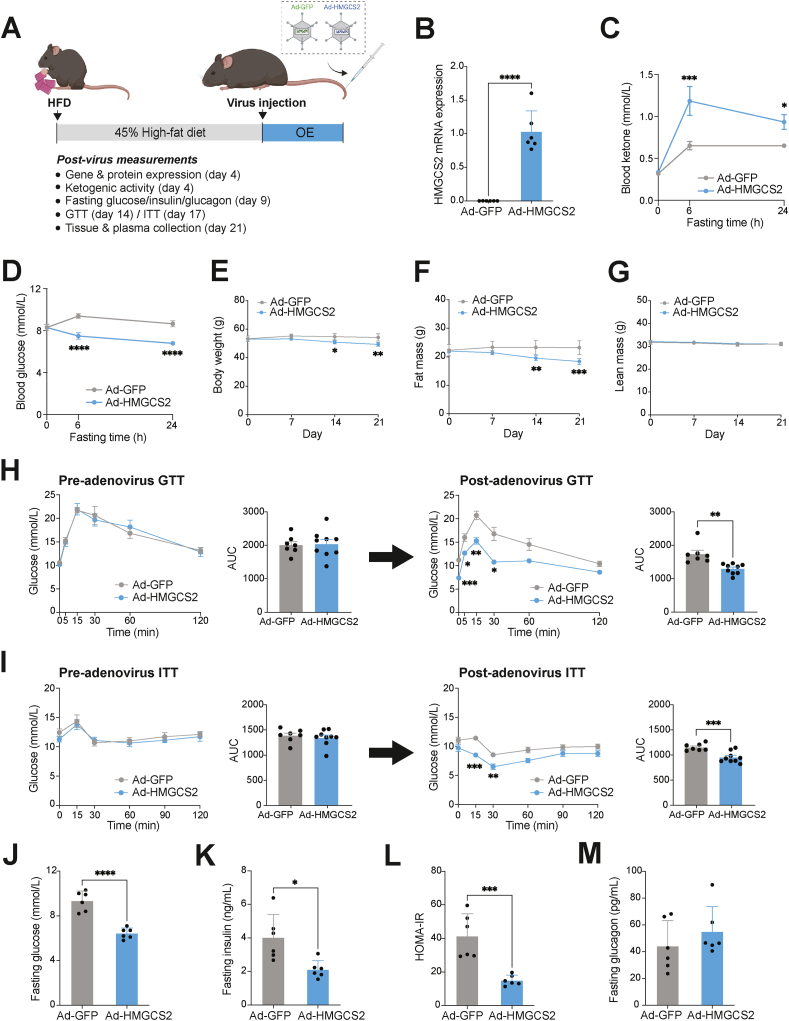
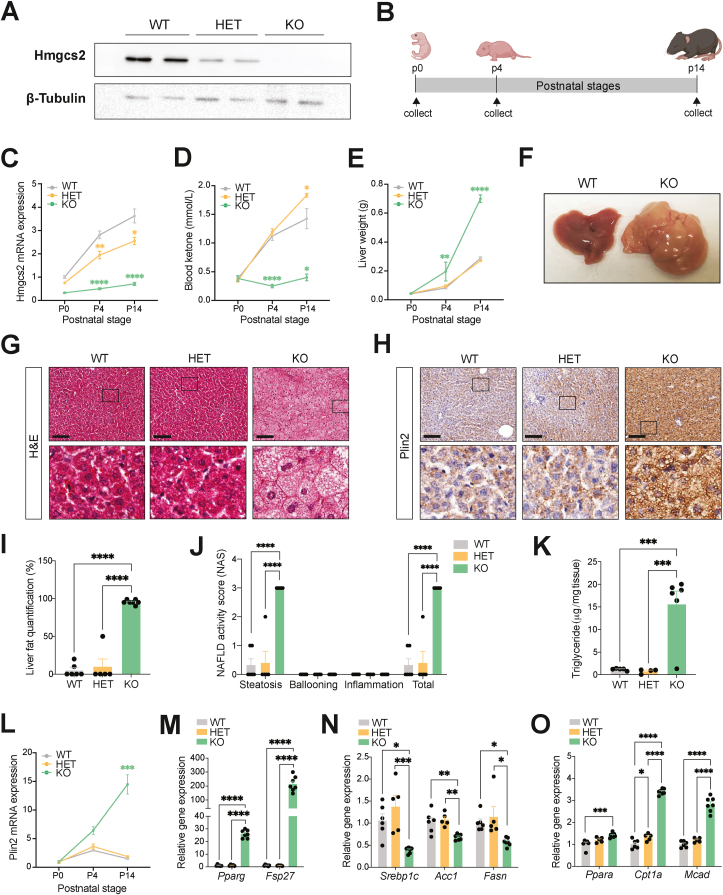
Methods: Loss- and gain-of-ketogenic function models, achieved by Hmgcs2 knockout and overexpression, respectively, were utilized to investigate the role of ketogenesis in the hepatic lipid accumulation during postnatal development and in a high-fat diet-induced NAFLD mouse model.

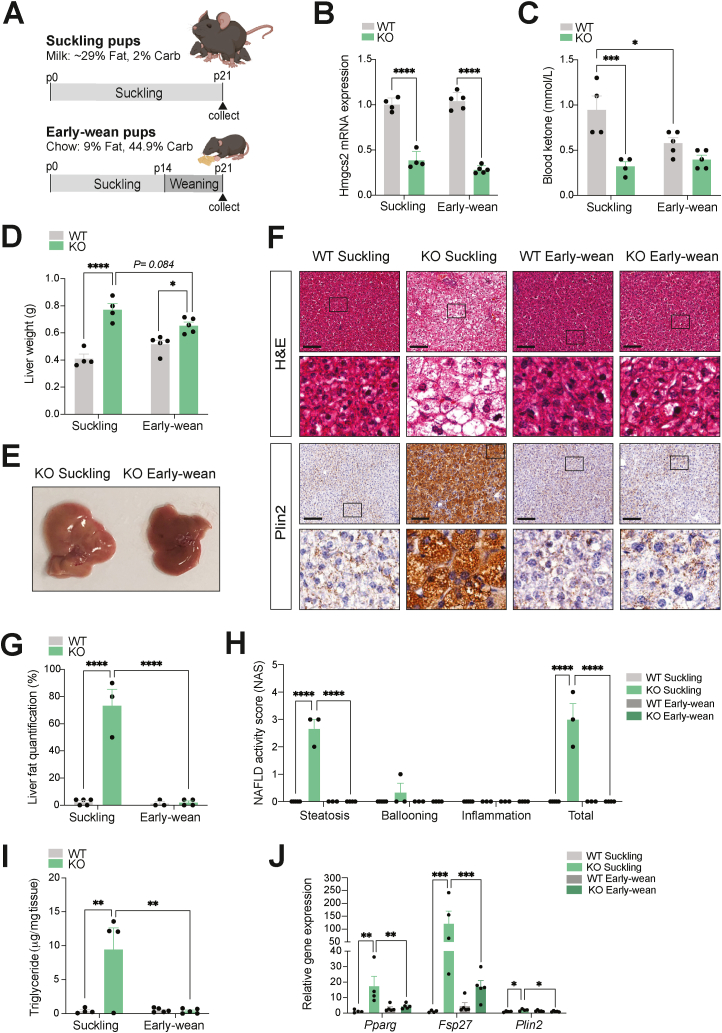
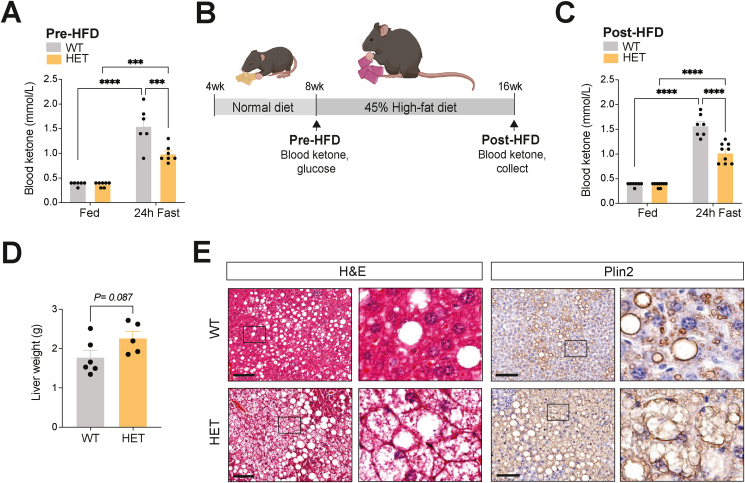
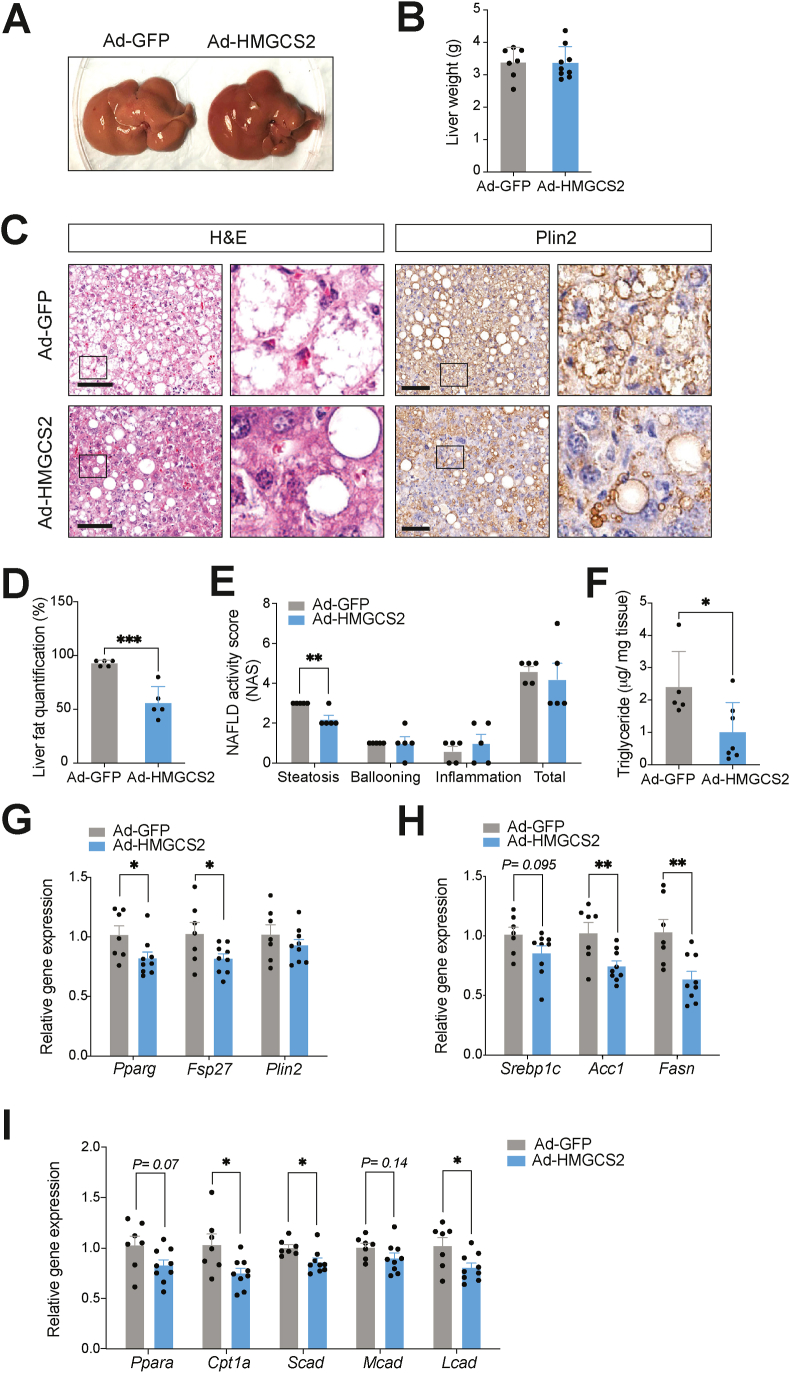
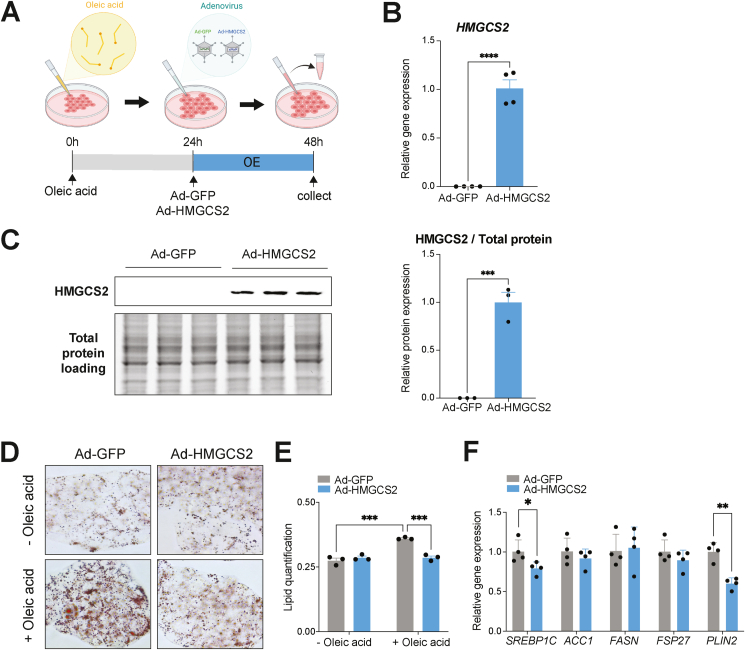
Results: Ketogenic function was decreased in NAFLD mice with a reduction in Hmgcs2 expression. Mice lacking Hmgcs2 developed spontaneous fatty liver phenotype during postnatal development, which was rescued by a shift to a low-fat dietary composition via early weaning. Hmgcs2 heterozygous adult mice, which exhibited lower ketogenic activity, were more susceptible to diet-induced NAFLD development, whereas HMGCS2 overexpression in NAFLD mice improved hepatosteatosis and glucose homeostasis.

Conclusions: Our study adds new knowledge to the field of ketone body metabolism and shows that Hmgcs2-mediated ketogenesis modulates hepatic lipid regulation under a fat-enriched nutritional environment. The regulation of hepatic ketogenesis may be a viable therapeutic strategy in the prevention and treatment of hepatosteatosis.

Keywords: Hmgcs2; Ketogenesis; Lipid accumulation; NAFLD.


Figures

Figure 5
Figure 5
Ketogenesis activation through HMGCS2 overexpression confers metabolic improvements in HFD-induced NAFLD mice. (A) Schematic illustration of the HMGCS2 overexpression experiment, using HFD-induced NAFLD mice that were intravenously administered with adenovirus expressing GFP (Ad-GFP) or HMGCS2 (Ad-HMGCS2). (B) Human HMGCS2 mRNA expression in the Ad-HMGCS2 mouse livers, compared to Ad-GFP controls. (C) Blood ketone and (D) glucose levels at baseline and 6- and 24-hour post-fasting, measured at day 4 post-virus injection (n = 6/group). Weekly measurements of (E) body weight, (F) fat mass and (G) lean mass of mice for 3 weeks post-virus administration. Pre- and post-virus (H) glucose tolerance test (GTT) and (I) insulin tolerance test (ITT) and their respective area-under the curve (AUC) (Ad-GFP, n = 7; Ad-HMGCS2, n = 9). (J) Blood glucose, (K) plasma insulin, (L) Homeostatic Model Assessment for Insulin Resistance (HOMA-IR), and (M) plasma glucagon of Ad-GFP and Ad-HMGCS2 mice, measured at 6-hour fasting (n = 6/group). Data are represented as mean ± SEM. Statistical analysis was performed by student's t-test or two-way repeated measures ANOVA. ∗P ≤ 0.05; ∗∗P ≤ 0.01; ∗∗∗P ≤ 0.001; ∗∗∗∗P ≤ 0.0001. (Created with BioRender.com).
Figure 1
Figure 1
NAFLD mice exhibit impaired fasting-induced ketogenesis due to abnormal Hmgcs2 expression in the liver. (A) Hematoxylin & Eosin (H&E) and anti-perilipin 2 (Plin2) immunohistochemical (IHC) staining of liver sections from healthy mice fed standard chow (SC) (22% kcal fat, 55% kcal carbohydrates, 23% kcal protein) and NAFLD mice fed high-fat diet (HFD) (45% kcal fat, 35% kcal carbohydrates, 20% kcal protein) for 32 weeks. Scale bar = 100 μm. Boxes indicate regions of higher magnification. (B) Blood ketone body levels at baseline and 6- and 24-hour post-fasting (SC, n = 7; HFD, n = 10). (C) Schematic of the hepatic ketogenic pathway with key metabolites and enzymes. (D) mRNA expression analysis of ketogenic enzymes in the liver, including Acat1, Hmgcl, Hmgcs2, and Bdh1, in fed (SC, n = 6; HFD, n = 5) and 24-hour fast (SC, n = 7; HFD, n = 5). Hmgcs2 protein expression and quantification in (E) SC-fed healthy and (F) HFD-fed NAFLD mouse livers in fed and 24-hour fast (n = 3/group). Data are represented as mean ± SEM. Statistical analysis was performed by student's t-test and two-way or two-way repeated measures ANOVA. ∗P ≤ 0.05; ∗∗P ≤ 0.01; ∗∗∗P ≤ 0.001 ∗∗∗∗P ≤ 0.0001.
Figure 2
Figure 2
Ketogenic deficiency through Hmgcs2 knockout results in fatty liver development in postnatal mice. (A) Liver Hmgcs2 protein expression in wild-type (WT), Hmgcs2-heterozygous (HET) and knockout (KO) mice. (B) Schematic representing the postnatal stages of p0, p4, and p14 at which the mice were examined. (C) Hmgcs2 gene expression in the liver, (D) blood ketone levels, and (E) liver weights during postnatal development (p0: WT, n = 5; HET, n = 6–9; KO, n = 6; male and female combined/p4: WT, n = 7–9; HET, n = 6–11; KO, n = 4/p14: WT, n = 4–11; HET, n = 3–9; KO, n = 3–10). (F) Representative image of livers of p14 WT and KO mice. (G) H&E and (H) anti-Plin2 IHC stainings of p14 WT, HET and KO mouse liver sections. Scale bar = 100 μm. Boxes indicate regions of higher magnification. (I) Histological liver fat quantification and (J) NAFLD Activity Score (NAS) (WT, n = 6; HET, n = 5; KO, n = 7). (K) Liver triglyceride concentration of p14 WT, HET and KO mice (WT, n = 5; HET, n = 4; KO, n = 6). (L) Plin2 gene expression in the liver during postnatal development (p0: WT, n = 5; HET, n = 6; KO, n = 6; male and female combined/p4: WT, n = 7; HET, n = 6; KO, n = 4/p14: WT, n = 6; HET, n = 5; KO, n = 7). (M) Lipid accumulation markers (Pparg, Fsp27), (N) lipid synthesis genes (Srebp1c, Acc1, Fasn) and (O) lipid oxidation genes (Ppara, Cpt1a, Mcad) in p14 WT, HET and KO mouse livers (WT, n = 6; HET, n = 5; KO, n = 7). Data are represented as mean ± SEM. Statistical analysis was performed by one- or two-way ANOVA. ∗P ≤ 0.05; ∗∗P ≤ 0.01; ∗∗∗P ≤ 0.001; ∗∗∗∗P ≤ 0.0001. (Created with BioRender.com).
Figure 3
Figure 3
Fatty liver disease in postnatal Hmgcs2 knockout mice is rescued by early weaning. (A) Schematic representation of the early weaning protocol in postnatal WT and Hmgcs2-KO mice. Early-wean mice were separated from their mothers at p14 and transitioned from a high-fat breast milk to a standard laboratory chow diet. Suckling control mice remained on breast milk feeding until collection at postnatal day 21 (p21). (B) Hmgcs2 gene expression in the liver and (C) blood ketone levels of suckling and early-wean WT and Hmgcs2-KO mice at p21. (D) Liver weights (suckling WT/KO, n = 4; early-wean WT/KO, n = 5). (E) Representative liver image of Hmgcs2-KO suckling and early-wean mice at p21. (F) H&E and anti-Plin2 IHC staining of liver sections. Scale bar = 100 μm. Boxes indicate regions of higher magnification. (G) Histological liver fat quantification and (H) NAFLD activity score (NAS) (suckling WT, n = 5; suckling KO, n = 3; early-wean WT, n = 3; early-wean KO, n = 4; male and female mice combined). (I) Liver triglyceride concentrations of suckling and early-wean WT and Hmgcs2-KO mice at p21 (suckling WT/KO, n = 4; early-wean WT/KO, n = 5). (J) Hepatic gene expression analysis of lipid accumulation markers (Pparg, Fsp27, and Plin2). Data are represented as mean ± SEM. Statistical analysis was performed by two-way ANOVA. ∗P ≤ 0.05; ∗∗P ≤ 0.01; ∗∗∗P ≤ 0.001; ∗∗∗∗P ≤ 0.0001. (Created with BioRender.com).
Figure 4
Figure 4
Ketogenic insufficiency increased the susceptibility of HFD-induced NAFLD development and associated metabolic dysfunction. (A) Blood ketone levels in 8-week-old fed and 24-hour fasted WT and Hmgcs2-HET mice (pre-HFD) (WT, n = 6; HET, n = 7). (B) Schematic for assessment of NAFLD development in WT and Hmgcs2-HET mice placed on 8-weeks of HFD. (C) Blood ketone levels in fed and 24-hour fasted post-HFD WT and Hmgcs2-HET mice (WT, n = 7; HET, n = 9). (D) Liver weights (WT, n = 6; HET, n = 5). (E) Representative H&E and anti-Plin2 IHC staining of liver sections of WT and Hmgcs2-HET mice. Scale bar = 100 μm. Boxes indicate regions of higher magnification. Data are represented as mean ± SEM. Statistical analysis was performed by student's t-test or two-way ANOVA. ∗∗∗P ≤ 0.001; ∗∗∗∗P ≤ 0.0001. (Created with BioRender.com).
Figure 6
Figure 6
Ketogenesis activation through HMGCS2 overexpression improves hepatosteatosis in HFD-induced NAFLD mice. (A) Representative image of Ad-GFP and Ad-HMGCS2 mouse livers. (B) Liver weights at 3 weeks post-virus injection (Ad-GFP, n = 7; Ad-HMGCS2, n = 9). (C) H&E and anti-Plin2 IHC staining of liver sections. Scale bar = 100 μm. Boxes indicate regions of higher magnification. (D) Histological liver fat quantification (n = 5/group). (E) NAFLD activity score (NAS) (n = 5/group). (F) Liver triglyceride concentrations of Ad-GFP and Ad-HMGCS2 mice (Ad-GFP, n = 5; Ad-HMGCS2, n = 7). Gene expression analysis of (G) lipid accumulation (Pparg, Fsp27, Plin2), (H) lipid synthesis (Srebp1c, Acc1, Fasn) and (I) lipid oxidation (Ppara, Cpt1a, Scad, Mcad, Lcad) (Ad-GFP, n = 7; Ad-HMGCS2, n = 9) markers. Data are represented as mean ± SEM. Statistical analysis was performed by student's t-test. ∗P ≤ 0.05; ∗∗P ≤ 0.01; ∗∗∗P ≤ 0.001.
Figure 7
Figure 7
HMGCS2 overexpression ameliorates lipid accumulation in HepG2 cells. (A) Schematic representing timeline of in vitro experiment, starting with oleic acid treatment at 0-hours, adenovirus-mediated overexpression of GFP (Ad-GFP) or HMGCS2 (Ad-HMGCS2) at 24-hours and cell collection at 48-hours. (B) RT-qPCR (n = 4/group) and (C) western blot quantification of HMGCS2 expression (n = 3/group) in HepG2 cells after Ad-HMGCS2 infection, compared to Ad-GFP. (D) Representative images of Oil-red-O staining and (E) its quantification of Ad-GFP or Ad-HMGCS2 treated HepG2 cells in the absence (−) and presence (+) of oleic acid (n = 3/group). (F) RT-qPCR of lipid synthesis (SREBP1C, ACC1, FASN) and lipid accumulation (FSP27, PLIN2) genes in Ad-GFP and Ad-HMGCS2 treated HepG2 cells (n = 4/group). Data are represented as mean ± SEM. Statistical analysis was performed by student's t-test or two-way ANOVA. ∗P ≤ 0.05; ∗∗P ≤ 0.01, ∗∗∗P ≤ 0.001; ∗∗∗∗P ≤ 0.0001. (Created with BioRender.com).

References

    1. Arshad T., Golabi P., Henry L., Younossi Z.M. Epidemiology of non-alcoholic fatty liver disease in north America. Current Pharmaceutical Design. 2020;26(10):993–997. - PubMed
    1. Huang D.Q., El-Serag H.B., Loomba R. Global epidemiology of NAFLD-related HCC: trends, predictions, risk factors and prevention. Nature Reviews Gastroenterology & Hepatology. 2021;18(4):223–238. - PMC - PubMed
    1. Mantovani A., Petracca G., Beatrice G., Csermely A., Lonardo A., Targher G. Glucagon-like peptide-1 receptor agonists for treatment of nonalcoholic fatty liver disease and nonalcoholic steatohepatitis: an updated meta-analysis of randomized controlled trials. Metabolites. 2021;11(2) - PMC - PubMed
    1. Makri E.S., Goulas A., Polyzos S.A. Sodium-glucose co-transporter 2 inhibitors in nonalcoholic fatty liver disease. European Journal of Pharmacology. 2021;907:174272. - PubMed
    1. Donnelly K.L., Smith C.I., Schwarzenberg S.J., Jessurun J., Boldt M.D., Parks E.J. Sources of fatty acids stored in liver and secreted via lipoproteins in patients with nonalcoholic fatty liver disease. Journal of Clinical Investigation. 2005;115(5):1343–1351. - PMC - PubMed

Publication types

MeSH terms

Grants and funding