. 2022 May:284:121508.
doi: 10.1016/j.biomaterials.2022.121508. Epub 2022 Apr 7.

Myoblast deactivation within engineered human skeletal muscle creates a transcriptionally heterogeneous population of quiescent satellite-like cells

Affiliations

Myoblast deactivation within engineered human skeletal muscle creates a transcriptionally heterogeneous population of quiescent satellite-like cells

Jason Wang et al. Biomaterials. 2022 May.

Abstract

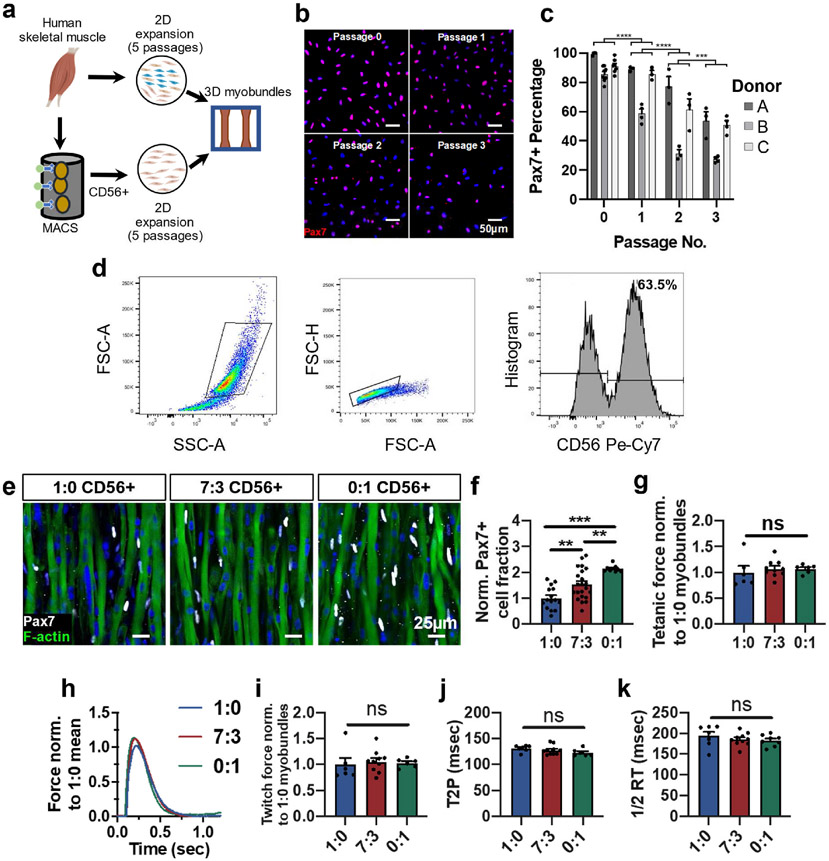
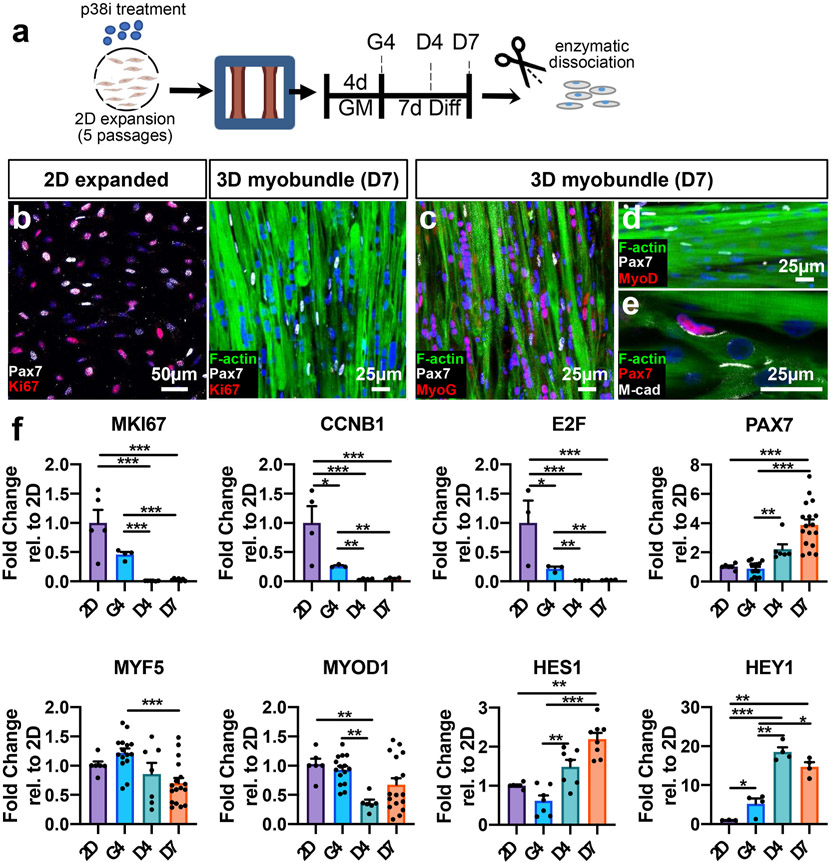
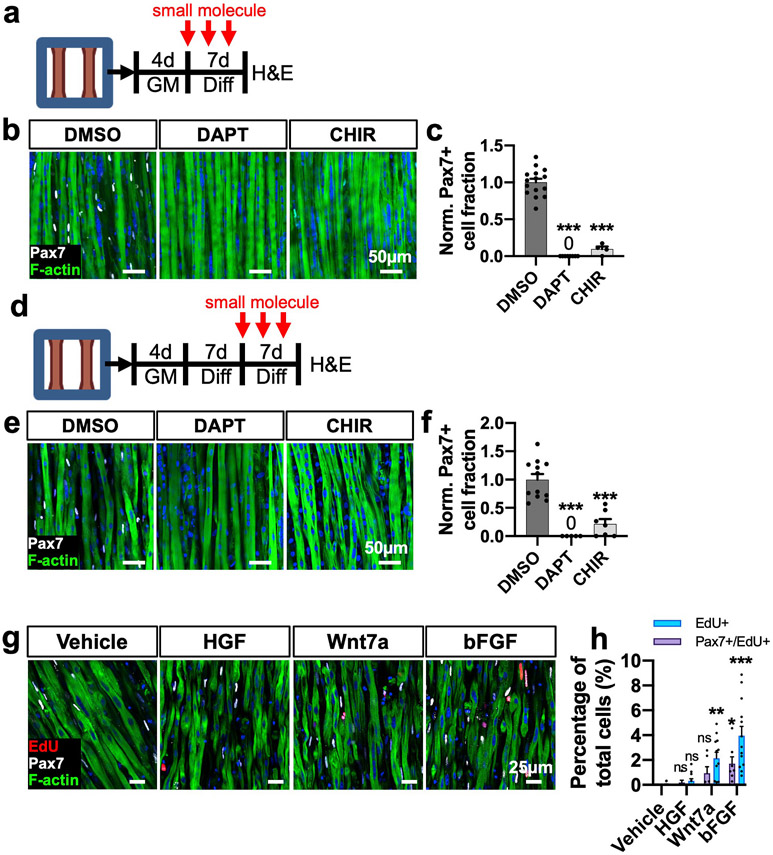
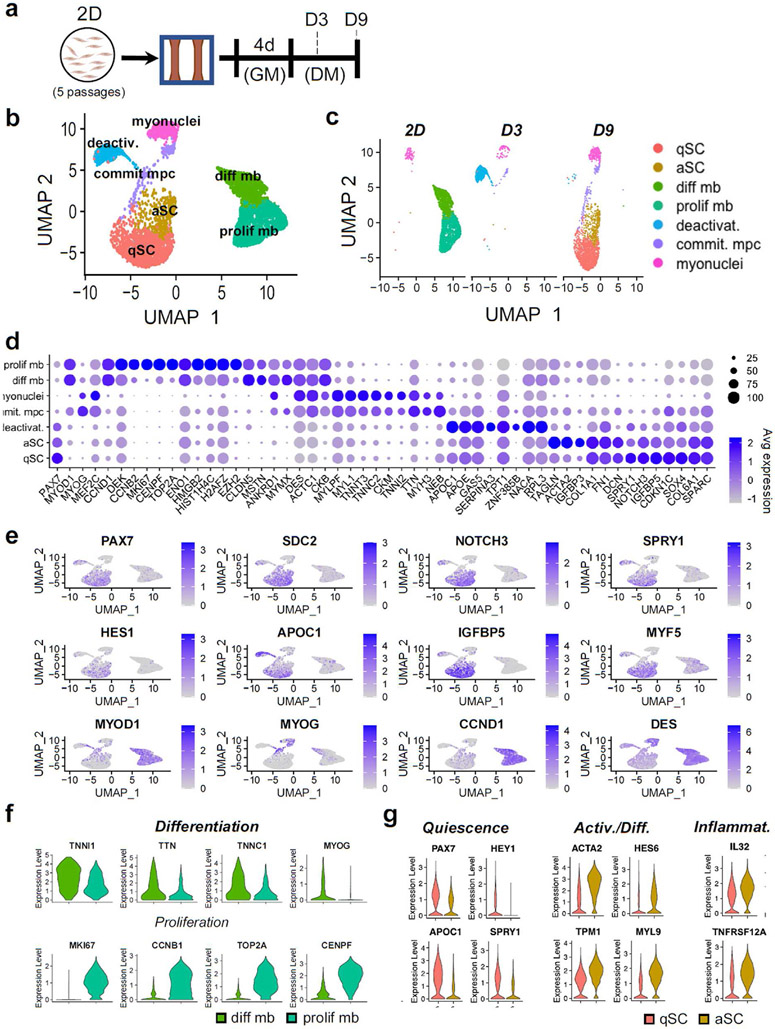
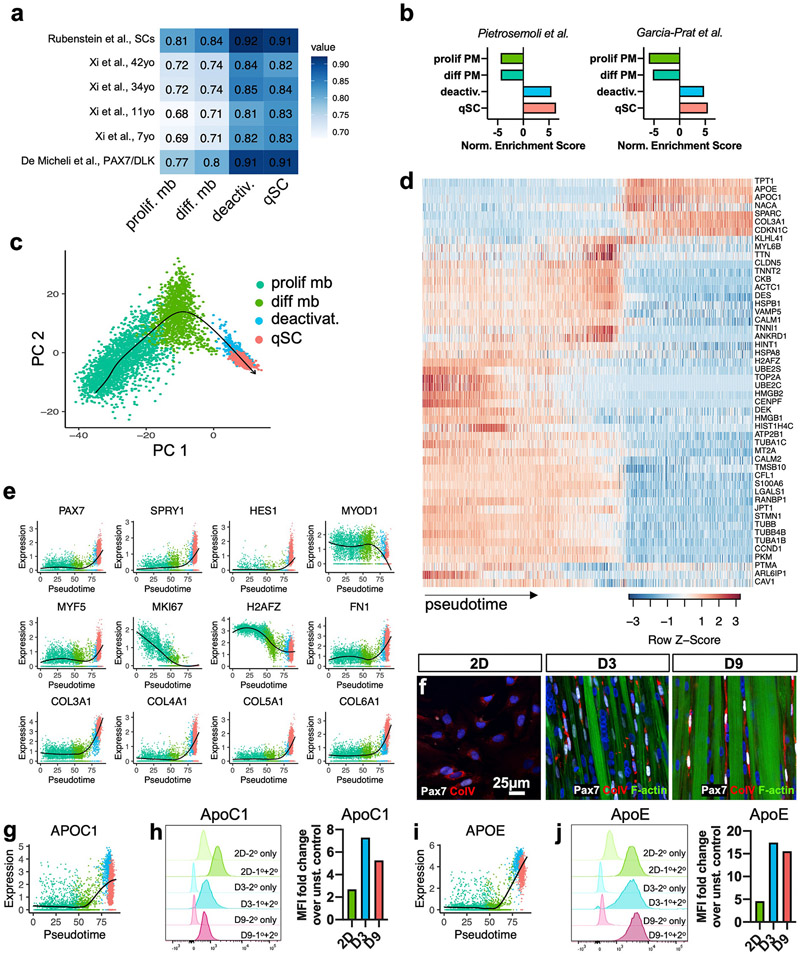
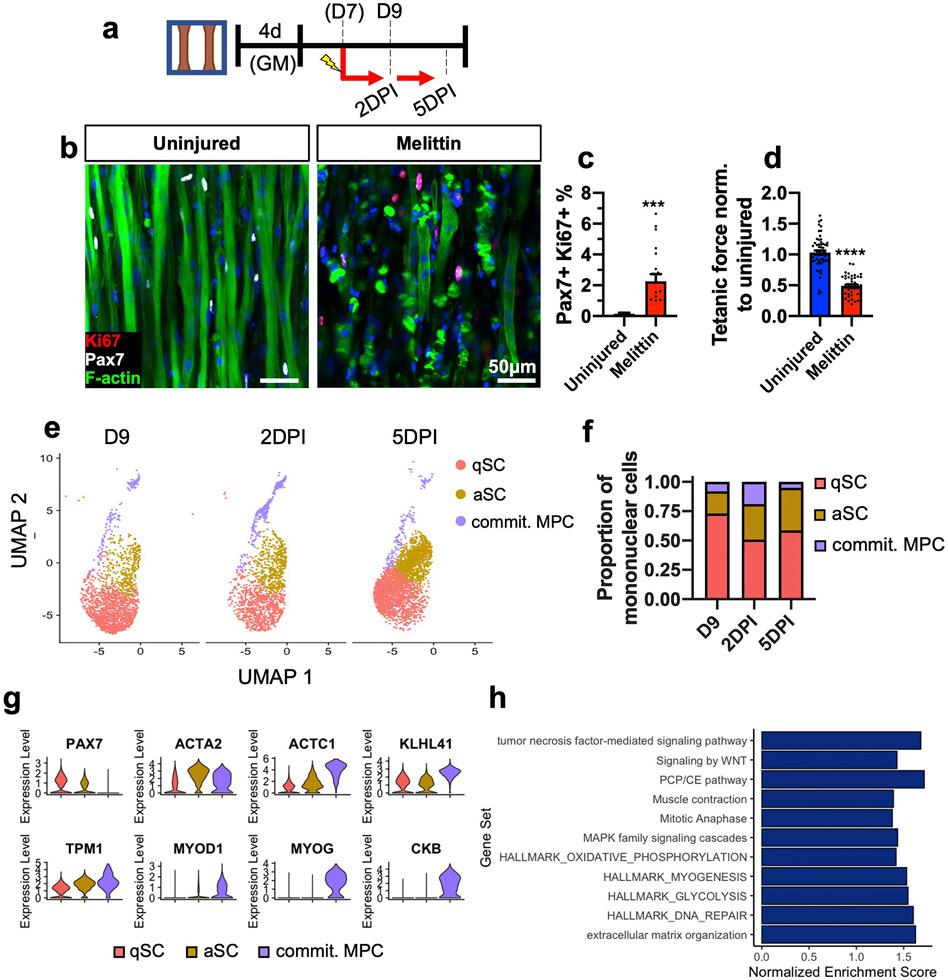
Satellite cells (SCs), the adult Pax7-expressing stem cells of skeletal muscle, are essential for muscle repair. However, in vitro investigations of SC function are challenging due to isolation-induced SC activation, loss of native quiescent state, and differentiation to myoblasts. In the present study, we optimized methods to deactivate in vitro expanded human myoblasts within a 3D culture environment of engineered human skeletal muscle tissues ("myobundles"). Immunostaining and gene expression analyses revealed that a fraction of myoblasts within myobundles adopted a quiescent phenotype (3D-SCs) characterized by increased Pax7 expression, cell cycle exit, and activation of Notch signaling. Similar to native SCs, 3D-SC quiescence is regulated by Notch and Wnt signaling while loss of quiescence and reactivation of 3D-SCs can be induced by growth factors including bFGF. Myobundle injury with a bee toxin, melittin, induces robust myofiber fragmentation, functional decline, and 3D-SC proliferation. By applying single cell RNA-sequencing (scRNA-seq), we discover the existence of two 3D-SC subpopulations (quiescent and activated), identify deactivation-associated gene signature using trajectory inference between 2D myoblasts and 3D-SCs, and characterize the transcriptomic changes within reactivated 3D-SCs in response to melittin-induced injury. These results demonstrate the ability of an in vitro engineered 3D human skeletal muscle environment to support the formation of a quiescent and heterogeneous SC population recapitulating several aspects of the native SC phenotype, and provide a platform for future studies of human muscle regeneration and disease-associated SC dysfunction.

Keywords: Activation; Engineered skeletal muscle; Human; Quiescence; Satellite cells; scRNA-seq.


Figures

Fig. 1.
Fig. 1.. CD56-based myoblast purification to increase formation of Pax7+ cells in myobundles.
a, Schematic of experimental flow from primary muscle cell isolation to 2D culture (unsorted or CD56+ MACS enrichment) and myobundle construction. b,c, Representative images of Pax7 staining in expanded CD56+ cells (nuclei stained with DAPI) at specified passages (b) and corresponding quantification (c, n = 3–6 coverslips per passage per donor, N = 3 donors). d, Representative flow cytometry analysis of muscle cell population expanded for 5 passages from muscle biopsy, highlighting the CD56+ cell fraction. e,f Representative whole bundle stains of 1-week differentiated myobundles with varying ratios (1:0, 7:3, and 0:1) of initial heterogeneous cells to CD56+ cells stained for Pax7 and F-actin (e) and corresponding quantification of Pax7 cell fraction normalized to 1:0 group (f, N = 1 donor, n = 9–22 myobundles per group). g, Tetanic force of 1-week differentiated myobundles normalized to 1:0 group (N = 1 donor, n = 4–10 myobundles per group). h, Representative twitch force trace from 1-week differentiated myobundles comprised with varying ratios (1:0, 7:3, and 0:1) of initial heterogeneous cells to CD56+ cells normalized to the mean twitch force of 1:0 myobundles and quantified twitch force (i), time to peak tension (T2P, j), and half-relaxation time (1/2 RT, k) (N = 1 donor, n = 6–10 myobundles per group). Data: mean ± SEM. *p < .05, **p < .01, ***p < .001; ns, not significant.
Fig. 2.
Fig. 2.. Cell cycle arrest and gene expression in transition from 2D expansion to 3D myobundle culture.
a, Schematic of experimental timeline (2D expansion for 5 passages with p38i followed by 3D culture). GM: 3D growth media, Diff: 3D differentiation media, G4 day 4 in growth media, D4,7, days 4,7 in differentiation media). b, Representative images of Pax7 and Ki67 staining in 2D-expanded passage-5 CD56+ myoblasts and D7 myobundles with myofibers stained with F-actin (DAPI-stained nuclei are blue). c-e, Representative images of D7 myobundles showing expression of transcription factors Pax7, MyoG, and MyoD, and cell adhesion molecule M-cadherin (M-cad). f, Gene expression in cells isolated from passage 5 expanded 2D cultures (2D) or myobundles (G4, D4, D7) normalized to RPL13 and shown relative to 2D group (N = 1 donor, n = 3–17 samples per group, 1 sample = cells from 4 to 8 myobundles or separate 2D cultures). Data: mean ± SEM. *p < .05; **p < .01; ***p < .001.
Fig. 3.
Fig. 3.. Notch and Wnt modulation on 3D SC quiescence and maintenance.
a, Schematic diagram of experimental design and treatment timing (GM: 3D growth media, Diff: 3D differentiation media). b, Representative images of whole-mount myobundles treated with DMSO (vehicle control), DAPT (3 μm), or CHIR (3 μm) during the first week of 3D differentiation stained for Pax7 and F-actin. c, Quantification of normalized Pax7+ cell fraction from whole myobundle stains (N = 1 donor, n = 4–15 myobundles per group). d, Schematic diagram of experimental design and treatment timing. e, Representative images of whole-mount myobundles treated with DMSO, CHIR, or DAPT during the second week of 3D differentiation stained for Pax7 and F-actin. f, Quantification of normalized Pax7 cell fraction from whole myobundle stains (N = 1 donors, n = 5–12 myobundles per group). g, Representative longitudinal sections of 14-day myobundles stained for EdU, Pax7, and F-actin after 1 week of treatment with specified growth factors. h, Quantification of EdU + percentage of nuclei (N = 2 donors, n = 6–13 myobundles per group). Data: mean ± SEM. *p < .05; **p < .01; ***p < .001; ns, not significant.
Fig. 4.
Fig. 4.. scRNA-seq clustering and marker analysis.
a, Schematic diagram of experimental layout. b, UMAP plot of cells isolated from all conditions. Each dot represents 1 cell, which is assigned to a distinctly colored cluster as identified by clustering analysis. c, UMAP plot split by each analyzed cell population (at different days of 2D and 3D culture) with cells colored by cluster. d, Dot plots displaying gene expression for each cluster with dot size representing percentage of cells expressing the gene and color representing average level of gene expression. e, UMAP plot with expression of selected genes associated with SC quiescence, activation, and myogenesis. f, Violin plots of the differentiating myoblast and proliferative myoblast clusters for differentiation and proliferation markers (padj < .01). g, Violin plots for the quiescent 3D-SC (qSC) and activated 3D-SC (aSC) cluster from the D9 condition for quiescence, activation, differentiation, and inflammatory markers (padj < .01).
Fig. 5.
Fig. 5.. Transcriptomic characterization of myoblast deactivation.
a, Heatmap of Spearman’s correlations between published human scRNA-seq clusters and proliferative myoblast, differentiating myoblast, deactivating cells, and qSC clusters. b, Normalized enrichment scores from GSEA of clusters using published mouse SC quiescence signatures by Pietrosemoli et al. [77] and Garcia-Prat et al. [78] as gene sets (q < .05). c, PCA plot for the proliferative myoblast, differentiating myoblast, deactivating cells, and qSC clusters from the 2D, D3, and D9 conditions with arrow delineating the trajectory generated by Slingshot. d, Heatmap of the top 50 important genes and their expression across pseudotime. e, Expression plots for selected genes across pseudotime with locally estimated scatterplot smoothing (LOESS) fit (black). f, Representative 2D, D3, and D9 cultures stained for Pax7, collagen V (Col V), and F-actin. g, APOC1 gene expression plot across pseudotime with LOESS fit. h, Flow cytometry fluorescence intensity histograms for ApoC1 protein with faint colors representing unstained controls (2° antibody only) and darker colors representing stained 2D, D3, and D9 samples (1°+2° antibody) and corresponding fold changes in the median fluorescence intensity (MFI) of stained vs. unstained samples. i-j, APOE gene and protein expression data analogous to that shown in g-h.
Fig. 6.
Fig. 6.. Response of Myobundles and 3D SCs to injury.
a, Schematic diagram of experimental layout. DPI, days post-injury. b-d) Representative images of 1-week differentiated myobundles uninjured or injured by melittin and stained for Pax7, Ki67, and F-actin 2 days post-injury (b) and corresponding quantifications of percent Pax7+ Ki67+ nuclei (c, N = 2 donors, n = 20 myobundles per group) and tetanic force normalized to uninjured control (d, N = 3 donors, n = 44–60 myobundles per group). e,f UMAP plot of qSCs, aSCs, and committed MPCs at D9, 2DPI, and 5DPI (e) and corresponding proportions of each subpopulation within the total cell number (f). g, Violin plots of selected genes for the qSC and aSC clusters across all timepoints. h, GSEA of the 2DPI and 5DPI versus D9 aSC cluster with selected Gene Ontology and Reactome annotations (q < 0.05). Data: mean ± SEM. *p < .05; **p < .01; ***p < .001.

References

    1. Lepper C, Partridge TA, Fan CM, An absolute requirement for Pax7-positive satellite cells in acute injury-induced skeletal muscle regeneration, Development 138 (17) (2011) 3639–3646. - PMC - PubMed
    1. Yablonka-Reuveni Z, The skeletal muscle satellite cell: still young and fascinating at 50, J. Histochem. Cytochem 59 (12) (2011) 1041–1059. - PMC - PubMed
    1. Le Grand F, Rudnicki MA, Skeletal muscle satellite cells and adult myogenesis, Curr. Opin. Cell Biol 19 (6) (2007) 628–633. - PMC - PubMed
    1. Bjornson CR, Cheung TH, Liu L, Tripathi PV, Steeper KM, Rando TA, Notch signaling is necessary to maintain quiescence in adult muscle stem cells, Stem Cell. 30 (2) (2012) 232–242. - PMC - PubMed
    1. Mourikis P, Sambasivan R, Castel D, Rocheteau P, Bizzarro V, Tajbakhsh S, A critical requirement for notch signaling in maintenance of the quiescent skeletal muscle stem cell state, Stem Cell. 30 (2) (2012) 243–252. - PubMed

Publication types