

When right ventricular pressure meets volume: The impact of arrival time of reflected waves on right ventricle load in pulmonary arterial hypertension
- PMID: 35421903
- PMCID: PMC9321993
- DOI: 10.1113/JP282422
When right ventricular pressure meets volume: The impact of arrival time of reflected waves on right ventricle load in pulmonary arterial hypertension
Abstract
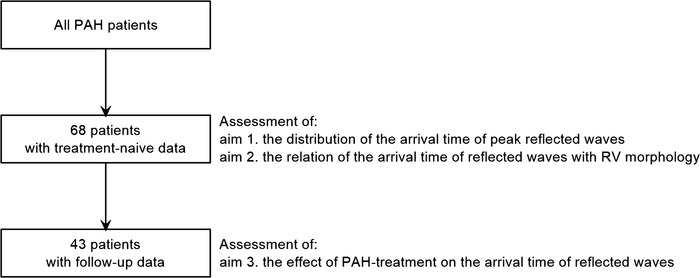
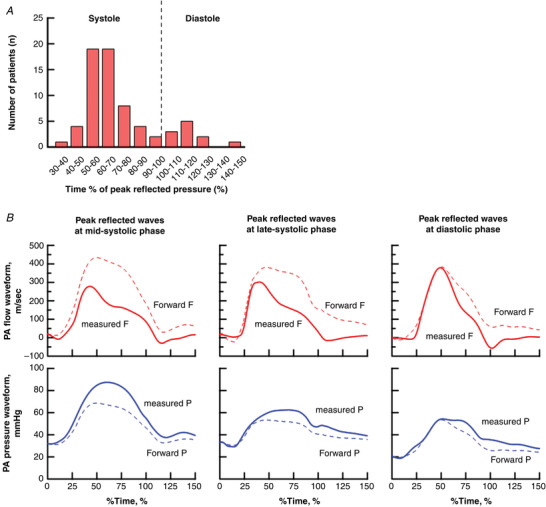
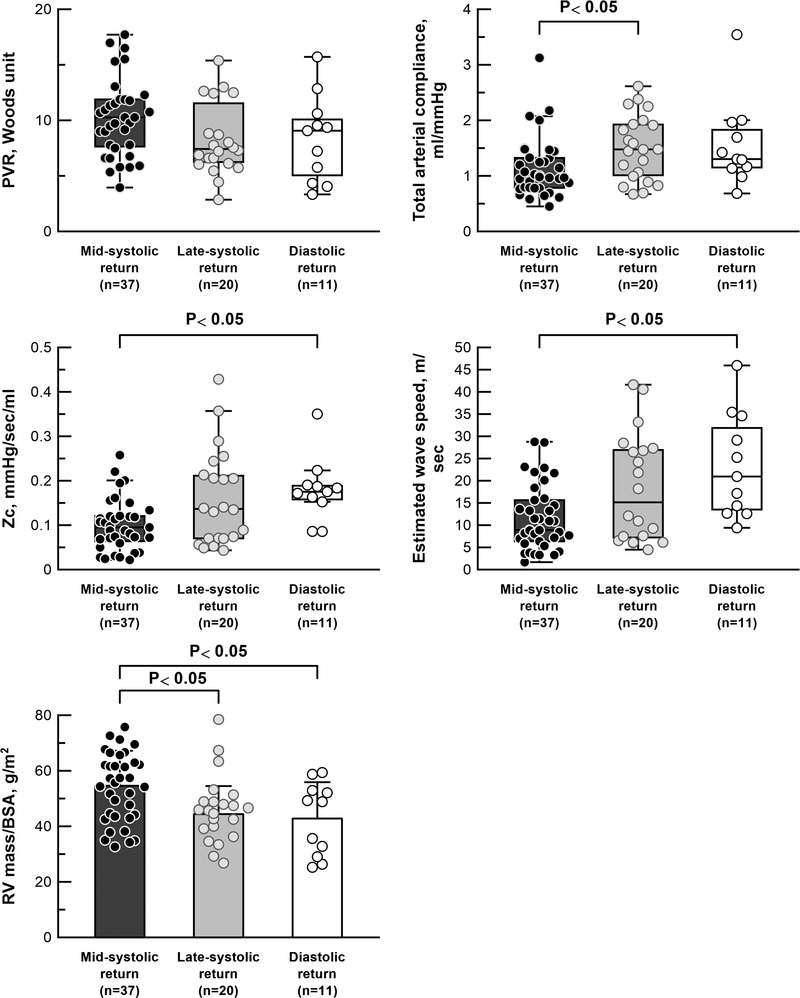
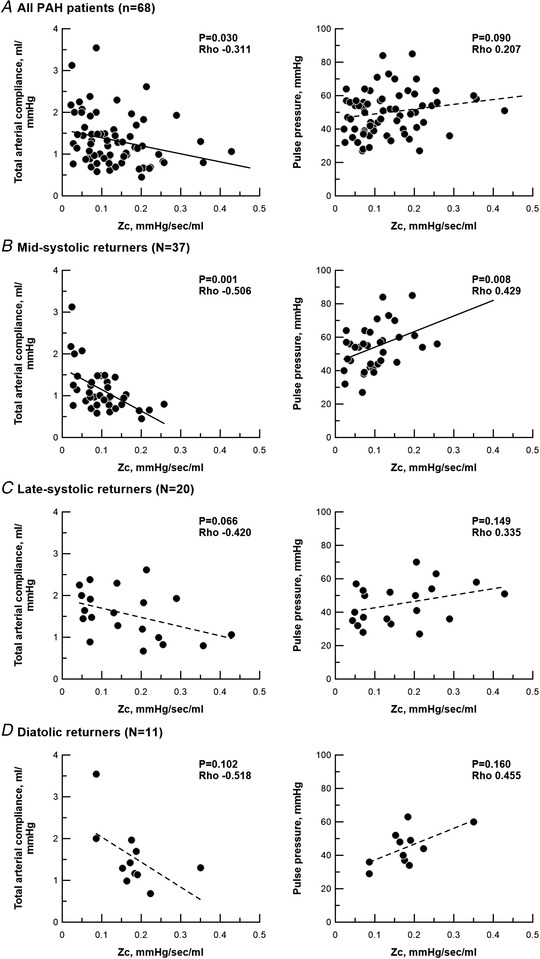
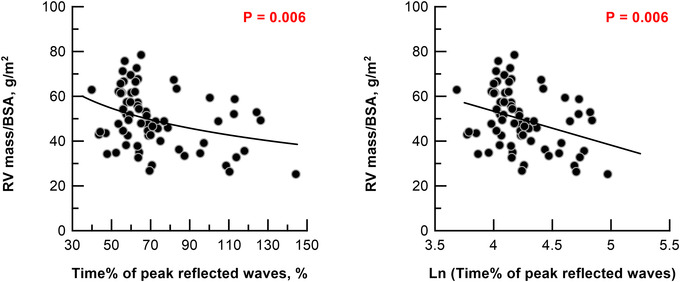
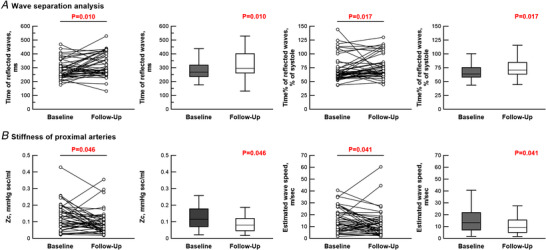
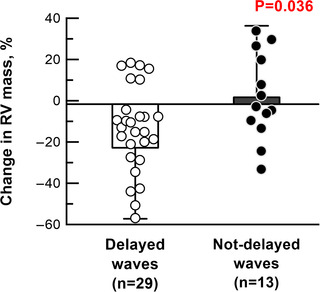
Right ventricular (RV) wall tension in pulmonary arterial hypertension (PAH) is determined not only by pressure, but also by RV volume. A larger volume at a given pressure generates more wall tension. Return of reflected waves early after the onset of contraction, when RV volume is larger, may augment RV load. We aimed to elucidate: (1) the distribution of arrival times of peak reflected waves in treatment-naïve PAH patients; (2) the relationship between time of arrival of reflected waves and RV morphology; and (3) the effect of PAH treatment on the arrival time of reflected waves. Wave separation analysis was conducted in 68 treatment-naïve PAH patients. In the treatment-naïve condition, 54% of patients had mid-systolic return of reflected waves (defined as 34-66% of systole). Despite similar pulmonary vascular resistance (PVR), patients with mid-systolic return had more pronounced RV hypertrophy compared to those with late-systolic or diastolic return (RV mass/body surface area; mid-systolic return 54.6 ± 12.6 g m-2 , late-systolic return 44.4 ± 10.1 g m-2 , diastolic return 42.8 ± 13.1 g m-2 ). Out of 68 patients, 43 patients were further examined after initial treatment. At follow-up, the stiffness of the proximal arteries, given as characteristic impedance, decreased from 0.12 to 0.08 mmHg s mL-1 . Wave speed was attenuated from 13.3 to 9.1 m s-1 , and the return of reflected waves was delayed from 64% to 71% of systole. In conclusion, reflected waves arrive at variable times in PAH. Early return of reflected waves was associated with more RV hypertrophy. PAH treatment not only decreased PVR, but also delayed the timing of reflected waves. KEY POINTS: Right ventricular (RV) wall tension in pulmonary arterial hypertension (PAH) is determined not only by pressure, but also by RV volume. Larger volume at a given pressure causes larger RV wall tension. Early return of reflected waves adds RV pressure in early systole, when RV volume is relatively large. Thus, early return of reflected waves may increase RV wall tension. Wave reflection can provide a description of RV load. In PAH, reflected waves arrive back at variable times. In over half of PAH patients, the RV is exposed to mid-systolic return of reflected waves. Mid-systolic return of reflected waves is related to RV hypertrophy. PAH treatment acts favourably on the RV not only by reducing resistance, but also by delaying the return of reflected waves. Arrival timing of reflected waves is an important parameter for understanding the relationship between RV load and its function in PAH.
Keywords: pulmonary artery-right ventricle coupling; pulmonary hypertension; right ventricle failure; ventricular afterload; wave reflection.
© 2022 The Authors. The Journal of Physiology published by John Wiley & Sons Ltd on behalf of The Physiological Society.
Conflict of interest statement
Dr N. J. Braams received a research grant from Actelion Pharmaceuticals. Dr J. T. Marcus received fees as a consultant for Actelion Pharmaceuticals. The remaining authors declare that they have no competing interests.
Figures
Comment in
-
Catching the wave at the wrong time: Arrival timing provides additional insight into right ventricular afterload in pulmonary arterial hypertension.J Physiol. 2022 Jul;600(14):3225-3226. doi: 10.1113/JP283241. Epub 2022 Jun 29. J Physiol. 2022. PMID: 35708972 No abstract available.
Similar articles
-
Early return of reflected waves increases right ventricular wall stress in chronic thromboembolic pulmonary hypertension.Am J Physiol Heart Circ Physiol. 2020 Dec 1;319(6):H1438-H1450. doi: 10.1152/ajpheart.00442.2020. Epub 2020 Oct 9. Am J Physiol Heart Circ Physiol. 2020. PMID: 33035435
-
Arterial load and right ventricular-vascular coupling in pulmonary hypertension.J Appl Physiol (1985). 2021 Jul 1;131(1):424-433. doi: 10.1152/japplphysiol.00204.2021. Epub 2021 May 27. J Appl Physiol (1985). 2021. PMID: 34043473 Free PMC article.
-
Distinct time courses and mechanics of right ventricular hypertrophy and diastolic stiffening in a male rat model of pulmonary arterial hypertension.Am J Physiol Heart Circ Physiol. 2021 Oct 1;321(4):H702-H715. doi: 10.1152/ajpheart.00046.2021. Epub 2021 Aug 27. Am J Physiol Heart Circ Physiol. 2021. PMID: 34448637 Free PMC article.
-
Haemodynamic basis for the development of left ventricular failure in systolic hypertension and for its logical therapy.J Hypertens. 1995 Sep;13(9):943-52. doi: 10.1097/00004872-199509000-00002. J Hypertens. 1995. PMID: 8586828 Review.
-
Right heart adaptation to pulmonary arterial hypertension: physiology and pathobiology.J Am Coll Cardiol. 2013 Dec 24;62(25 Suppl):D22-33. doi: 10.1016/j.jacc.2013.10.027. J Am Coll Cardiol. 2013. PMID: 24355638 Review.
Cited by
-
Pulmonary artery wave reflection and right ventricular function after lung resection.Br J Anaesth. 2023 Jan;130(1):e128-e136. doi: 10.1016/j.bja.2022.07.052. Epub 2022 Sep 15. Br J Anaesth. 2023. PMID: 36115714 Free PMC article.
-
Pathophysiology of the right ventricle and its pulmonary vascular interaction.Eur Respir J. 2024 Oct 31;64(4):2401321. doi: 10.1183/13993003.01321-2024. Print 2024 Oct. Eur Respir J. 2024. PMID: 39209482 Free PMC article. Review.
-
Highlights from the International Chronic Thromboembolic Pulmonary Hypertension Congress 2021.Eur Respir Rev. 2023 Feb 7;32(167):220132. doi: 10.1183/16000617.0132-2022. Print 2023 Mar 31. Eur Respir Rev. 2023. PMID: 36754432 Free PMC article.
-
Characterization of pulmonary arterial stiffness using cardiac MRI.Int J Cardiovasc Imaging. 2024 Feb;40(2):425-439. doi: 10.1007/s10554-023-02989-6. Epub 2023 Oct 30. Int J Cardiovasc Imaging. 2024. PMID: 37902921 Review.
-
A Comprehensive Assessment of Right Ventricular Function in Chronic Thromboembolic Pulmonary Hypertension.J Clin Med. 2022 Dec 21;12(1):47. doi: 10.3390/jcm12010047. J Clin Med. 2022. PMID: 36614845 Free PMC article. Review.
References
-
- Arkles, J. S. , Opotowsky, A. R. , Ojeda, J. , Rogers, F. , Liu, T. , Prassana, V. , Marzec, L. , Palevsky, H. I. , Ferrari, V. A. , & Forfia, P. R. (2011). Shape of the right ventricular Doppler envelope predicts hemodynamics and right heart function in pulmonary hypertension. American Journal of Respiratory and Critical Care Medicine, 183(2), 268–276. - PubMed
-
- Castelain, V. , Hervé, P. , Lecarpentier, Y. , Duroux, P. , Simonneau, G. , & Chemla, D. (2001). Pulmonary artery pulse pressure and wave reflection in chronic pulmonary thromboembolism and primary pulmonary hypertension. Journal of the American College of Cardiology, 37(4), 1085–1092. - PubMed
-
- Chirinos, J. A. , Segers, P. , Gupta, A. K. , Swillens, A. , Rietzschel, E. R. , De Buyzere, M. L. , Kirkpatrick, J. N. , Gillebert, T. C. , Wang, Y. , Keane, M. G. , Townsend R., Ferrari V. A., Wiegers S. E., & St John Sutton M. (2009). Time‐varying myocardial stress and systolic pressure‐stress relationship: role in myocardial‐arterial coupling in hypertension. Circulation, 119(21), 2798–2807. - PubMed
-
- Fukumitsu, M. , Westerhof, B. E. , Ruigrok, D. , Braams, N. , Groeneveldt, J. , Bayoumy, A. , Marcus, J. T. , Meijboom, L. , de Man, F. , Westerhof, N. , Bogaard, H. J. , & Noordegraaf .(2020). Early return of reflected waves increases right ventricular wall stress in chronic thromboembolic pulmonary hypertension. American Journal of Physiology Heart and Circulatory Physiology, 319(6), H1438–H1450 - PubMed
Publication types
MeSH terms
LinkOut - more resources
Full Text Sources
Research Materials