

Trends over two decades in life expectancy with complex health problems among older Swedes: implications for the provision of integrated health care and social care
- PMID: 35421981
- PMCID: PMC9012017
- DOI: 10.1186/s12889-022-13099-8
Trends over two decades in life expectancy with complex health problems among older Swedes: implications for the provision of integrated health care and social care
Abstract
Background: Due to population aging, it is essential to examine to what extent rises in life expectancy (LE) consist of healthy or unhealthy years. Most health expectancy studies have been based on single health measures and have shown divergent trends. We used a multi-domain indicator, complex health problems (CHP), indicative of the need for integrated medical and social care, to investigate how LE with and without CHP developed in Sweden between 1992 and 2011. We also addressed whether individuals with CHP more commonly lived in the community in 2011 compared to earlier years.
Methods: CHP were defined as having severe problems in at least two of three health domains related to the need for medical and/or social care: symptoms/diseases, cognition/communication, and mobility. The Swedish Panel Study of Living Conditions of the Oldest Old (SWEOLD), a nationally representative survey of the Swedish population aged ≥ 77 years with waves in 1992, 2002 and 2011 (n≈2000), was used to estimate the prevalence of CHP. Age- and gender-specific death rates were obtained from the Human Mortality Database. The Sullivan method was deployed to calculate the remaining life expectancy with and without CHP. The estimates were decomposed to calculate the contribution of changes from morbidity and mortality to the overall trends in LE without CHP.
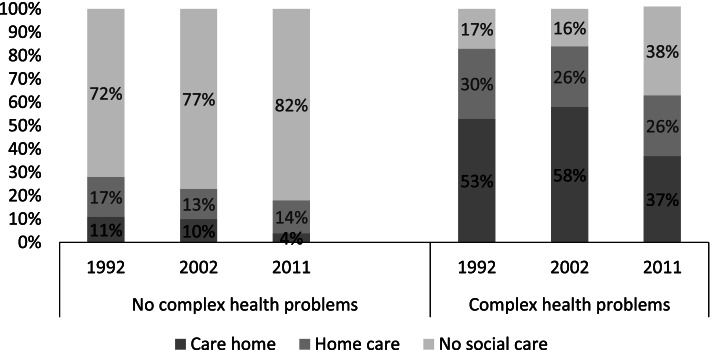
Results: Between 1992 and 2011, both total LE (+ 1.69 years [95% CI 1.56;1.83] and LE without CHP (+ 0.84 years [-0,87;2.55]) at age 77 increased for men, whereas LE at age 77 increased for women (+ 1.33 [1.21;1.47]) but not LE without CHP (-0.06 years [-1.39;1.26]). When decomposing the trend, we found that the increase in LE with CHP was mainly driven by an increase in the prevalence of CHP. Among individuals with CHP the proportion residing in care homes was lower in 2011 (37%) compared to 2002 (58%) and 1992 (53%).
Conclusions: The findings, that an increasing number of older people are expected to live more years with CHP, and increasingly live in the community, point towards a challenge for individuals and families, as well as for society in financing and organizing coordinated and coherent medical and social services.
Keywords: Complex health problems; Health expectancies; Integrated care; Multi-domain health measures; Multimorbidity; Sullivan method.
© 2022. The Author(s).
Conflict of interest statement
The authors declare no conflicts of interest.
Figures

References
-
- Robine JM. Age patterns in adult mortality. In: Rogers RG, Crimmins EM, editors. International handbook of adult mortality. New York: Springer; 2011. pp. 207–226.
-
- Baltes MM. The psychology of the oldest-old: the fourth age. Curr Opin Psychiatry. 1998;11(4):411–415. doi: 10.1097/00001504-199807000-00009. - DOI
