. 2022 Apr 15;17(1):5.
doi: 10.1186/s13064-022-00161-9.

DSCAM is differentially patterned along the optic axon pathway in the developing Xenopus visual system and guides axon termination at the target

Affiliations

DSCAM is differentially patterned along the optic axon pathway in the developing Xenopus visual system and guides axon termination at the target

Rommel Andrew Santos et al. Neural Dev. .

Abstract

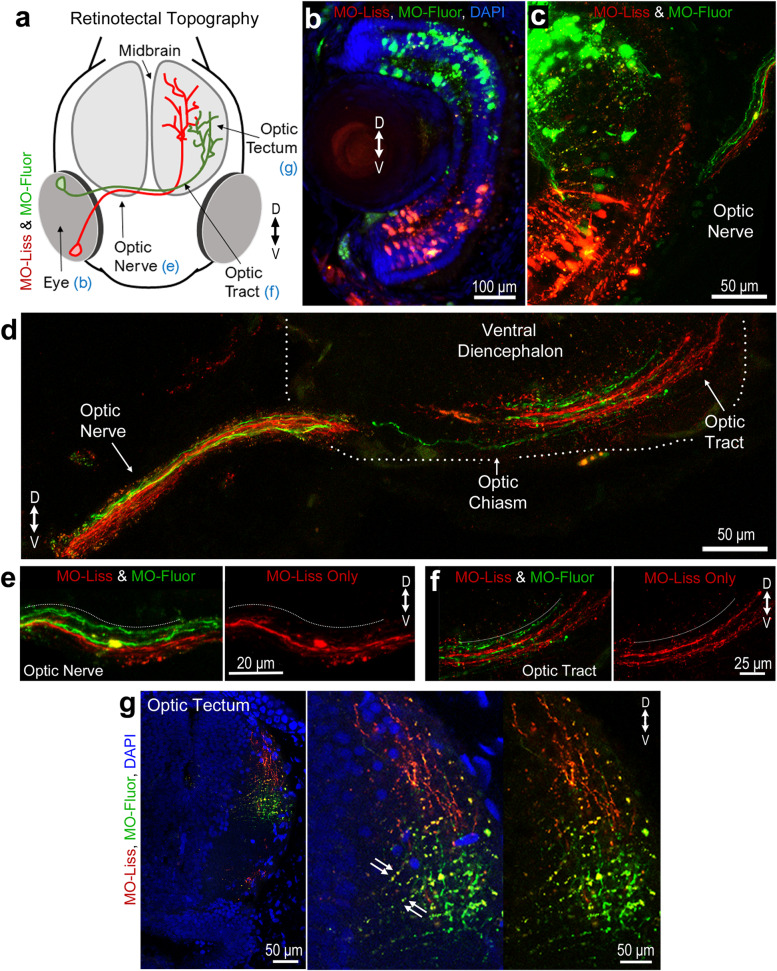
Background: The Xenopus retinotectal circuit is organized topographically, where the dorsal-ventral axis of the retina maps respectively on to the ventral-dorsal axis of the tectum; axons from the nasal-temporal axis of the retina project respectively to the caudal-rostral axis of the tectum. Studies throughout the last two decades have shown that mechanisms involving molecular recognition of proper termination domains are at work guiding topographic organization. Such studies have shown that graded distribution of molecular cues is important for topographic mapping. However, the complement of molecular cues organizing topography along the developing optic nerve, and as retinal axons cross the chiasm and navigate towards and innervate their target in the tectum, remains unknown. Down syndrome cell adhesion molecule (DSCAM) has been characterized as a key molecule in axon guidance, making it a strong candidate involved in the topographic organization of retinal fibers along the optic path and at their target.

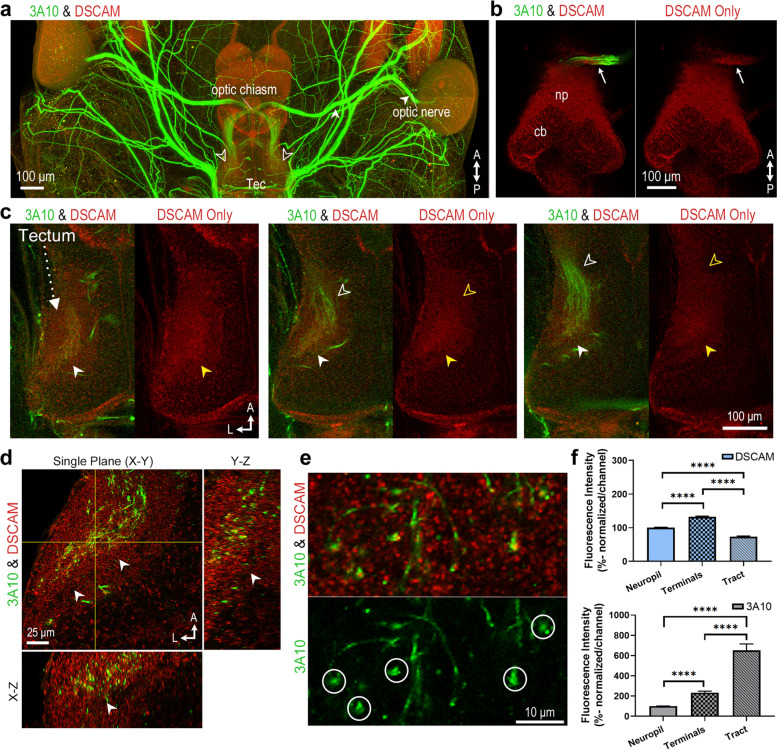
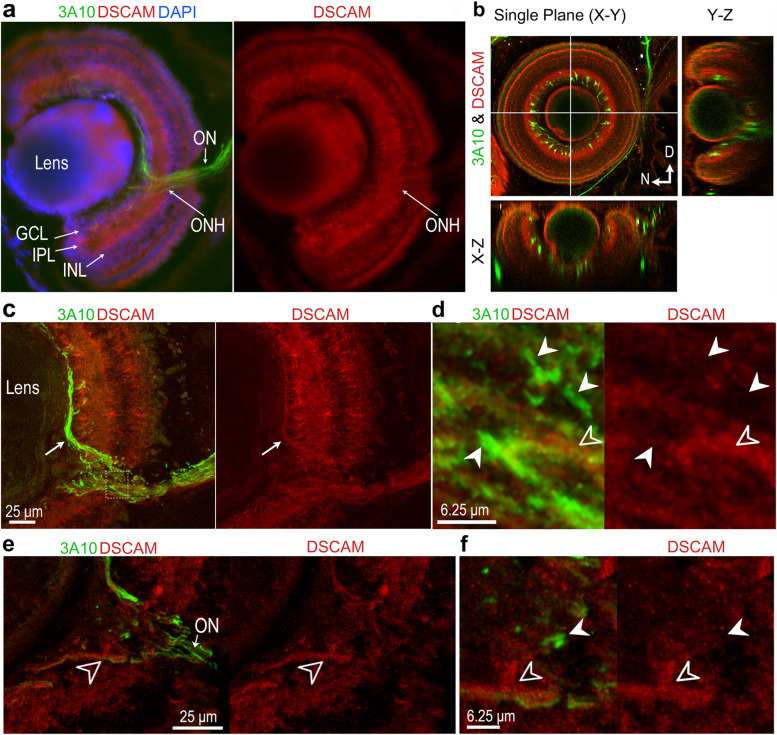
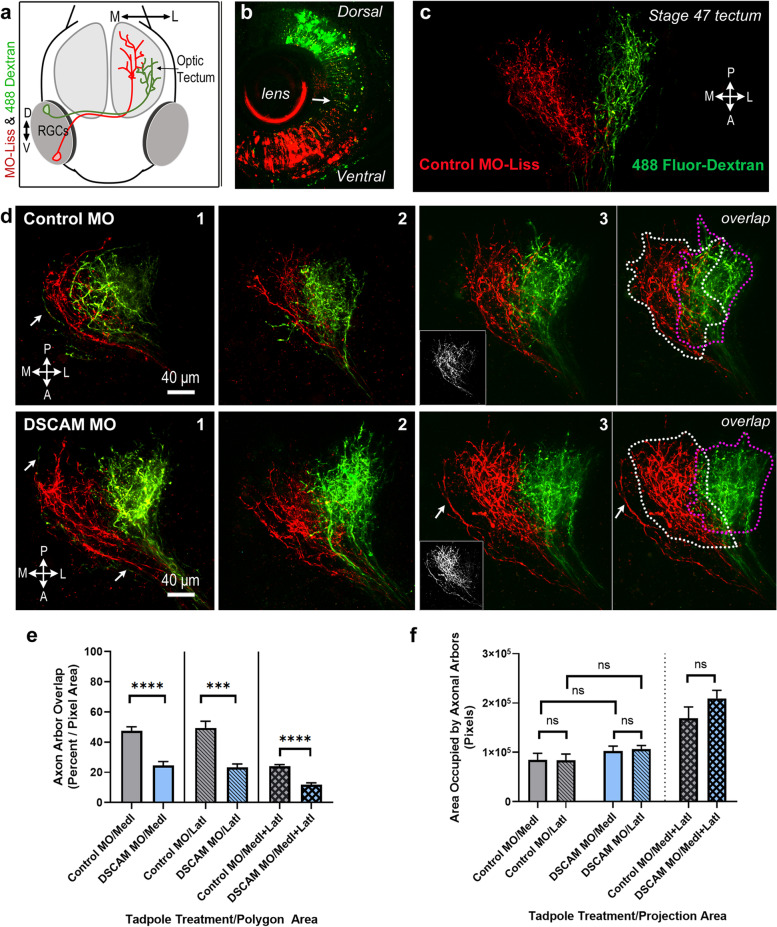
Methods: Using a combination of whole-brain clearing and immunohistochemistry staining techniques we characterized DSCAM expression and the projection of ventral and dorsal retinal fibers starting from the eye, following to the optic nerve and chiasm, and into the terminal target in the optic tectum in Xenopus laevis tadpoles. We then assessed the effects of DSCAM on the establishment of retinotopic maps through spatially and temporally targeted DSCAM knockdown on retinal ganglion cells (RGCs) with axons innervating the optic tectum.

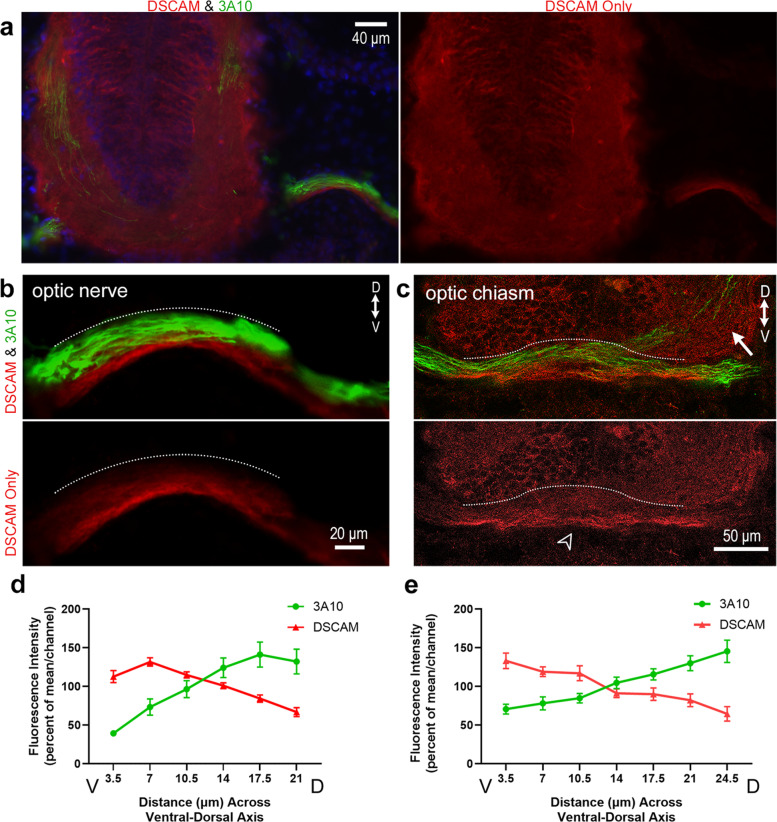
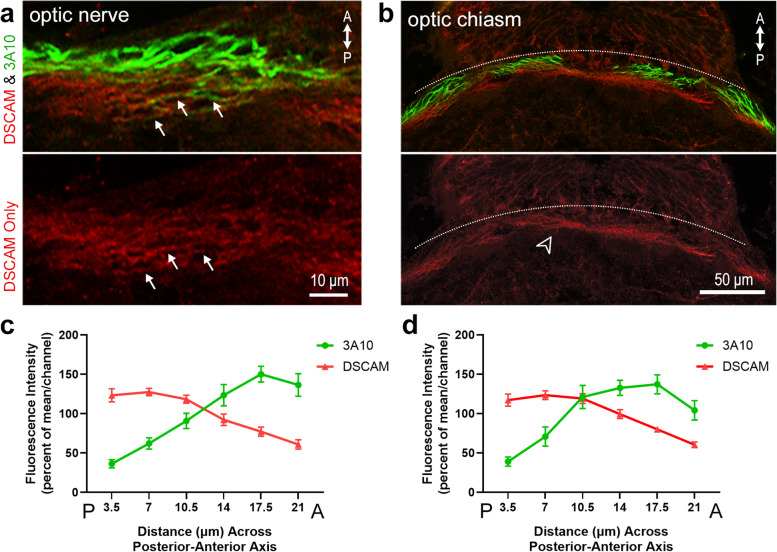
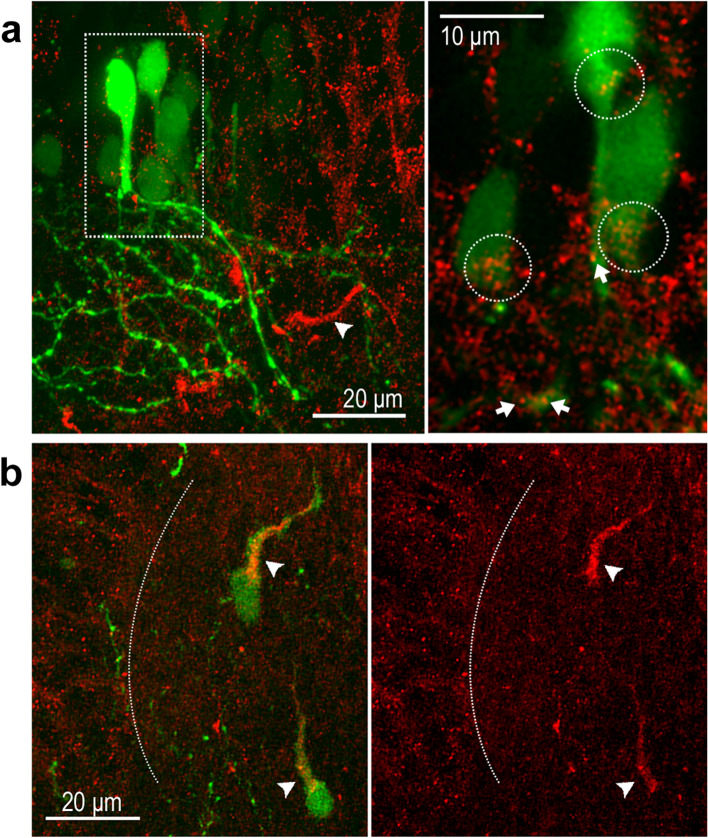
Results: Highest expression of DSCAM was localized to the ventral posterior region of the optic nerve and chiasm; this expression pattern coincides with ventral fibers derived from ventral RGCs. Targeted downregulation of DSCAM expression on ventral RGCs affected the segregation of medial axon fibers from their dorsal counterparts within the tectal neuropil, indicating that DSCAM plays a role in retinotopic organization.

Conclusion: These findings together with previous studies demonstrating cell-autonomous roles for DSCAM during the development of pre- and postsynaptic arbors in the Xenopus retinotectal circuit indicates that DSCAM exerts multiple roles in coordinating axon targeting and structural connectivity in the developing vertebrate visual system.

Keywords: Axon targeting; DSCAM; In vivo imaging; Optic nerve; Optic tectum; Retina; Retinal ganglion cell; Xenopus laevis.


Conflict of interest statement

The authors declare that they have no competing interests.

Figures

Fig. 1
Fig. 1
Distribution of DSCAM in a ventral-to-dorsal gradient along the optic nerve and chiasm of stage 45/46 Xenopus tadpoles. a Coronal section of the Xenopus tectum and optic nerve immunostained with DSCAM (red; right and left panels) and 3A10 anti-neurofilament (green; left panel overlay) antibodies. b Higher magnification image of the optic nerve shows high DSCAM immunoreactivity ventrally along the optic nerve bundle, while 3A10 antibody preferentially stains fibers along the dorsal region of the optic nerve (overlay; white dotted line). c Coronal section at the level of the optic chiasm (white arrowhead), shows DSCAM immunoreactivity localized to fibers at the ventral base of the chiasm (white arrowhead), while 3A10 immunopositive retinal fibers cross the optic chiasm more dorsally (white dotted line). Note the more diffused, punctate DSCAM immunoreactivity in the brain at the level of the optic tract (arrow) where RGC axons begin to defasciculate and project contralaterally past the chiasm. d, e The average fluorescence intensity of DSCAM and 3A10 immunoreactivity was measured along the ventrodorsal axis of the optic nerve and optic chiasm using a 3.5 μm diameter ROI using MetaMorph. Six or seven measurements using the circular region tool were obtained along the ventrodorsal axis, with five sets of measurements obtained at distinct locations along the optic nerve or chiasm (n = 4 tadpoles, with at least two tissue sections per tadpole). d Plotting mean fluorescence intensity (normalized per channel and per sample) along the optic nerve revealed a high-ventral to low-dorsal distribution of DSCAM immunoreactivity while 3A10 immunoreactivity was higher dorsally (difference for Distance p = 0.011; Distance x Fluorescent Channel p ≤ 0.001; two-way ANOVA). e Quantification of the mean fluorescence intensity shows a high-ventral to low-dorsal distribution of DSCAM immunoreactivity at the optic chiasm (difference for Distance p = 0.003; Distance x Fluorescent Channel p ≤ 0.001; two-way ANOVA). Scale bars: 40 μm for a; 20 μm for b, 50 μm c
Fig. 2
Fig. 2
Distribution of DSCAM in the optic nerve and chiasm along the posterior-to-anterior axis of stage 45/46 Xenopus tadpoles. a High magnification horizontal section at the level of the optic nerve shows differential distribution of DSCAM immunoreactivity (red) along retinal axon fibers. A gradual distribution of DSCAM immunoreactive fibers is observed from posterior to anterior while most 3A10 immunopositive fibers localize more anteriorly. White arrows identify a subset of axon fibers within the optic nerve that are immunopositive for both DSCAM and 3A10. b Horizontal section at the level of the optic chiasm imaged by confocal microscopy (stitched tiled scan) shows DSCAM immunoreactivity in fibers that organize caudally (posterior; empty white arrowhead) to most 3A10 immunopositive fibers. c, d Fluorescence intensity of DSCAM (red) and 3A10 (green) immunoreactivity was measured using a 3.5 μm ROI at six positions along the posterior to anterior axis tool as for Fig. 1, with five sets of measurements made at distinct locations along the optic nerve or optic chiasm (n = 4 tadpoles, with at least two tissue sections per tadpole). For each tissue sample, fluorescence intensity was normalized to the mean fluorescence intensity for each channel and is shown as percent of the mean with the x-axis designating the optic nerve or optic chiasm from the posterior to anterior regions. c A high-posterior to low-anterior distribution of DSCAM fluorescent signal is found along the width of the optic nerve, while 3A10 fluorescent signal is higher in the anterior portion of the optic nerve (difference for Distance p = 0.008; Distance x Fluorescent Channel p ≤ 0.0001; two-way ANOVA). d DSCAM and 3A10 fluorescence showed high-posterior to low-anterior DSCAM immunoreactivity within the optic chiasm, while 3A10 immunofluorescent signal was low posterior and increased anteriorly (difference for Distance p = 0.002; Distance x Fluorescent Channel p ≤ 0.0001; two-way ANOVA). Scale bars: 10 μm for a; 50 μm c
Fig. 3
Fig. 3
Visualizing DSCAM expression in cleared Xenopus brain tissues. a, b Whole tissue clearing followed by immunostaining was used to characterize DSCAM expression in intact Xenopus laevis tadpoles. (a) Low-magnification confocal imaging (tiled scan) of a tadpole head shows DSCAM immunoreactivity (red), and 3A10 antibody co-immunostaining (green). Optic nerve fibers (solid white arrowhead) and RGC axon terminals within the tectal neuropil (empty white arrowheads) are visualized by the 3A10 immunostaining. In addition to the optic nerve, the 3A10 antibody stains axonal fibers in sensory and motor cranial nerves. b Individual confocal plane from a z-stack of a brain (imaged ventrally) shows differential distribution of DSCAM and 3A10 immunoreactivity along the optic nerve as it enters the optic chiasm (arrow). DSCAM immunoreactivity also localizes to cell bodies (cb) and neuropil (np). c Individual confocal planes from horizontal z-stacks further illustrate co-localization of DSCAM and 3A10 immunoreactivity in the midbrain neuropil (from dorsal-left to ventral-right). Stronger DSCAM immunoreactivity is observed on the dorsal-most portion of the tectum, where axon terminals extensively branch (solid white and yellow arrowheads). The 3A10 antibody staining also reveals RGC axon fibers as they enter the midbrain (empty arrowheads). d Higher magnification confocal images of dissected brains illustrate strong punctate DSCAM immunoreactivity in the area of the neuropil where axon terminals localize, as identified by the 3A10 immunostaining (arrowheads; yellow lines indicate location of x–z and y–z orthogonal planes, thickness of sample imaged was 85 µm). e Magnified, one-micron z-section of the cleared brain in d reveals coincident punctate DSCAM immunostaining (red) in 3A10-immunolabeled growth cones (green). f The fluorescence intensity of DSCAM (top graph) and 3A10 (bottom graph) immunostaining was measured in whole brain tissues using a 10 μm circular ROI tool and analyzed using MetaMorph, with ten measurements obtained across ten regions each at the level of the lateral neuropil, axon terminals, and axon tract. Measurements were taken from both brain hemispheres equally (n = 4 tadpoles). Data is normalized to the mean fluorescence intensity per channel in the lateral neuropil. Error bars indicate S.E.M. **** p ≤ 0.0001. Scale bars: 100 μm for a, b and c; 25 μm for d; 10 μm for e
Fig. 4
Fig. 4
Differential expression of DSCAM by RGC axon fibers in retina. a Epifluorescent image of a coronal section of a stage 45 tadpole eye immunostained with DSCAM (red; right panel DSCAM only) and 3A10 antibodies (green) shows strong DSCAM immunoreactivity in the in the ganglion cell layer (GCL), inner plexiform layer (IPL) and Inner nuclear layer (INL). 3A10 immunopositive cell bodies are confined to the GCL, adjacent to the IPL. b Frontal and orthogonal confocal views of an eye in a cleared Xenopus tadpole head immunostained with DSCAM (red) and 3A10 anti-neurofilament (green) antibodies shows strong DSCAM immunoreactivity in the GCL and IPL and differential distribution of 3A10 immunoreactivity in a subset of cells in the GCL (lines indicate location of x–z and y–z orthogonal planes, thickness of sample imaged was 296 µm). c Confocal images of a tadpole eye illustrate DSCAM and 3A10 immunoreactivity at the level of the optic fiber layer (arrow) within the retina and in the optic nerve head (box). d The magnified images (box in c) show a subset of 3A10-immunopositive axon fibers (white arrowheads) that do not express DSCAM (left panel, 3A10 and DSCAM overlap; right panel, DSCAM only). e, f A single confocal plane shows coincident immunoreactivity for DSCAM and 3A10 (empty arrowheads) in ventral fibers along the optic nerve head, as also illustrated in d (empty arrowhead). Scale bars are as shown for each image
Fig. 5
Fig. 5
Topographic organization of retinal axon fibers along the developing Xenopus retinotectal path. a Schematic representation of the developing tadpole visual system and of experimental design. b Coronal section of a stage 46 tadpole eye shows localization of a lissamine-tagged control MO (red) after electroporation into the ventral half of the retina and fluorescein-tagged control MO into the dorsal half (green). c, d High magnification confocal images show the trajectories of lissamine-tagged RGCs axon fibers and fluorescein-tagged control MO labeled axon fibers as they exit the eye c and along the optic nerve, chiasm, and optic tract d. Note the topography of RGCs in the eye and their spatial arrangement along the optic nerve and chiasm, where axon fibers from ventral RGCs labeled by the lissamine tag travel along the ventral side of the optic nerve and chiasm while axons of RGCs labeled fluorescein-tagged control MO travel along the dorsal side of the optic nerve. d, e, f Lissamine MO-labeled axon fibers that were originally positioned on the ventral side of the optic nerve are positioned more dorsally after crossing the optic chiasm. In contrast, fluorescein MO-labeled axon fibers that originate in the dorsal portion of the retina shift more ventrally. In the stitched tiled image in d, the ventral tissue border of the brain is demarcated by the dashed line. g At the optic tectum, the lissamine-labeled RGC axon fibers localize to the dorsal branch while the fluorescein-tagged control MO-labeled axon fibers localize ventrally. Small double arrows in the magnified image point to fluorescent debris picked by glial cells. Scale bars: 100 μm for b; 50 μm for c, d, and g; 20 μm for e; 25 μm for f
Fig. 6
Fig. 6
DSCAM impacts the topographic organization of ventral RGC axon fibers branching at the target. a Schematic illustrates the sequential electroporation of ventral RGCs with lissamine-tagged control or DSCAM MO, and dorsal RGCs with Alexa Fluor 488-dextran. b Coronal section of a stage 46 tadpole eye shows the distribution of the lissamine-tagged MO and Alexa Fluor 488-dextran after electroporation. Arrow points to fluorescent debris picked by glial cells. c Confocal projection of axon terminals of a tadpole transfected at stage 47 and imaged in vivo 48 h after transfection illustrates the organization of retinal fibers along the medial to lateral axis. Control MO lissamine-tagged axons (red) from ventral RGC terminate medially (M) within the tectal neuropil while Alexa Fluor 488 dextran-labeled axons (green) from dorsal RGCs terminate more laterally (L) with little to no overlap. d Confocal projections of axon terminals from three sample tadpoles with ventral RGCs transfected with lissamine-tagged Control MO or DSCAM MO (red) at stage 46 and imaged 48 h after transfection show some degree of overlap between RGC axons labeled with Alexa Fluor 488 dextran (green) and MO-transfected RGC axons (red). Single channel fluorescent signals for arbors of ventral RGC transfected with Control MO and DSCAM MO are shown in the insets. Transfection of DSCAM MO in ventral RGCs resulted in their axons projecting medially (red) but with less overlap than those in Control MO transfected tadpoles. e, f Quantitative analysis of the territory occupied by dorsal and ventral RGCs axons within the tectal neuropil in tadpoles transfected with either DSCAM MO or Control MO and imaged 48 h later. The area occupied by the ventral or dorsal RGC axon terminals was measured by separately creating a polygon surrounding the first branch point and the terminal tips of the lissamine-labeled arbors (red only; see white dashed line in d) or the Alexa 488-labeled arbors (green only; see magenta dashed lines in d). Isolated, unbranched axons that project medially (arrows in d) were not included in the analysis. e A significant difference in the area of arbor overlap is observed when comparing axon arbors from ventral RGCs that project medially in DSCAM MO vs Control MO treated tadpoles. Data was normalized across tadpole samples by calculating, in percent, the area of overlap with respect to the region occupied by the medial (red fluorescence), lateral (green fluorescence) and medial + lateral (red and green fluorescence) axons. f When comparing tadpoles treated with DSCAM MO vs Control MO (targeted to ventral RGCs), no difference in the area occupied by arbors from ventral RGCs that project medially or regions occupied by dorsal RGCs axons that project laterally. Statistical analysis was by unpaired, two-tailed t test with equal sample sizes (n = 8) for Control MO and DSCAM MO. Error bars indicate S.E.M. *** p ≤ 0.001, **** p ≤ 0.0001, ns = non-significant. Scale bars: 40 μm
Fig. 7
Fig. 7
Localized DSCAM immunoreactivity to primary process and cell bodies within the tectum and tectal neuropil. Electroporation with a CMV-driven GFP expression plasmid was used to randomly label neurons in young embryos. Coronal sections from stage 46 tadpoles with GFP-positive cells were immunostained for DSCAM. a Left panel: A maximum confocal projection at the level of the midbrain shows GFP positive neurons immunostained for DSCAM. Right panel: A large magnification of a single confocal plane (white box; left panel), shows punctate DSCAM immunoreactivity localized on cell bodies of tectal neurons (white dotted circles) as well as on primary dendrites and dendritic branches (white arrows). Note that strong DSCAM immunolabeled fibers are present near dendrites of GFP labeled neurons, as shown in the low magnification image (arrowhead). b Analysis of tissues with low-yield, random GFP transfection revealed that strong DSCAM immunoreactivity localizes to primary processes of GFP-expressing simple cells within the tectal neuropil (arrowhead). The white dotted line indicates the boundary between the cell body layer and the neuropil. Scale bars: 20 μm for a and b; 10 μm for the magnified view of panel a

Similar articles

Cited by

References

    1. Wang L, Marquardt T. What axons tell each other: axon–axon signaling in nerve and circuit assembly. Curr Opin Neurobiol. 2013;23(6):974–982. doi: 10.1016/j.conb.2013.08.004. - DOI - PubMed
    1. Feldheim DA, O’Leary DDM. Visual Map Development: Bidirectional Signaling, Bifunctional Guidance Molecules, and Competition. Cold Spring Harb Perspect Biol. 2010;2(11):a001768. - PMC - PubMed
    1. Luo L, Flanagan JG. Development of Continuous and Discrete Neural Maps. Neuron. 2007;56(2):284–300. doi: 10.1016/j.neuron.2007.10.014. - DOI - PubMed
    1. Mann F, Ray S, Harris W, Holt C. Topographic mapping in dorsoventral axis of the Xenopus retinotectal system depends on signaling through ephrin-B ligands. Neuron. 2002;35(3):461–473. doi: 10.1016/S0896-6273(02)00786-9. - DOI - PubMed
    1. Dickson BJ. Molecular Mechanisms of Axon Guidance. Science. 2002;298(5600):1959. doi: 10.1126/science.1072165. - DOI - PubMed

Publication types