. 2022 Apr 15;7(1):103.
doi: 10.1038/s41392-022-00933-z.

PINK1-mediated Drp1S616 phosphorylation modulates synaptic development and plasticity via promoting mitochondrial fission

Affiliations

PINK1-mediated Drp1S616 phosphorylation modulates synaptic development and plasticity via promoting mitochondrial fission

Qingtao Gao et al. Signal Transduct Target Ther. .

Abstract

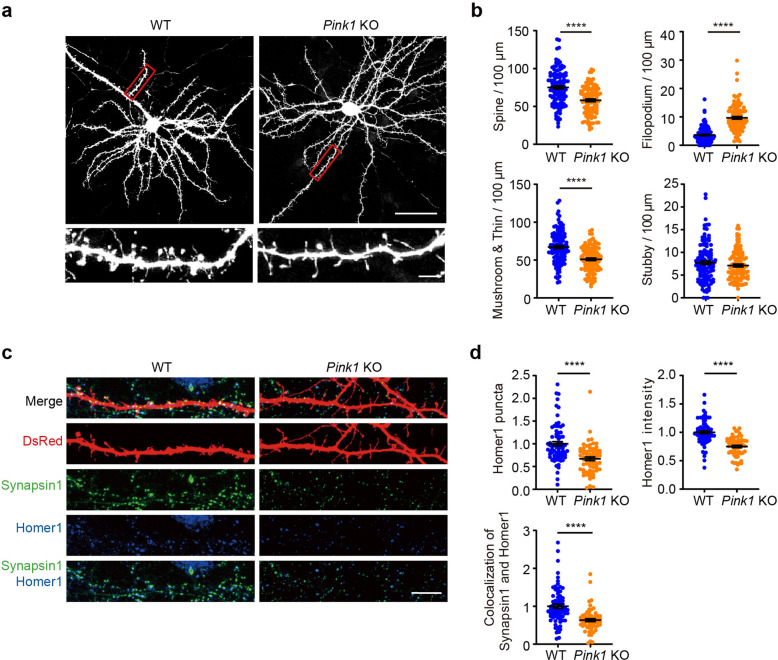
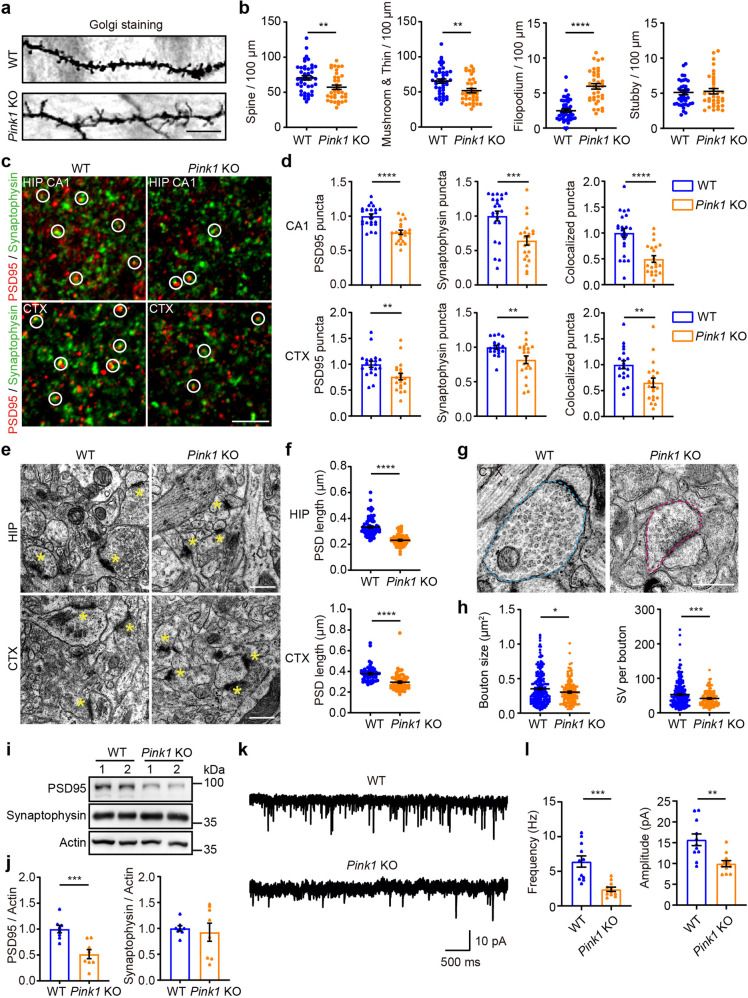
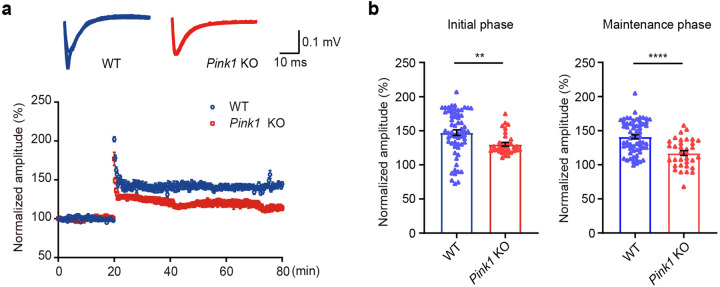
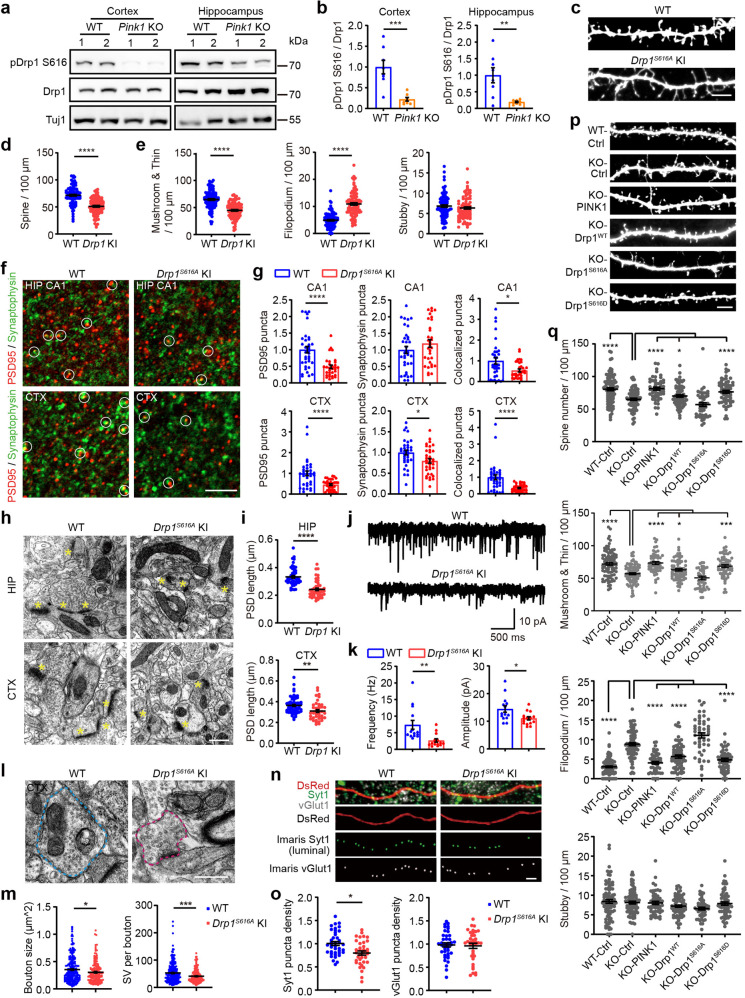
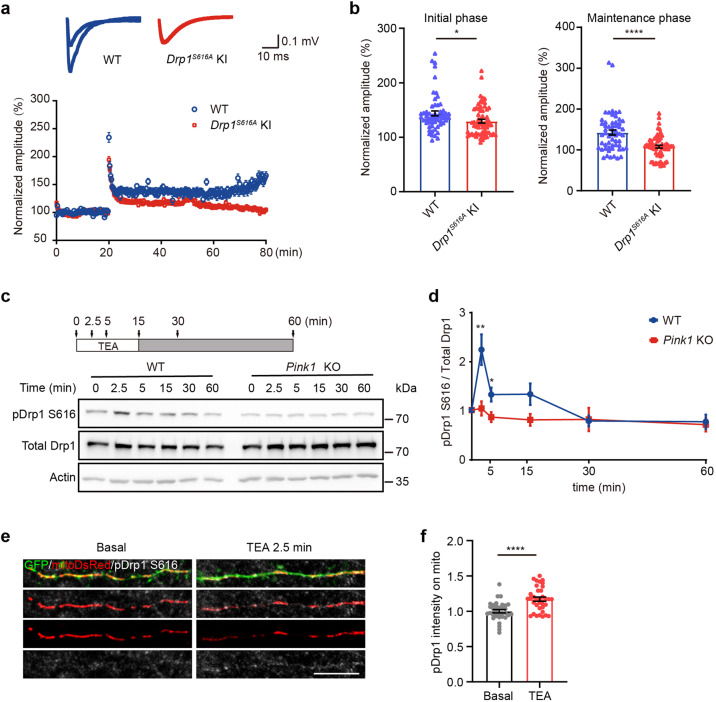
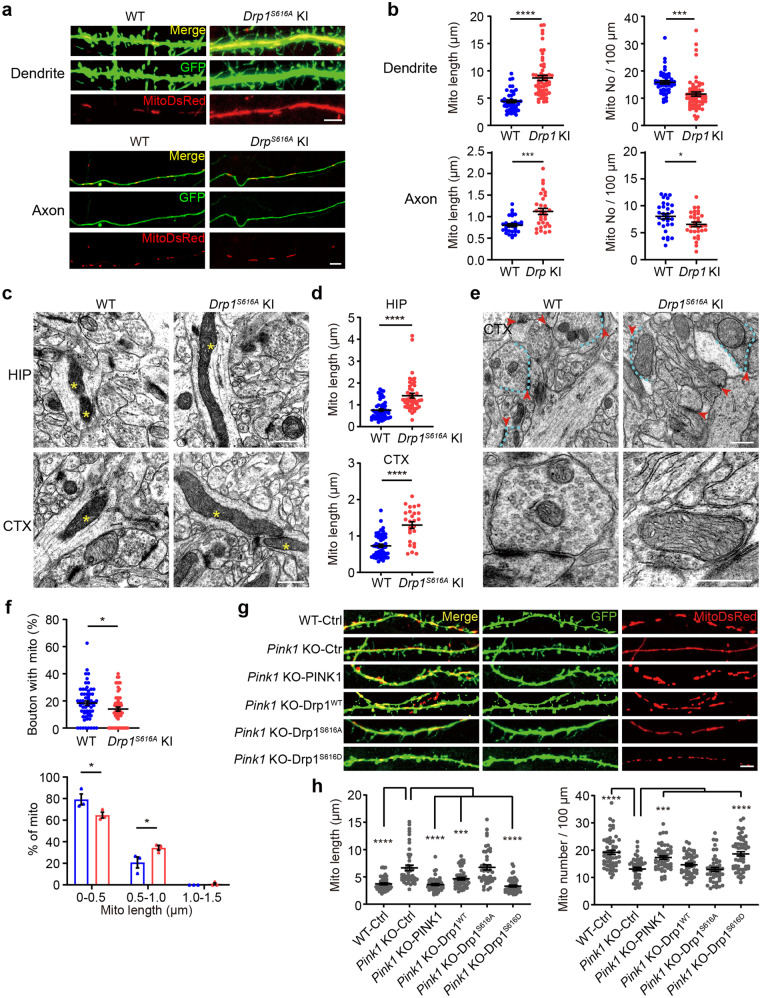
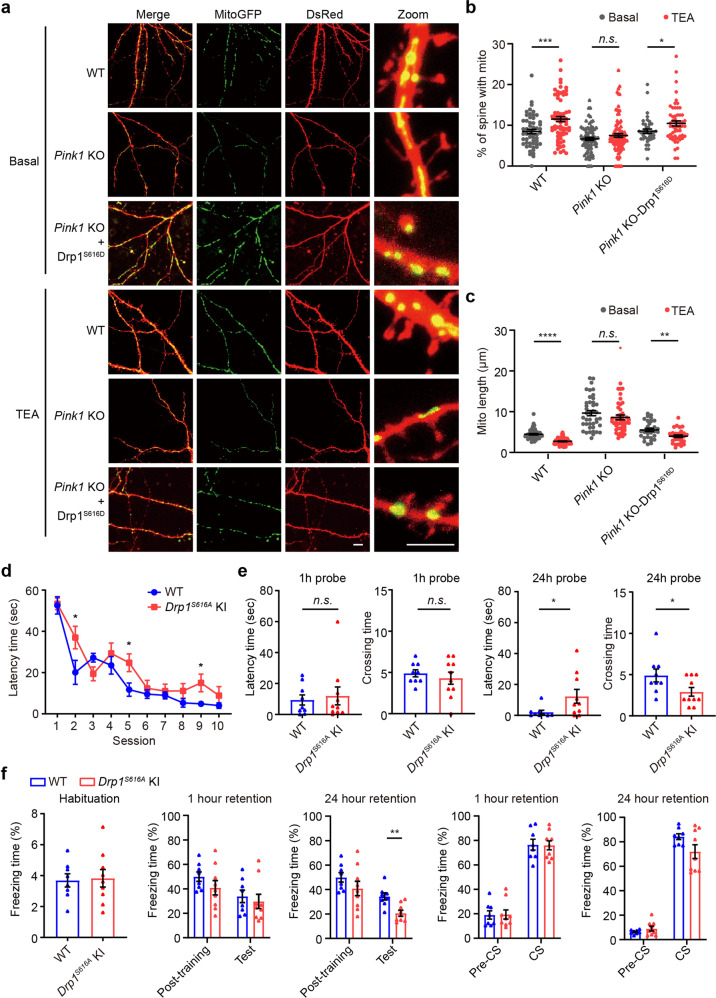
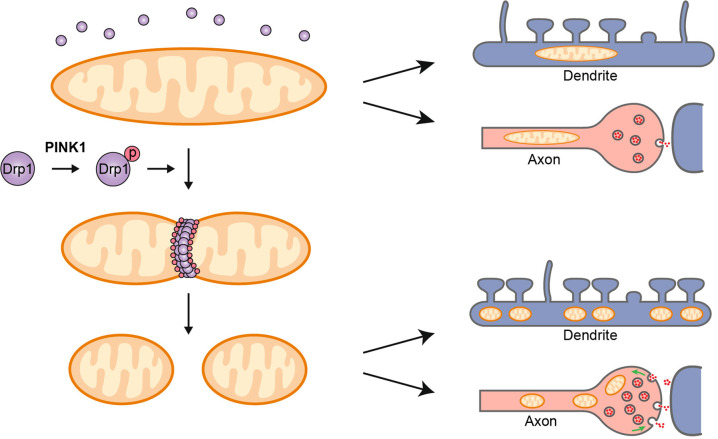
Dynamic change of mitochondrial morphology and distribution along neuronal branches are essential for neural circuitry formation and synaptic efficacy. However, the underlying mechanism remains elusive. We show here that Pink1 knockout (KO) mice display defective dendritic spine maturation, reduced axonal synaptic vesicles, abnormal synaptic connection, and attenuated long-term synaptic potentiation (LTP). Drp1 activation via S616 phosphorylation rescues deficits of spine maturation in Pink1 KO neurons. Notably, mice harboring a knockin (KI) phosphor-null Drp1S616A recapitulate spine immaturity and synaptic abnormality identified in Pink1 KO mice. Chemical LTP (cLTP) induces Drp1S616 phosphorylation in a PINK1-dependent manner. Moreover, phosphor-mimetic Drp1S616D restores reduced dendritic spine localization of mitochondria in Pink1 KO neurons. Together, this study provides the first in vivo evidence of functional regulation of Drp1 by phosphorylation and suggests that PINK1-Drp1S616 phosphorylation coupling is essential for convergence between mitochondrial dynamics and neural circuitry formation and refinement.


Conflict of interest statement

The authors declare no competing interests.

Figures

Fig. 1
Fig. 1
PINK1 regulates dendritic spine development and enrichment of synaptic proteins. a Cortical neurons (DIV 6–8) derived from WT or Pink1 KO mice were transfected with plasmid encoding EGFP and imaged at DIV 18. Representative images of neurons with low magnification (top, Bar = 50 μm) and neurites with higher magnification of gated areas (bottom, Bar = 5 μm) were shown. b Quantification of the density of dendritic protrusions and proportion of different types of protrusions for experiments presented in a. n = 116 and 109 dendrites for WT and Pink1 KO from three independent experiments, respectively. c Cortical neurons (DIV 6–8) derived from WT or Pink1 KO mice were transfected with DsRed plasmid followed by staining at DIV 18. Representative images of neurons were stained with antibodies against Homer1 (blue) or Synapsin1 (green). Bar = 10 μm. d Quantification of normalized synaptic puncta density or fluorescence intensity of dendritic Homer1 and colocalization of Synapsin1 and Homer1 for experiments shown in c. n = 76 and 65 dendrites for WT and Pink1 KO from three independent experiments, respectively. All data were normalized with the mean value of WT dendrites in each repeat. ****P < 0.0001. Student’s t-test
Fig. 2
Fig. 2
PINK1 regulates excitatory neuronal connections in the cortex and hippocampus. a Representative images of Golgi staining of somatosensory cortex layer 2/3 neurons from P14 WT and Pink1 KO mice. Bar = 10 μm. b Quantitation of protrusion density at secondary apical dendrites of neurons for experiments presented in a. n = 43 and 36 dendrites from three WT and three Pink1 KO mice, respectively. c Representative images of PSD95 and synaptophysin in 8-week-old WT or Pink1 KO mice. Hippocampal CA1 stratum radiatum (HIP CA1) or somatosensory cortex layer 2/3 (CTX) were stained with PSD95 (red) and synaptophysin (green) and imaged. White circles indicate colocalized PSD95 and synaptophysin puncta. Bar = 5 μm. d Quantification of normalized synaptic puncta density for experiments presented in c using Imaris software. Puncta were reconstructed using Imaris “spot” function. Colocalized PSD95 and synaptophysin puncta were calculated. Four to five brain sections of each mouse from four WT and four Pink1 KO mice were analyzed. e Representative TEM images of hippocampus CA1 (HIP CA1) and somatosensory cortex (CTX) of 8-week-old WT or Pink1 KO mice. Synapses are marked by asterisks. Bar = 0.5 μm. f Quantitation of PSD length of experiments presented in e. HIP: n = 75 sections from three WT mice, n = 65 sections from three Pink1 KO mice; CTX: n = 54 and 72 sections from three WT and three Pink1 KO mice, respectively. g Representative TEM images of presynaptic boutons in the somatosensory cortex of 8-week-old WT and Pink1 KO mice. Blue dash-line frame: presynaptic bouton with mitochondria. Magenta dash-line frame: presynaptic bouton without mitochondria. Bar = 0.5 μm. h Quantitation of bouton size and the number of synaptic vesicles per bouton of experiments presented in g. n = 238 and 143 synapses from three WT and two Pink1 KO mice, respectively. i Immunoblots of PSD95 and synaptophysin of crude synaptosome fraction extracted from WT and Pink1 KO cortical tissues. Actin is detected as a loading control. j Quantitative analysis of synaptic proteins for experiments shown in i. n = 8 mice per genotype. k Representative traces of mEPSCs recorded from somatosensory cortex layer 2/3 neurons of 8-week-old WT and Pink1 KO mice. l Quantitation of mEPSCs frequencies and amplitudes for experiments shown in k. Eleven cells from three WT and 11 cells from five Pink1 KO mice were analyzed. *P < 0.05, **p < 0.01, ***p < 0.001, ****p < 0.0001. Student’s t-test
Fig. 3
Fig. 3
PINK1 is essential for LTP induction and maintenance. LTP was induced at the Schaffer collateral-CA1 synapses of acute hippocampal slices from 8-week-old WT (blue) and Pink1 KO mice (red). Amplitudes of the fEPSPs evoked by TBS stimulation were normalized to the baseline (defined as 100%). Representative traces are fEPSPs at the basal line and 55 min after TBS (a). Quantitative analysis is shown (b). Note that PINK1 deficiency impaired TBS-induced LTP at Schaffer collateral-CA1 synapses in both initial (0–10 min post-TBS) and maintenance phase (40–60 min post-TBS). n = 63 and 34 recording for five WT and five Pink1 KO mice, respectively. **p < 0.01, ****p < 0.0001. Student’s t-test
Fig. 4
Fig. 4
Phosphorylation of Drp1S616 mediates the PINK1 effect on synapse maturation. a Representative immunoblots of phosphorylated Drp1S616 (pDrp1 S616) of crude synaptosome fraction extracted from cortex and hippocampus of WT and Pink1 KO tissues (P16.5). Total Drp1 (Drp1) and neuronal marker Tuj1 were immunodetected as controls. b Quantitation analysis of experiments presented in a. n = 8 mice/genotype. **P < 0.01, ***P < 0.001. Student’s t-test. c Representative images of dendritic spines of cortical neuronal cultures derived from WT or Drp1S616A KI mice. Bar = 5 μm. d, e Quantification of protrusions for experiments presented in c. n = 93–98 dendrites/condition from three independent experiments. ****P < 0.0001. Student’s t-test. f Representative images of PSD95 (red) and synaptophysin (green) puncta in hippocampal CA1 stratum radiatum (CA1) or layer 2/3 of somatosensory cortex (CTX) of 8-week-old WT or Drp1S616A KI mice. White circles indicate colocalized PSD95 and synaptophysin puncta. Bar = 5 μm. g Quantitation of synaptic puncta density for experiments presented in f using Imaris software. Five to six brain sections of each mouse from six WT and six Drp1S616A KI mice were analyzed. *P < 0.05, ****P < 0.0001. Student’s t-test. h Representative TEM images of hippocampal CA1 (HIP) and somatosensory cortex (CTX) from WT and Drp1S616A KI mice. Synapses are marked by yellow asterisks. Bar = 0.5 μm. i Quantitation of PSD length for experiments presented in h. HIP: n = 49 sections from five WT, n = 48 sections from five Drp1S616A KI; CTX: n = 64 sections from five WT, n = 41 sections from five Drp1S616A KI. **P < 0.01, ****P < 0.0001. Student’s t-test. j Representative traces of mEPSCs recorded from somatosensory cortex layer 2/3 neurons of 8-week-old Drp1S616A KI mice and their WT littermates. k Quantitation of mEPSCs frequencies and amplitudes for experiments shown in j. n = 14 and 15 cells from five WT and five Drp1S616A KI mice, respectively. *P < 0.05, **P < 0.01. Student’s t-test. l Representative TEM images of presynaptic boutons in the somatosensory cortex of WT and Drp1S616A KI mice. Blue dash lines: presynaptic bouton with mitochondria. Magenta dash lines: presynaptic bouton without mitochondria. Bar = 0.5 μm. m Quantitation of bouton size and synaptic vesicles per bouton for experiments presented in l. n = 238 and 180 from three WT and four Drp1S616A KI mice, respectively. *P < 0.05, ***P < 0.001. Student’s t-test. n Cortical neurons (DIV 14) derived from WT or Drp1S616A KI mice were transfected with plasmid encoding DsRed followed by immunodetection of synaptotagmin 1(Syt1) and vGlut1 at DIV 18. Representative images of Syt1-positive puncta (green, Syt1), vGlut1-positive puncta (gray, vGlut1), and axon (red, DsRed) were shown. Imaris software processed Syt1 staining (green, Imaris Syt1) and Imaris software processed vGlut1 staining (white, Imaris vGlut1) on axons were shown. Bar = 2 μm. o Quantification of the density of Synaptotagomin 1 and vGlut1 for experiments presented in n. The puncta density represents counts of puncta divided by the length of axons (>50 μm). n = 40 (WT) and 36 (Pink1 KO) axons collected from three independent experiments. All data were normalized with the mean value of WT axons of each experiment. *P < 0.05. Student’s t-test. p Cortical neurons derived from Pink1 KO mice were co-transfected a plasmid encoding EGFP (Pink1 KO-Ctrl) with plasmids encoding either PINK1 (Pink1KO-PINK1), Drp1 (Pink1 KO-Drp1WT), Drp1 S616A mutant (Pink1 KO-Drp1S616A), or Drp1 S616D mutant (Pink1 KO-Drp1S616D). Neurons derived from WT mice transfected with EGFP were included as a control (WT-Ctrl). Representative images of dendritic spines were shown. Bar = 5 μm. q Quantification of the proportion of different protrusions for experiments presented in p. n > 48 dendrites from three independent experiments per condition. *P < 0.05, ***P < 0.001, ****P < 0.0001. Student’s t-test
Fig. 5
Fig. 5
PINK1-mediated Drp1S616 phosphorylation is required for LTP induction. a LTP was induced at the Schaffer collateral-CA1 synapses of acute hippocampal slices from 2-month-old WT (blue) and Drp1S616A KI (red) mice. Amplitudes of the fEPSPs evoked by TBS were normalized to the baseline (defined as 100%). Representative traces are fEPSPs at the basal line and 55 min after TBS. b Quantitation of induced fEPSPs at initial (0–10 min after TBS) and maintenance phase (40–60 min after TBS) of WT (blue) and Drp1S616A KI (red) mice. n = 57 and 63 recordings of 5–6 WT and Drp1S616A KI mice, respectively. *P < 0.05, ****P < 0.0001. Student’s t-test. c Cortical neurons (DIV 18) derived from WT or Pink1 KO mice were treated with 25 mM TEA for 2.5, 5, and 15 min (arrows, open bar, upper panel). After 15 min treatment, TEA was washed, neurons were harvested at the indicated time (arrows, filled bar, upper panel). Levels of phosphor-Drp1S616 (pDrp1 S616), total Drp1, and actin were shown (lower panel). d Quantitative analysis of phosphor-Drp1S616 normalized with total Drp1 for experiments presented in c. WT: blue. Pink1 KO: red. n = 7–12 treatment. *P < 0.05, **P < 0.01. Multiple t-test. e Cortical neurons (DIV 10) derived from WT mice were expressing mitoDsRed (red) and GFP (green). At DIV 18, neurons were treated with either solvent (Basal) or 25 mM TEA for 2.5 min, fixed, and stained with anti-pDrp1S616 antibody (gray). Representative images of pDrp1S616 and mitochondria were shown. Bar = 10 μm. f Quantitation of pDrp1 S616 intensity on mitochondria. Mitochondria were reconstructed by Imaris. The mean intensity of pDrp1S616 on mitochondria was calculated. Data were normalized with the mean value of pDrp1S616 intensity of the Basal group in the experiment. n = 34 and 35 dendrites from Basal and TEA group of three independent experiments. ****P < 0.0001. Student’s t-test
Fig. 6
Fig. 6
PINK1-mediated Drp1S616 phosphorylation regulates mitochondrial dynamics during synapse maturation. a Cortical neurons (DIV 6-8) derived from WT and Drp1S616A KI mice were transfected with plasmids encoding MitoDsRed (red) and EGFP (green) followed by fixation at DIV 18. Merged images are shown in the top panels. Bar = 5 μm. b Quantitation of dendritic and axonal mitochondrial length (Mito length) and number (Mito No) for experiments present in a. n = 45–58 dendrites/genotype and 30 axons/genotype from three independent experiments per condition. *P < 0.05, ***p < 0.001, ****p < 0.0001. Student’s t-test. c Representative TEM images of dendritic mitochondria (yellow asterisks) from hippocampal CA1 (HIP) and somatosensory cortex (CTX) of 8-week-old WT and Drp1S616A KI mice. Bar = 0.5 μm. d Quantitation analysis of dendritic mitochondrial length for experiments presented in c. HIP: n = 56 and 47 sections from three to four WT and Drp1S616A KI mice, respectively; CTX: n = 51 and 26 sections from three to four WT and Drp1S616A KI, respectively. ****P < 0.0001. Student’s t-test. e Representative TEM images of synapses and presynaptic mitochondria in somatosensory cortex sections of 8-week-old WT and Drp1S616A KI mice. Blue dash lines: presynaptic bouton with mitochondria. Red arrows: synapse with postsynaptic density structure (upper panels). Amplified images were also shown (lower panels). Bar = 0.5 μm. f Quantitative analysis of presynaptic bouton with mitochondria (Bouton with mito) and presynaptic mitochondrial sizes (% of mito). Presynaptic bouton with mitochondria was analyzed for 62 sections from three WT and 59 sections from three Drp1S616A KI mice. The mitochondrial size was done with 80 mitochondria for three WT and 72 mitochondria for three Drp1S616A KI mice. *P < 0.05. Student’s t-test. g Cortical neurons derived from Pink1 KO mice were co-transfected with plasmids encoding MitoDsRed (Red), EGFP (Green), and either empty plasmid (Pink1 KO-Ctrl), PINK1 (Pink1 KO-PINK1), Drp1 (Pink1 KO-Drp1WT), Drp1 S616A mutant (Pink1 KO-Drp1S616A), or Drp1 S616D mutant (Pink1 KO-Drp1S616D) at DIV 6-8, followed by imaging at DIV 18. Neurons derived from WT mice co-transfected with plasmids encoding MitoDsRed and EGFP were included as a control (WT-Ctrl). Representative images of dendritic spines and corresponding mitochondria in transfected neurons are shown. Bar = 5 μm. h Quantitation analysis of dendritic mitochondrial length (Mito length) and dendritic mitochondrial number for experiments presented in g. n = 45–55 dendrites/condition from three independent experiments. ***P < 0.001, ****P < 0.0001. One-way ANOVA followed by Dunnett’s multiple comparison test
Fig. 7
Fig. 7
Phosphor-Drp1S616 regulates mitochondrial redistribution in dendrites and spatial and fear memory. a Cortical neurons (DIV 6–8) derived from WT or Pink1 KO mice were co-transfected with plasmids encoding MitoGFP (Green) and DsRed (red), along with a plasmid encoding Drp1 S616D mutant (Drp1S616D). Representative images of dendrites with mitochondria in transfected neurons were shown. Amplified images of each transfection were included (Zoom). Bar = 10 μm. b Quantitation of dendritic spines with mitochondria in each condition for experiments presented in a. n = 31–96 dendrites/condition from three independent experiments. *p < 0.05, ***p < 0.001, n.s. not significant. Student’s t-test. c Quantitative analysis of mitochondrial length (Mito length) in dendrites from experiments shown in a. n = 30–54 dendrites/condition from three independent experiments. **p < 0.01, ****p < 0.0001, n.s. not significant. Student’s t-test. d Spatial learning curves during Morris water maze (MWM) training of WT (blue) and Drp1S616A KI mice (red). n = 9–10 mice/genotype. e Quantification of latency time and crossing time for 1-h-probe and 24-h-probe trials. n = 9–10 mice/genotype. f Freezing time of WT (blue bar) and Drp1S616A KI (red bar) mice in the contextual or cued fear memory test. n = 8–9 mice/genotype. *p < 0.05, **p < 0.01. Student’s t-test
Fig. 8
Fig. 8
Schematic illustration of PINK1-mediated Drp1S616 phosphorylation to regulate synaptic transmission and plasticity via mitochondrial fission. Fused mitochondria (left top panel) become fissed (left bottom panel) via a PINK1/phosphor-Drp1S616 mediated mechanism (left middle panel). Fused mitochondria are difficult to traffic to presynaptic terminals and dendrites (right upper panel) compared to fissed mitochondria (right lower panel)

References

    1. Mattson MP, Gleichmann M, Cheng A. Mitochondria in neuroplasticity and neurological disorders. Neuron. 2008;60:748–766. - PMC - PubMed
    1. Flippo KH, Strack S. Mitochondrial dynamics in neuronal injury, development and plasticity. J. Cell Sci. 2017;130:671–681. - PMC - PubMed
    1. Dorn GW., 2nd Evolving concepts of mitochondrial dynamics. Annu. Rev. Physiol. 2019;81:1–17. - PubMed
    1. Sheng ZH. Mitochondrial trafficking and anchoring in neurons: new insight and implications. J. Cell Biol. 2014;204:1087–1098. - PMC - PubMed
    1. Li Z, Okamoto K, Hayashi Y, Sheng M. The importance of dendritic mitochondria in the morphogenesis and plasticity of spines and synapses. Cell. 2004;119:873–887. - PubMed