. 2022 Apr 14;12(4):64.
doi: 10.1038/s41408-022-00663-z.

Validation of a small molecule inhibitor of PDE6D-RAS interaction with favorable anti-leukemic effects

Affiliations

Validation of a small molecule inhibitor of PDE6D-RAS interaction with favorable anti-leukemic effects

Sara Canovas Nunes et al. Blood Cancer J. .

Abstract

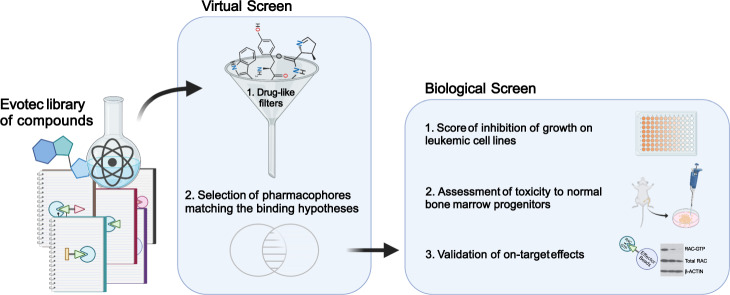
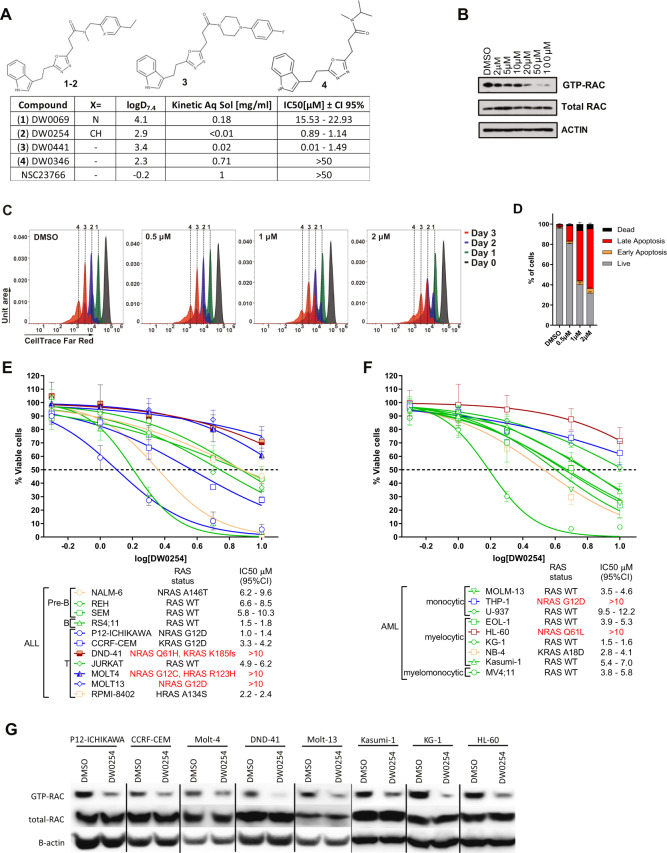
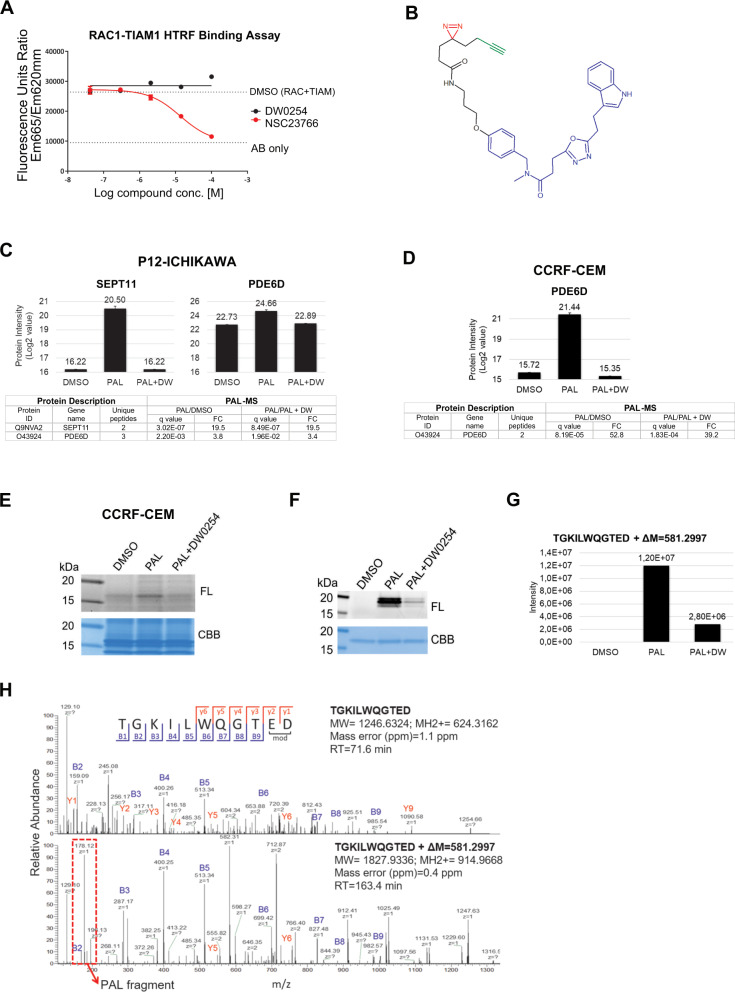
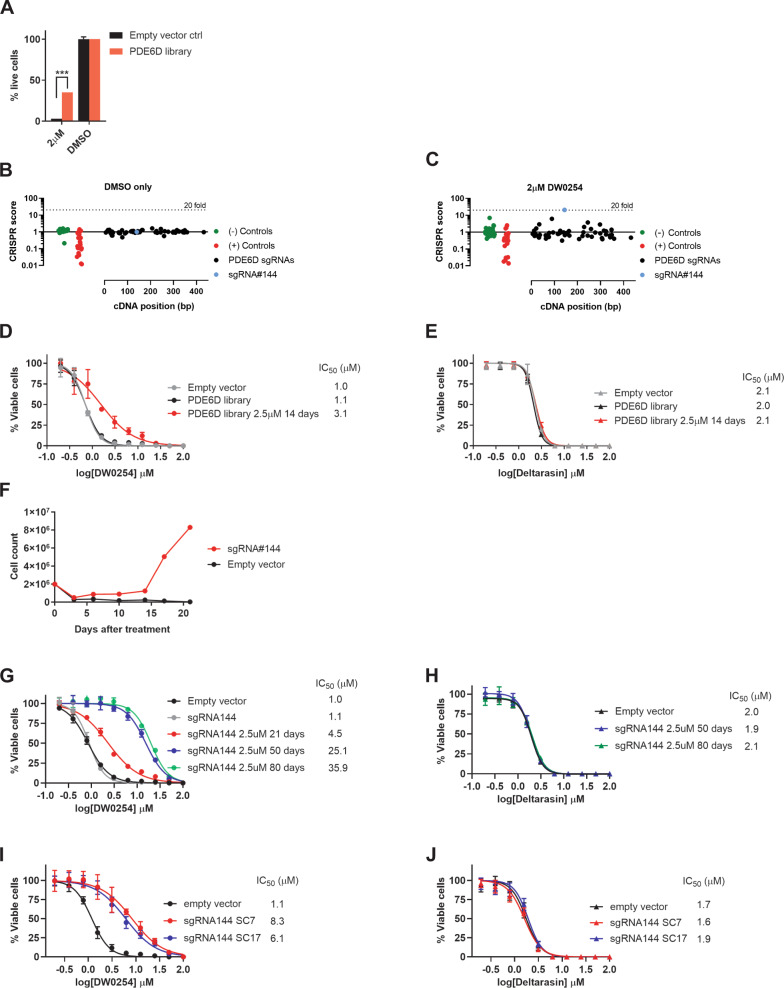
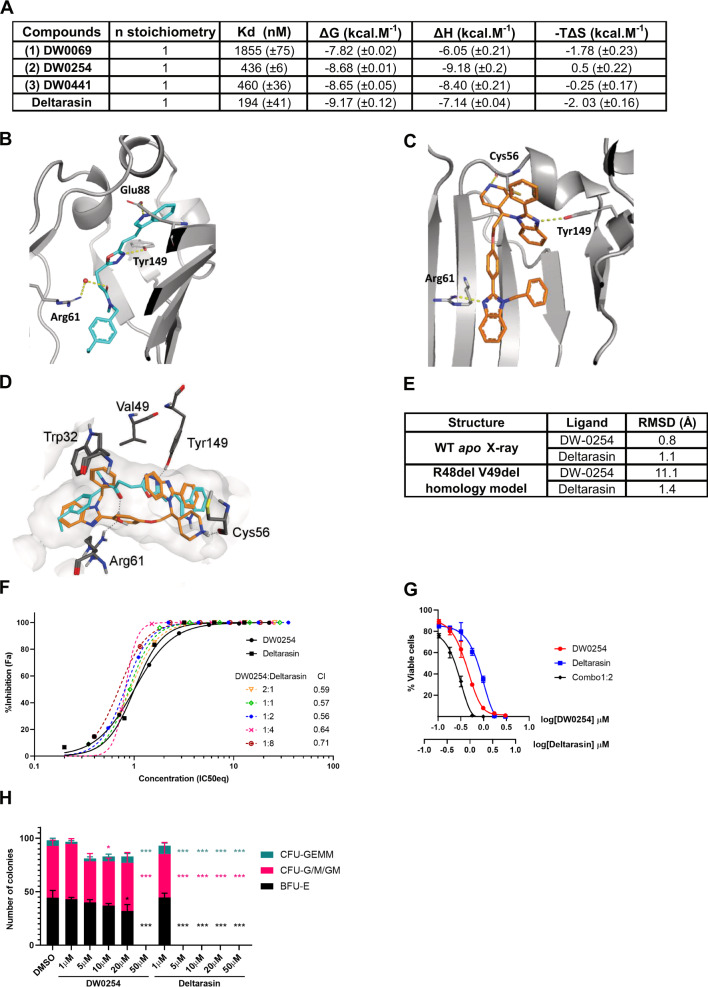
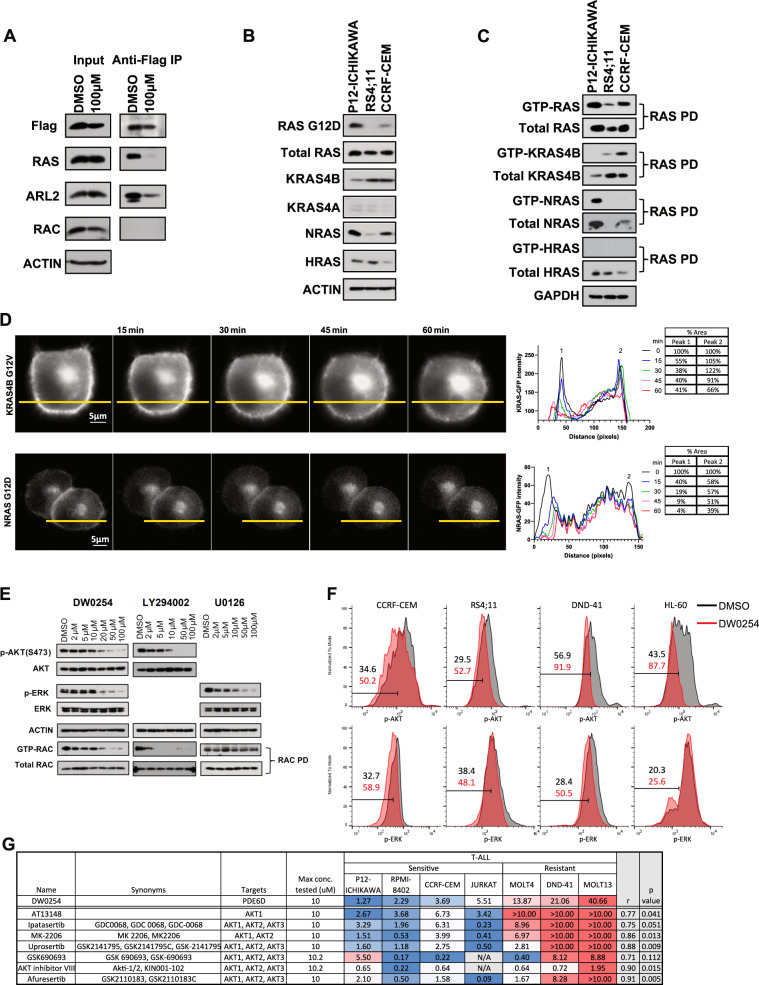
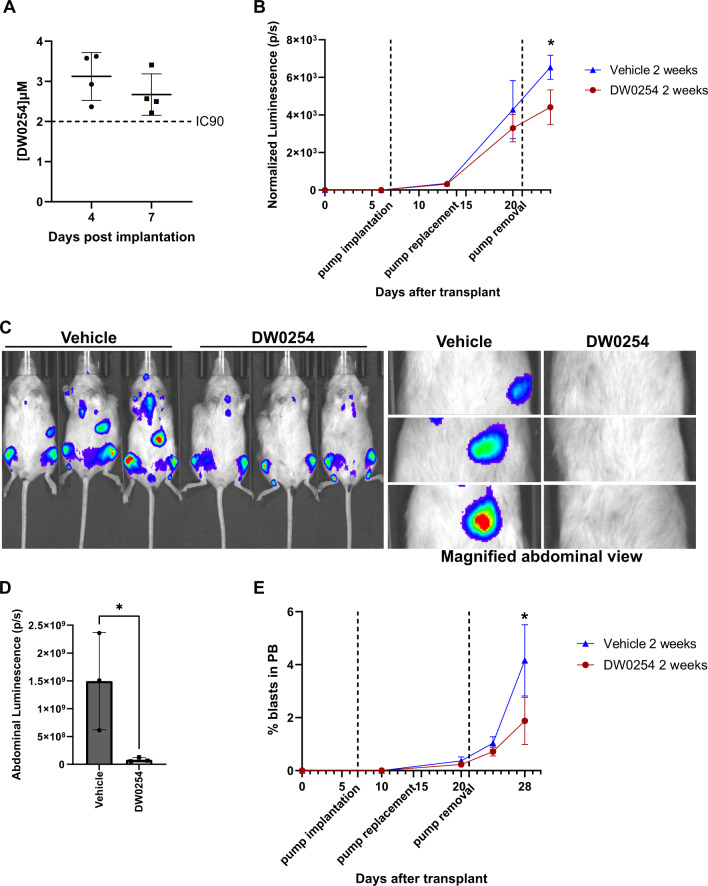
RAS mutations prevalent in high-risk leukemia have been linked to relapse and chemotherapy resistance. Efforts to directly target RAS proteins have been largely unsuccessful. However, since RAS-mediated transformation is dependent on signaling through the RAS-related C3 botulinum toxin substrate (RAC) small GTPase, we hypothesized that targeting RAC may be an effective therapeutic approach in RAS mutated tumors. Here we describe multiple small molecules capable of inhibiting RAC activation in acute lymphoblastic leukemia cell lines. One of these, DW0254, also demonstrates promising anti-leukemic activity in RAS-mutated cells. Using chemical proteomics and biophysical methods, we identified the hydrophobic pocket of phosphodiester 6 subunit delta (PDE6D), a known RAS chaperone, as a target for this compound. Inhibition of RAS localization to the plasma membrane upon DW0254 treatment is associated with RAC inhibition through a phosphatidylinositol-3-kinase/AKT-dependent mechanism. Our findings provide new insights into the importance of PDE6D-mediated transport for RAS-dependent RAC activation and leukemic cell survival.


Conflict of interest statement

DAW has been funded by the NIH. He is or was recently a member on a Board of Directors or advisory committees for: Bluebird bio, Orchard Therapeutics, Novartis, Beam Therapeutics, Emerging Therapy Solutions, Geneception, and BioMarin. In addition, he is the Co-founder of Alerion Biosciences and Orchard Therapeutics. AA, FA, EB, PK, and ME declare present or past employment by Evotec while engaged in the research project. SDV declares present employment by Novartis Institute for Biomedical Research. The remaining authors declare no competing interests.

Figures

Fig. 1
Fig. 1. Compound screen for Rac inhibitors.
A virtual screen of Evotec’s library of commercially available compounds was performed that included an initial filtration for drug-like properties, followed by a preselection against shape-based pharmacophore of published RAC inhibitors. Next, a biological screen was carried out consisting of: (i) scoring for inhibition of growth on leukemic cell lines of 107 selected compounds, (ii) assessment of toxicity to normal bone marrow progenitors of compounds that showed good anti-leukemic activity, and (iii) validating on-target effects by RAC PBD pull down of non-toxic compounds. Created with BioRender.com.
Fig. 2
Fig. 2. Compound DW0254 inhibits RAC activation and shows anti-leukemic activity in vitro in leukemia cell lines.
A Chemical structure, physicochemical properties, and biological activities cell line for compounds 1–4 and NSC23766 (structure not shown), a known inhibitor of RAC. IC50 values represent the dose at which 50% cell viability was achieved on P12-ICHIKAWA cells. B GTP-RAC activity inhibition in P12-ICHIKAWA cells treated with different doses of DW0254 for 3 h. GST pulldown assays were conducted by incubating lysates with PAK1-PBD beads. Cell lysates to detect total RAC and proteins eluted from the PAK1-PBD beads to detect GTP-RAC were subjected to Western blotting using anti-RAC (610651, BD Transduction laboratories, San Jose, CA) and anti-beta ACTIN (A5441, Sigma-Aldrich) antibodies. Data are representative of three individual experiments. C Representative peaks of Far Red CellTrace staining of P12-ICHIKAWA cells treated with different doses of DW0254 and examined by FACS on three consecutive days. Peaks 1–4 represent the number of times the cells in each peak have divided; data shown from one of the three independent experiments. D Bar graph showing percentage of apoptosis by AnnV/PI staining of P12-ICHIKAWA cells treated for 3 days with different doses of DW0254, data represent mean ± SD of two independent experiments with n = 3 samples for each condition. Live: AnnV/PI; Early apoptosis: AnnV+/PI; Late apoptosis: AnnV+/PI+; and Dead: AnnV/PI+. E Drug dosage curve showing live cell viability assay after 3 days of DW0254 treatment of human ALL and F AML cell lines with diverse backgrounds and RAS status as described, n = 4 at each dosage, data show mean ± SD, one of three individual experiments showing the consistent results. Color code: WT RAS green, G12 mutant RAS blue, Q61 mutant RAS burgundy, other RAS mutations yellow. G GTP-RAC activity inhibition in a panel of T-ALL and AML cell lines treated with 50 µM DW0254 for 1 h.
Fig. 3
Fig. 3. Identification of the DW0254 molecular target PDE6D by photoaffinity labeling mass spectrometry (PALMS).
A Compound titration in the RAC1-TIAM1 homogeneous time-resolved fluorescence assay (HTRF) assay showing competition with increasing concentrations of test compounds (either NSC23766 or DW0254) on X-axis and fluorescence emission (Y-axis). B Chemical structure of DW0254-photoprobe PAL. The DW0254 warhead is colored in blue, the photoreactive diazirine group in red, and the alkyne clickable group in green. C top: MS signal intensity of protein target hits of DW0254 in the pulldown samples of P12-ICHIKAWA cells. Histogram plots represent quantitative determination of PDE6D and SEPT11 MS signal intensity in the different pulldown samples (DMSO, PAL alone, and PAL in combination with a 20-fold molar excess of DW0254). Conditions analyzed included P12-ICHIKAWA cells that were treated with PAL (1 µM) ± DW0254 (20 µM) prior UV irradiation, streptavidin pulldown and label-free differential quantitative mass spectrometry analysis. Three biological replicates for each sample were performed. bottom: Summary of the significant protein target hits of PAL identified in P12-ICHIKAWA; Proteins with an adjusted p-value (or q value) <5% and a FC of >2 were selected to be differentially modulated. A protein was considered as a hit of DW0254 when identified with at least two peptides in minimum two out of three replicates, FC > 2 and adjusted p-values < 0.05 in the two comparisons, PAL/DMSO and PAL/PAL + DW0254. D top: MS signal intensity of PDE6D in CCRF-CEM pulldown samples. Histogram plots represent quantitative determination of PDE6D MS signal intensity in the different pulldown samples (DMSO, PAL alone, and PAL in combination with a 20-fold molar excess of DW0254). Y-axis shows log2 value of protein identified. Proteins eluted from the beads were separated by SDS-PAGE and protein bands within the molecular weight range 15–18 kDa were excised. Proteins were prepared for downstream label-free differential quantitative mass spectrometry analysis. Three biological replicates for each sample were performed. bottom: Summary of the significant protein target hits of PAL identified in CCRF-CEM cells; Proteins with an adjusted p-value (or q value) <5% and a FC of >2 were selected to be differentially modulated. A protein was considered as a hit of DW0254 when identified with at least two peptides in minimum two out of three replicates, FC > 2 and adjusted p-values < 0.05 in the two comparisons, PAL/DMSO and PAL/PAL + DW0254. E In-gel fluorescence scanning showing the proteome reactivity profiles of live CCRF-CEM cells photolabeled by PAL (1 µM) with or without DW0254 (20 µM). FL: in-gel fluorescence scanning. CBB: Coomassie gel. F In-gel fluorescence scanning showing the recombinant human His-TEV-PDE6D-Avitag protein photolabeled by PAL (1 µM) with or without DW0254 (20 µM). FL: in-gel fluorescence scanning. CBB: Coomassie gel. G Single-stage LC-MS (MS1) intensity values of PAL-modified peptide TGKILWQGTED following His-TEV-PDE6D-Avitag protein labeling with PAL in competition with DW0254. The peptide adduct was identified in the sample irradiated with PAL in the presence of DW0254 but with a peak intensity >4-fold lower compared to the sample irradiated with PAL alone. H The second stage of mass spectrometry (MS2) for the PAL-modified peptide TGKILWQGTED of His-TEV-PDE6D-Avitag protein. MS2 spectra of the probe-modified peptide 1827.9216 m/z and its intact counterpart 1246.6193 m/z. Unlabeled fragment ions y1–y6 and b1–b9 were detected in both the PAL-modified peptide TGKILWQGTED and its intact counterpart. The fragment ion +178.12 m/z cleaved from PAL1 upon CID fragmentation was detected only in the MS2 spectrum of the PAL1-modified peptide.
Fig. 4
Fig. 4. Identification of mutations on V49 and neighboring residues of PDE6D hydrophobic domain as essential for cellular resistance to DW0254.
A Percentage of live P12-ICHIKAWA cells by DAPI staining after transduction with either PDE6D library or empty vector control treated for two weeks with 2 μM of DW0254 or DMSO, data represent mean ± SD of three technical replicates, ***P ≤ 0.001. B Changes in barcoded sgRNAs of untreated PDE6D library cells 14 days after transduction. The cDNA position (in bp) is shown on the X-axis. The fold-change in CRISPR score is shown on the Y-axis. Negative and positive controls are shown in green and red dots, respectively. Negative controls used were non targeting sgRNAs and positive controls targeting essential genes, including PCNA, CDK1, CDK9, RPA3, BRD4, MYC, and RPS20. C Changes in barcoded sgRNAs of PDE6D library cells treated for 14 days with 2 μM of DW0254 versus 14 days of DMSO. Dotted line on panels (B) and (C) represents a 20-fold change on CRISPR score. D DW0254 dose response curves showing % of viable PDE6D library cells or controls untreated or treated with DW0254 at 2 µM for 14 days. E Deltarasin dose response curves showing % of viable empty vector transduced cells, untreated PDE6D library cells and PDE6D library cells treated with DW0254 at 2 µM for 14 days. F Cell growth curves for P12-ICHIKAWA cells expressing Cas9 only or Cas9 and sgRNA144, treated with 2.5 μM of DW0254 for 21 days. G DW0254 dose response curves showing % of viable empty vector transduced cells, untreated sgRNA144 transduced cells, and sgRNA144 cells treated with DW0254 for 21, 50, and 80 days. H Deltarasin dose response curves showing % of viable untreated sgRNA144 transduced cells and controls, and sgRNA144 cells treated with DW0254 for 21, 50, and 80 days; For panels (D), (E), (G) and (H): data represent mean ± SD of two independent experiments with N = 3 samples for each condition. I DW0254 dose response curves showing % of viable cells transduced with empty vector and two single cell clones of sgRNA144 transduced cells. J Deltarasin dose response curves showing % of viable empty vector and two single cell clones of sgRNA144 transduced cells; For panels (I) and (J) data represent mean ± SD of two independent experiments with N = 4 samples for each condition.
Fig. 5
Fig. 5. Co-crystallization of PDE6D and DW0254 confirms compound binding to hydrophobic pocket and evidences different binding modes between this inhibitor and Deltarasin.
A Binding affinity (Kd) and thermodynamics parameters for ligand binding to PDE6D determined by Isothermal Titration Calorimetry (ITC). B The crystal structure of compound DW0254 in the PDE6D-binding pocket; Q88, R61, and Y149 are shown in sticks to highlight the hydrogen bind interactions. C The crystal structure of Deltarasin in the PDE6D-binding pocket; C56, R61, and Y149 are shown in sticks to highlight the hydrogen bind interactions. D Experimental binding mode of DW-0254 (cyan) in wild type PDE6D. The superposed 3D coordinates of Deltarasin (orange) are also shown. Several binding site residues, including V49, are shown for reference. E Docking results in wild type apo structure of PDE6D and R48delV49del mutant; Root mean square deviation (RMSD) with respect to 3D coordinates of the ligands in the superposed X-ray complex of the wild type protein are reported. F Drug dosage curves for P12-ICHIKAWA cells treated with DW0254 alone, Deltarasin alone, or various combinations of both obtained from a full matrix using the “Fixed Ratio” Method; data show mean ± SD of n = 3 samples for each condition, and combination indexes for each combo calculated using the Chou-Talalay theorem. G Drug dosage curves for P12-ICHIKAWA cells treated with DW0254 alone, Deltarasin alone, or the combination of both at a 1:2 ratio; data show mean ± SD of n = 3 samples for each condition. H Colony counts of healthy human CD34+ cells after 14 days culture in MethoCult H4435 enriched medium in presence of DMSO or increasing concentrations of DW0254 or Deltarasin. CFU-GEMM: Colony-forming unit—granulocyte, erythroid, macrophage, megakaryocyte; CFU-GM: Colony-forming unit—granulocyte, macrophage; BFUE: Burst-forming unit—erythroid. Data represent mean ± SD, n = 3 samples for each condition. *p < 0.05; ***p < 0.001.
Fig. 6
Fig. 6. The expression and activation of RAS isoforms in DW0254 sensitive leukemia cells and the effects of DW0254 on PDE6D/RAS interaction and RAS subcellular location.
A DW0254 treatment inhibits the binding of PDE6D to RAS and ARL2 in P12-ICHIKAWA cells. Co-immunoprecipitation (CoIP) was performed with an anti-FLAG antibody (F1804, Sigma-Aldrich) on lysates from FLAG-tagged PDE6D transduced P12-ICHIKAWA cells treated with 100 µM DW0254 or DMSO. Cell lysates (Input) and protein eluted from beads (IP) were analyzed by Western blotting with anti-Flag, anti-RAS (05-1072, Millipore Sigma, Billerica, MA), anti-ARL2 (ab183510, Abcam, Cambridge, MA), anti-RAC (610651, BD) antibodies. B The expression pattern of RAS isoforms in leukemia cell lines sensitive to DW0254. Western blot analysis of whole-cell lysates from P12-ICHIKAWA, RS4;11, and CCRF-CEM leukemia cells detected by anti-RASG12D (14429S, Cell signaling), anti-RAS (05-1072, Millipore Sigma), Anti-KRAS4B (WH0003845M1, Millipore Sigma), anti-KRAS4A (ABC1442, Millipore Sigma), anti-NRAS (sc-31, Santa Cruz), and anti-HRAS (18295-1-AP, Proteintech, Rosemont, IL) antibodies. C Activated RAS isoforms in P12-ICHIKAWA, CCRF-CEM and RS4;11 cells. GST pulldown assays were performed by incubating protein lysates prepared from P12-ICHIKAWA, CCRF-CEM and RS4;11 with RAF-1 RBD conjugated agarose beads. The GTP-RAS proteins bound to the beads or the whole cell lysates to detect the level of total RAS protein were identified using anti-RAS, anti-KRAS4B, anti-NRAS, or anti-HRAS antibodies described above. For A, B, and C, beta-ACTIN or GAPDH (A300-641A, BETHYL, Montgomery, TX) were used as a protein loading control, one representative experiment of two or three is shown. D Mislocalization from cell surface membrane of GFP-tagged mutant KRAS4BG12V (upper panel) or NRASG12D (lower panel) in PANC-1 cells after treatment with 20 µM of DW0254. Time in minutes is indicated above the panels; the first panel represents the moment immediately after the addition of the inhibitor. The intensity profiles on the right show changes in fluorescence along the X axis, represented by yellow lines on the micrographs. Tables show changes in percentage of the area under the peaks, where time 0 peaks represent the intersection of the X axis with the cell membrane. E Western blot showing total and phosphorylated AKT and ERK, and pulldown results for RAC activation in P12-ICHIKAWA cells treated with increasing doses of DW0254, PI3K inhibitor LY294002, or MEK inhibitor U0126 for 3 h. Total AKT, and ERK expression were assessed using anti-AKT (9272, Cell signaling) and anti-ERK (9102S, Cell signaling) antibody respectively. Phosphorylation of AKT and ERK were assessed using anti-phospho-AKT Ser473 (9271S, Cell signaling) and anti-phospho-ERK (4377S, Cell signaling) antibody respectively. Total RAC and GTP-RAC were analyzed by RAC pull-down assay as described in Fig. 2B. For A, B, C, and D, beta-ACTIN or GAPDH were used as a protein loading control. Data represent three independent experiments. F PhosphoFlow results showing intensity of p-AKT (top) and p-ERK (bottom) intracellular staining on cells treated with DMSO only (black) or 50 µM DW0254 (red) for 1 h. Data are representative of two independent experiments with four cell lines showing the same results. G Summary of response to AKT inhibitors in T-ALL cell lines from “The Genomics of Drug Sensitivity in Cancer Project” database compared to sensitivity to DW0254. Pearson’s correlation coefficient (r) and the p value for the correlation coefficient between response to DW0254 and each AKT inhibitor are shown on the right extremity.
Fig. 7
Fig. 7. In vivo treatment of mice with DW0254 using Alzet osmotic pumps.
A Plasma concentration of DW0254 (µM) at day 4 and 7 post subcutaneous implantation of Alzet osmotic pumps 2001 containing a 500 mg/ml solution of DW0254 in water with 50% DMSO and 15% Ethanol with a 7-days pumping rate of 1 µl/h. Individual values as well as mean ± SD of four animals are shown. B Changes in luminescent signal in units of photons/s (p/s), after luciferase expressing P12-ICHIKAWA xenograft for mice implanted with DW0254 or vehicle control pumps at day 7 and replaced at day 14 post-transplant. Photon flux signal after pump implantation was normalized over signal before implantation for each mouse. C Bioluminescent images of day 24 post-transplant (last data point of panel B) of mice treated with DW0254 or Vehicle control pumps from day 7 to day 21 and magnified abdominal view showing increased spleen signal in control mice. D Bar graph showing quantification of abdominal bioluminescence depicted in panel (C) right. Welch’s correction t-test was used for statistical analysis since variances between the groups were significantly different. E Percentage of blasts in the peripheral blood (PB) of mice treated with DW0254 or Vehicle control pumps for 2 weeks. Data in B, D, and E represent mean ± SD, n = 3 animals for each condition. *p < 0.05.

References

    1. Troeger A, Williams DA. Hematopoietic-specific Rho GTPases Rac2 and RhoH and human blood disorders. Exp Cell Res. 2013;319:2375–83. doi: 10.1016/j.yexcr.2013.07.002. - DOI - PMC - PubMed
    1. Cancelas JA, Lee AW, Prabhakar R, Stringer KF, Zheng Y, Williams DA. Rac GTPases differentially integrate signals regulating hematopoietic stem cell localization. Nat Med. 2005;11:886–91. doi: 10.1038/nm1274. - DOI - PubMed
    1. Bos JL. ras oncogenes in human cancer: a review. Cancer Res. 1989;49:4682–9. - PubMed
    1. Prior IA, Lewis PD, Mattos C. A comprehensive survey of Ras mutations in cancer. Cancer Res. 2012;72:2457–67.. doi: 10.1158/0008-5472.CAN-11-2612. - DOI - PMC - PubMed
    1. Tyner JW, Erickson H, Deininger MW, Willis SG, Eide CA, Levine RL, et al. High-throughput sequencing screen reveals novel, transforming RAS mutations in myeloid leukemia patients. Blood. 2009;113:1749–55.. doi: 10.1182/blood-2008-04-152157. - DOI - PMC - PubMed

MeSH terms

Substances