. 2022 Apr 14;13(1):2003.
doi: 10.1038/s41467-022-29657-y.

Microvascular stabilization via blood-brain barrier regulation prevents seizure activity

Affiliations

Microvascular stabilization via blood-brain barrier regulation prevents seizure activity

Chris Greene et al. Nat Commun. .

Abstract

Blood-brain barrier (BBB) dysfunction is associated with worse epilepsy outcomes however the underlying molecular mechanisms of BBB dysfunction remain to be elucidated. Tight junction proteins are important regulators of BBB integrity and in particular, the tight junction protein claudin-5 is the most enriched in brain endothelial cells and regulates size-selectivity at the BBB. Additionally, disruption of claudin-5 expression has been implicated in numerous disorders including schizophrenia, depression and traumatic brain injury, yet its role in epilepsy has not been fully deciphered. Here we report that claudin-5 protein levels are significantly diminished in surgically resected brain tissue from patients with treatment-resistant epilepsy. Concomitantly, dynamic contrast-enhanced MRI in these patients showed widespread BBB disruption. We show that targeted disruption of claudin-5 in the hippocampus or genetic heterozygosity of claudin-5 in mice exacerbates kainic acid-induced seizures and BBB disruption. Additionally, inducible knockdown of claudin-5 in mice leads to spontaneous recurrent seizures, severe neuroinflammation, and mortality. Finally, we identify that RepSox, a regulator of claudin-5 expression, can prevent seizure activity in experimental epilepsy. Altogether, we propose that BBB stabilizing drugs could represent a new generation of agents to prevent seizure activity in epilepsy patients.


Conflict of interest statement

Trinity College Dublin owns an intellectual property portfolio related to the regulation of claudin-5 to treat epilepsy. M.C., C.G., N.H. and C.D. are named inventors. All other authors declare no competing interest.

Figures

Fig. 1
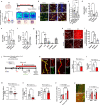
Fig. 1. Drug resistant temporal lobe epilepsy induces blood-brain barrier leakage and Cldn5 downregulation in the hippocampus.
a Representative dynamic contrast-enhanced MRI (DCE-MRI) images from 4 patients with temporal lobe epilepsy (TLE, top panel). Colour bar represents slope of contrast agent. b T2 weighted images (middle panel) and (c) fluid attenuated inversion recovery (FLAIR) images (bottom panel). d Claudin-5 (CLDN5; green) and CD31 (red) staining in non-diseased autopsy control (CNTRL) and TLE cases. Scale bars, 20 μm. e Collagen-IV (ColIV; green) and IgG (red) staining in CNTRL and TLE cases. Scale bars, 50 μm. f Levels of CLDN5 were significantly decreased (**p = 0.0042) and g IgG was significantly increased (****p < 0.0001) in the brains of TLE cases vs CNTRL. Data represent means ± s.e.m.; each datapoint represents one patient. Number of subjects (n) is indicated on graphs. Two-sided Mann–Whitney test for immunohistochemical and western blot analysis. **p < 0.01; ****p < 0.0001. Source data are provided as a Source Data file.
Fig. 2
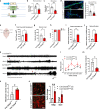
Fig. 2. Conditional knockdown of Cldn5 expression in the hippocampus exacerbates kainic acid-induced epilepsy.
a Kainic acid (KA) injection site and timeline of experiment (top). Figure Created with BioRender. Open field testing of mice post KA injection with significant decreases in the number of entries in the centre zone (bottom) at both timepoints compared to saline (****p < 0.0001 for acute and chronic). b Claudin-5 (green) and CD31 (red) staining in the hippocampus in saline injected animals and the acute and chronic stages post KA injection. Scale bars, 50 μm. c Levels of claudin-5 expression were significantly decreased following KA injection at the acute (*p = 0.0187) and chronic stage (**p = 0.0036). d Cldn5 (*p = 0.0102), e Ocln (*p = 0.0124) and f Tjp1 (*p = 0.0129) mRNA levels were decreased at 3 h and 24 h post KA injection. g S100B levels were significantly increased in serum of mice 3 h post KA injection (*p = 0.011). h Immunohistochemistry for Sulfo-NHS-Biotin and claudin-5 following intrahippocampal injection of KA. Scale bars, 50 μm. i Biotin extravasated into the brain at the acute stage post injection of KA (***p = 0.0007). Figure Created with BioRender. j AAV expressing claudin-5 shRNA injected bilaterally into the hippocampus and timeline of experiment. k Claudin-5 protein (**p = 0.0024) (green) and l mRNA (*p = 0.043) was significantly decreased in brain endothelial cells (red) following AAV-shRNA-Cldn5 injection in the hippocampus of mice compared to that in AAV-shRNA-injected mice, following doxycycline (Dox) treatment. Scale bar, 20 μm. m Reduced performance in the novel object recognition (*p = 0.0146) and n open field test (**p = 0.0023) post claudin-5 suppression in KA injected mice. o Increased sodium fluorescein (NaFl) extravasation post claudin-5 suppression in KA injected mice (***p = 0.0006). p Increased IBA1 positive microglia (**p = 0.0044) and GFAP positive astrocytes (**p = 0.0024) post claudin-5 suppression in kainic acid injected mice. Scale bar, 20 μm. Data represent means ± s.e.m.; each datapoint represents one animal. Number of animals (n) is indicated on graphs. Two-way ANOVA followed by Bonferroni’s multiple comparison test for sodium fluorescein permeability; two-sided unpaired t-test for AAV experiments; one-way ANOVA followed by Tukey’s multiple comparison test for all other graphs. *p < 0.05; **p < 0.01; ***p < 0.001; ****p < 0.0001. Source data are provided as a Source Data file.
Fig. 3
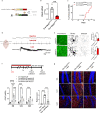
Fig. 3. Cldn5 heterozygous mice have reduced threshold for kainic acid-evoked seizures.
a Schematic overview of Cldn5fl/wt mouse. b Cldn5 transcript levels were significantly decreased Cre+Cldn5fl/wt mice in isolated microvasculature (**p = 0.0023) and c whole brain (**p = 0.0014). d Claudin-5 protein expression significantly decreased in isolated microvessels of Cre+Cldn5fl/wt mice (****p < 0.0001). Scale bar, 50 µm. e Schematic representation of electrode placement for electroencephalography (EEG) studies (top). f Increased total power in Cre+Cldn5fl/wt mice prior to kainic acid (KA) injection (*p = 0.0311). g Reduced latency to the first electrographic seizure (*p = 0.0432) in Cre+Cldn5fl/wt mice. h Percentage of mice entering status epilepticus (SE) following kainic acid injection. i Increased total power in Cre+Cldn5fl/wt mice following mildly convulsant KA injection (**p = 0.0015). j Increased seizure burden in Cre+Cldn5fl/wt mice following KA injection (**p = 0.0043). k Representative EEG recording post mildly convulsive KA injection. l Increased Racine score over time in Cre+Cldn5fl/wt mice (*p = 0.0148 at 20–30 min post KA injection). m Decreased latency to stage 3 seizures in Cre+Cldn5fl/wt mice (*=0.0459). n Increased racine score in Cre+Cldn5fl/wt mice post injection of KA (*p = 0.0474). o Increased GFAP (red) expression in Cre+Cldn5fl/wt mice (**p = 0.0072). IBA1 (green) expression did not change (p = 0.0894). Scale bars, 50 μm. Data represent means ± s.e.m.; each data point represents one animal or vessel. Number of animals (n) is indicated on graphs. Two-way ANOVA followed by Bonferroni’s multiple comparison test for Racine score over time; two-sided Mann–Whitney test for seizure burden; two-sided unpaired t-test for all other graphs. *p < 0.05; **p < 0.01; ****p < 0.0001. Source data are provided as a Source Data file.
Fig. 4
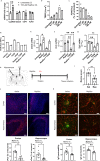
Fig. 4. Inducible Cldn5 knockdown mice develop spontaneous seizures and neuroinflammation.
a Schematic outline of inducible knockdown mouse model. b Cldn5 significantly suppressed following 4 weeks of doxycycline (Dox) treatment (**p = 0.001). c Percentage of mice with spontaneous recurrent seizures (SRS) following 4 weeks of Dox treatment (****p < 0.0001). d Representative EEG traces following 4 weeks of Dox treatment. e IBA1 (green) quantification post claudin-5 suppression with decreased cellular endpoints (**p = 0.0088), and increased IBA1 positive cells (***p = 0.0005). Scale bar, 50 µm. f, g Experimental outline for recovery experiment. Increased GFAP levels in the dentate gyrus (DG ****p < 0.0001), CA1 (***p = 0.0001) and CA3 (***p = 0.0007) of mice following 4 weeks of doxycycline treatment are reversed following doxycycline withdrawal in the DG (***p = 0.0002 vs Cre positive 4 weeks). Scale bar, 100 µm. Increased seizure behaviour as scored according to Racine scale (****p < 0.0001 for Cre− vs Cre+ (Dox)) decreased following Dox removal (***p = 0.0004 for Cre+ (Dox) vs Cre+ (off Dox). Data represent means ± s.e.m.; each datapoint represents one animal. Number of animals (n) is indicated on graphs. Mantel–Cox test for SRS analysis; two-sided unpaired t-test for qPCR and microglia morphology; two-way ANOVA followed by Bonferroni’s multiple comparison test for reversibility study. **p < 0.01; ***p < 0.001; ****p < 0.0001. Source data are provided as a Source Data file.
Fig. 5
Fig. 5. ALK5 inhibition induces Cldn5 expression and attenuates kainic acid-induced seizures and BBB leakiness.
a Increased Cldn5 expression 24 h post treatment with RepSox (100 μM) (**p = 0.0029). b Increased trans-endothelial electrical resistance (TEER) with increasing doses of RepSox. c Decreased flux of FITC-Dextran-40 (FD40) with increasing doses of RepSox. d Decreased flux of FD40 following exposure of endothelial cells to transforming growth factor-β1 (TGFβ) or vascular endothelial growth factor (VEGF) in combination with 100 µM RepSox. e RepSox significantly increased Cldn5 mRNA (*p = 0.0182) without changing (f) Ocln and (g) Tjp2 expression. h Experimental outline of RepSox treatment in the intrahippocampal kainic acid (KA) induced seizure model. i Reduced Racine score in RepSox treated mice (**p = 0.0039) compared to saline (Sal). j Decreased cFos expression in the cortex (**p = 0.0036) and hippocampus (*p = 0.0461) post treatment with 10 mg/kg RepSox. Scale bar, 100 μm. k Decreased IgG (green) extravasation in the cortex (*p = 0.0243) and hippocampus (**p = 0.0038) post treatment with 10 mg/kg RepSox. Scale bar, 100 μm. Data represent means ± s.e.m.; number of independent experiments or animals (n) is indicated on graphs. Two-way ANOVA followed by Bonferroni’s multiple comparison test for tight junction qPCRs; one-way ANOVA followed by Tukey’s multiple comparison test for cell culture experiments; two-sided unpaired t-test for in vivo studies. *p < 0.05; **p < 0.01; ****p < 0.0001. Source data are provided as a Source Data file.

Comment in

References

    1. Epilepsy, http://www.who.int/mediacentre/factsheets/fs999/en/ (2017).
    1. Kwan P, Schachter SC, Brodie MJ. Drug-resistant epilepsy. N. Engl. J. Med. 2011;365:919–926. doi: 10.1056/NEJMra1004418. - DOI - PubMed
    1. Thijs RD, Surges R, O’Brien TJ, Sander JW. Epilepsy in adults. Lancet. 2019;393:689–701. doi: 10.1016/S0140-6736(18)32596-0. - DOI - PubMed
    1. Tomkins O, et al. Blood-brain barrier breakdown following traumatic brain injury: a possible role in posttraumatic epilepsy. Cardiovasc. Psychiatry Neurol. 2011;2011:765923. doi: 10.1155/2011/765923. - DOI - PMC - PubMed
    1. Herman ST. Epilepsy after brain insult: targeting epileptogenesis. Neurology. 2002;59:S21–S26. doi: 10.1212/WNL.59.9_suppl_5.S21. - DOI - PubMed

Publication types

LinkOut - more resources