. 2022 Apr 14;12(1):161.
doi: 10.1038/s41398-022-01909-x.

Evidence for widespread alterations in cortical microstructure after 32 h of sleep deprivation

Affiliations

Evidence for widespread alterations in cortical microstructure after 32 h of sleep deprivation

Irene Voldsbekk et al. Transl Psychiatry. .

Abstract

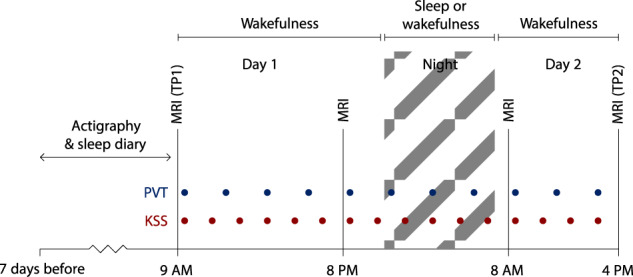
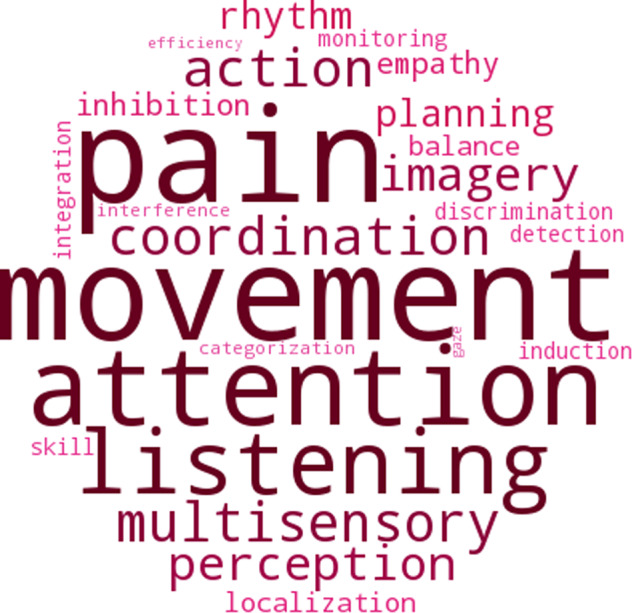
Cortical microstructure is influenced by circadian rhythm and sleep deprivation, yet the precise underpinnings of these effects remain unclear. The ratio between T1-weighted and T2-weighted magnetic resonance images (T1w/T2w ratio) has been linked to myelin levels and dendrite density and may offer novel insight into the intracortical microstructure of the sleep deprived brain. Here, we examined intracortical T1w/T2w ratio in 41 healthy young adults (26 women) before and after 32 h of either sleep deprivation (n = 18) or a normal sleep-wake cycle (n = 23). Linear models revealed significant group differences in T1w/T2w ratio change after 32 h in four clusters, including bilateral effects in the insular, cingulate, and superior temporal cortices, comprising regions involved in attentional, auditory and pain processing. Across clusters, the sleep deprived group showed an increased T1w/T2w ratio, while the normal sleep-wake group exhibited a reduced ratio. These changes were not explained by in-scanner head movement, and 95% of the effects across clusters remained significant after adjusting for cortical thickness and hydration. Compared with a normal sleep-wake cycle, 32 h of sleep deprivation yields intracortical T1w/T2w ratio increases. While the intracortical changes detected by this study could reflect alterations in myelin or dendritic density, or both, histological analyses are needed to clarify the precise underlying cortical processes.


Conflict of interest statement

TE received speaker’s honoraria from Lundbeck and Janssen Cilag and is a consultant to BrainWaveBank and Synovion. NZ received speaker’s honoraria from Lundbeck.

Figures

Fig. 1
Fig. 1. Overview of the study protocol. Participants underwent MRI including T1w- and T2w scans in the morning after a night of sleep (time point (TP)1) and then in the afternoon on the second day (TP2) after 32 h of either normal sleep-wake or total sleep deprivation.
They also underwent MRI (not including T1w- and T2w scans) in the evening on the first day and in the morning on the second day. During the study, participants underwent tests of subjective sleepiness (Karolinska Sleepiness Scale, KSS) and objective alertness (Psychomotor Vigilance Task, PVT) every second and third hour, respectively. Seven days prior to the first MRI scan, participants underwent measurements of sleep habits by actigraphy and self-report sleep diary.
Fig. 2
Fig. 2. Altered intracortical T1w/T2w ratio after 32 h of either normal sleep-wake (NSW) or sleep deprivation.
A Surface maps of group differences (p-values). Displayed are the regions of the four clusters showing significant group differences in symmetrised percentage change (SPC) in T1w/T2w ratio between the sleep deprivation group and NSW group in the right hemisphere (RH, left side) and the left hemisphere (LH, right side). Each cluster was p < 0.05, and the p-values for each region (before cluster-correction) are presented for illustration. B Information for each of the 4 clusters (C1-C4). Bi Violin-box-scatter plots for the mean T1w/T2w ratio for participants in each group. Bii Surface maps of each cluster separately (p-values). Biii The distribution of maximum cluster sizes across random groupings (grey) with the actual cluster size for each cluster identified with the triangle (magenta).
Fig. 3
Fig. 3. Regional variation in sensitivity to either normal sleep-wake (NSW) or sleep deprivation in the right hemisphere (RH, left side) and left hemisphere (LH, right side).
Percentage change within each significant cluster for the NSW group (top) and sleep deprivation group (bottom).
Fig. 4
Fig. 4. Word cloud based on correlations with NeuroSynth meta-analysis maps across groups.
Larger size and colour saturation indicate stronger correlation.
Fig. 5
Fig. 5. Surface maps as a function of cortical depth (p-values).
Maps showing significant group differences in T1w/T2w ratio in the right hemisphere (RH, left side) and left hemisphere (LH, right side) for 30%, 50% and 70% cortical depth. Top row. T1w/T2w ratio sampled from 30% into the cortex from the white/grey matter boundary. Middle row. 50% cortical depth (as shown in Fig. 2A). Bottom row. 70% cortical depth.

References

    1. Killgore WD. Effects of sleep deprivation on cognition. Prog Brain Res. 2010;185:105–29. doi: 10.1016/B978-0-444-53702-7.00007-5. - DOI - PubMed
    1. Wulff K, Gatti S, Wettstein JG, Foster RG. Sleep and circadian rhythm disruption in psychiatric and neurodegenerative disease. Nat Rev Neurosci. 2010;11:589–99. doi: 10.1038/nrn2868. - DOI - PubMed
    1. Peterson MJ, Benca RM. Sleep in mood disorders. Psychiatr Clin. 2006;29:1009–32. - PubMed
    1. Boland EM, Rao H, Dinges DF, Smith RV, Goel N, Detre JA, et al. Meta-analysis of the antidepressant effects of acute sleep deprivation. J Clin Psychiatry. 2017;78:e1020–e1034. doi: 10.4088/JCP.16r11332. - DOI - PubMed
    1. Wu C, Bunney E. The biological basis of an antidepressant response to sleep deprivation and relapse: review and hypothesis. Am J Psych. 1990;147:14–21. - PubMed

Publication types