. 2022 May;43(5):682-688.
doi: 10.3174/ajnr.A7477. Epub 2022 Apr 14.

Radio-Pathomic Maps of Cell Density Identify Brain Tumor Invasion beyond Traditional MRI-Defined Margins

Affiliations

Radio-Pathomic Maps of Cell Density Identify Brain Tumor Invasion beyond Traditional MRI-Defined Margins

S A Bobholz et al. AJNR Am J Neuroradiol. 2022 May.

Abstract

Background and purpose: Currently, contrast-enhancing margins on T1WI are used to guide treatment of gliomas, yet tumor invasion beyond the contrast-enhancing region is a known confounding factor. Therefore, this study used postmortem tissue samples aligned with clinically acquired MRIs to quantify the relationship between intensity values and cellularity as well as to develop a radio-pathomic model to predict cellularity using MR imaging data.

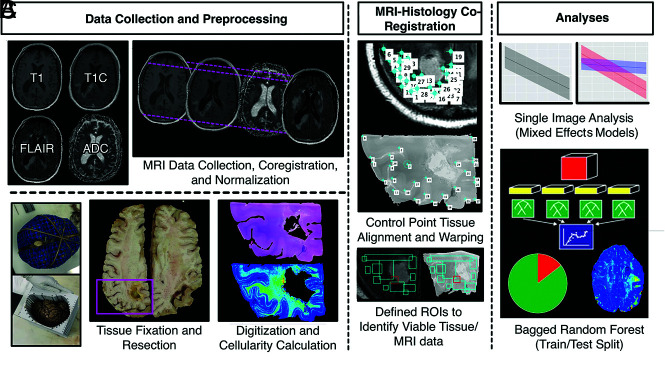
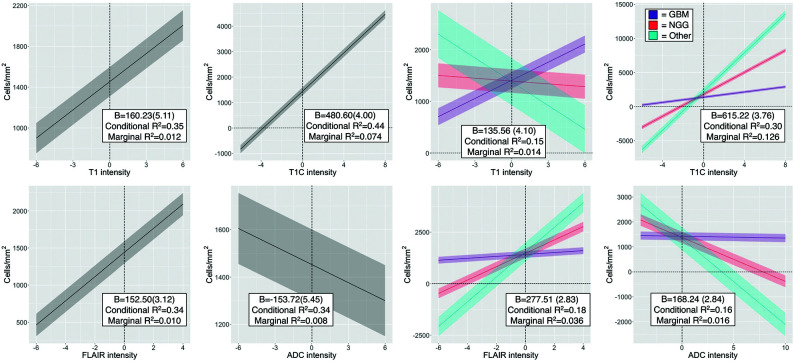
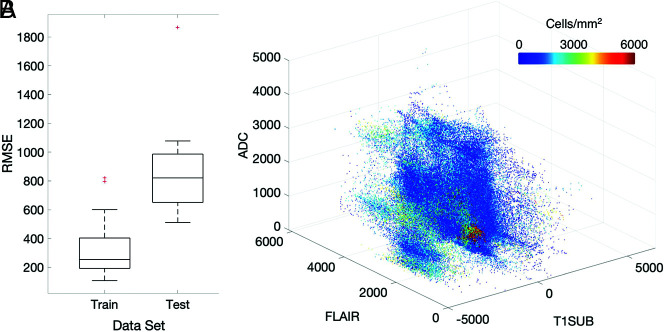
Materials and methods: This single-institution study used 93 samples collected at postmortem examination from 44 patients with brain cancer. Tissue samples were processed, stained with H&E, and digitized for nuclei segmentation and cell density calculation. Pre- and postgadolinium contrast T1WI, T2 FLAIR, and ADC images were collected from each patient's final acquisition before death. In-house software was used to align tissue samples to the FLAIR image via manually defined control points. Mixed-effects models were used to assess the relationship between single-image intensity and cellularity for each image. An ensemble learner was trained to predict cellularity using 5 × 5 voxel tiles from each image, with a two-thirds to one-third train-test split for validation.

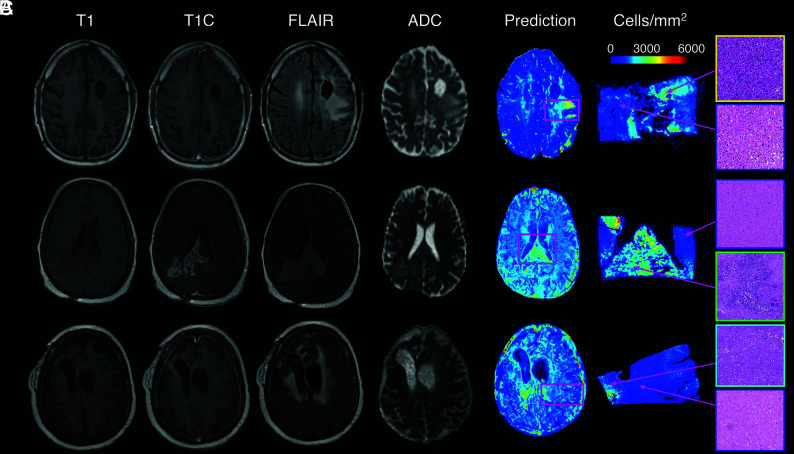
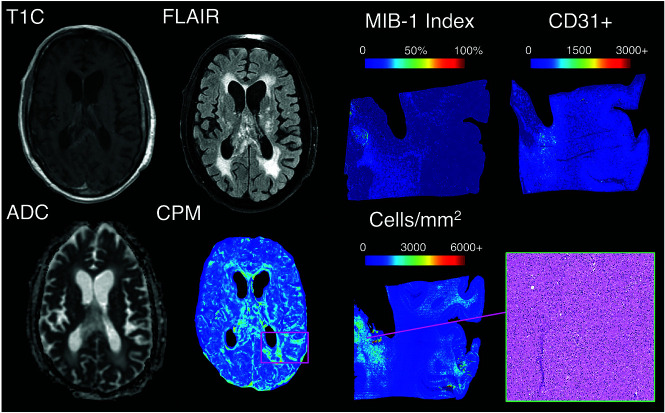
Results: Single-image analyses found subtle associations between image intensity and cellularity, with a less pronounced relationship in patients with glioblastoma. The radio-pathomic model accurately predicted cellularity in the test set (root mean squared error = 1015 cells/mm2) and identified regions of hypercellularity beyond the contrast-enhancing region.

Conclusions: A radio-pathomic model for cellularity trained with tissue samples acquired at postmortem examination is able to identify regions of hypercellular tumor beyond traditional imaging signatures.


Figures

FIG 1.
FIG 1.
Overview of the data-collection process. A, MR imaging data are collected from the patient’s final imaging session before death and coregistered, and T1, T1C, and FLAIR images are intensity-normalized. Tissue fixation and sampling involve the use of 3D printed brain cages and slicing jigs to preserve structural integrity relative to the MR imaging. Following staining, tissue samples are digitized for cellularity calculation using an automated nuclei segmentation algorithm. B, In-house software is used to align each tissue sample to the FLAIR image using manually defined control points and ROIs. C, Single-image cellularity associations are computed using mixed-effects models, and a bagging regression ensemble is trained to predict cellularity using 5 × 5 voxel tiles from each image using a two-thirds to one-third train-test split.
FIG 2.
FIG 2.
Single-image results depicting the relationship between image intensity and cellularity for each contrast. β values for the left-handed plots indicate the change in cellularity per SD increase in image intensity and indicate positive associations for T1, T1C, and FLAIR, with the expected negative association between ADC and cellularity present. β values for the right-handed plots indicate the difference in slope among patients with GBM and NGG and Other patients, indicating that patients with GBM show less pronounced cellularity associations than patients with NGG across all image types, with the exception of T1 intensity.
FIG 3.
FIG 3.
A, Subject-level RMSE values for the training and test data sets. Despite some degree of overfitting, the test set RMSE indicates that the radio-pathomic model is able to accurately predict cellularity across most subjects. B, Sample predictions for test set imaging values presented in terms of their T1SUB, FLAIR, and ADC intensity values. Patterns suggest the presence of traditional imaging signatures but also indicate the lack of specificity for these signatures with regard to hypercellularity. TISUB indicates T1C–T1.
FIG 4.
FIG 4.
Sample predictions for 3 representative subjects, including a 43-year-old man diagnosed with a grade III anaplastic astrocytoma (A), a 48-year-old man diagnosed with a GBM (B), and a 31-year-old woman diagnosed with a grade III anaplastic astrocytoma (C). These predictions indicate that the radio-pathomic model is able to predict regions of hypercellularity beyond the contrast-enhancing region as well as in the absence of restricted diffusion on the ADC image.
FIG 5.
FIG 5.
IHC staining for a nonenhancing region of predicted hypercellularity outside of contrast enhancement (a 64-year-old man diagnosed with GBM). The ROI corresponds to an actual region of hypercellularity seen on H&E staining as well as portions of high MIB-1 index and CD31 positivity. These molecular features indicate that this CPM-identified region contains active, proliferating tumor beyond the contrast-enhancing region. CPM indicates cellularity prediction map.

References

    1. Ostrom QT, Bauchet L, Davis FG, et al. . The epidemiology of glioma in adults: a “state of the science” review. Neuro Oncol 2014;16:896–913 10.1093/neuonc/nou087 - DOI - PMC - PubMed
    1. Ellingson BM, Wen PY, Cloughesy TF. Evidence and context of use for contrast enhancement as a surrogate of disease burden and treatment response in malignant glioma. Neuro Oncol 2018;20:457–71 10.1093/neuonc/nox193 - DOI - PMC - PubMed
    1. Lasocki A, Gaillard F. Non-contrast-enhancing tumor: a new frontier in glioblastoma research. AJNR Am J Neuroradiol. 2019;40:758–65 10.3174/ajnr.A6025 - DOI - PMC - PubMed
    1. Hudak AM, Peng L, Marquez de la Plata C, et al. . Cytotoxic and vasogenic cerebral oedema in traumatic brain injury: assessment with FLAIR and DWI imaging. Brain Inj 2014;28:1602–09 10.3109/02699052.2014.936039 - DOI - PubMed
    1. Hawkins-Daarud A, Rockne RC, Anderson ARA, et al. . Modeling tumor-associated edema in gliomas during anti-angiogenic therapy and its impact on imageable tumor. Front Oncol 2013;3:66 10.3389/fonc.2013.00066 - DOI - PMC - PubMed