. 2022 Jul;16(7):1843-1852.
doi: 10.1038/s41396-022-01235-6. Epub 2022 Apr 14.

Decreased thermal niche breadth as a trade-off of antibiotic resistance

Affiliations

Decreased thermal niche breadth as a trade-off of antibiotic resistance

Cristina M Herren et al. ISME J. 2022 Jul.

Abstract

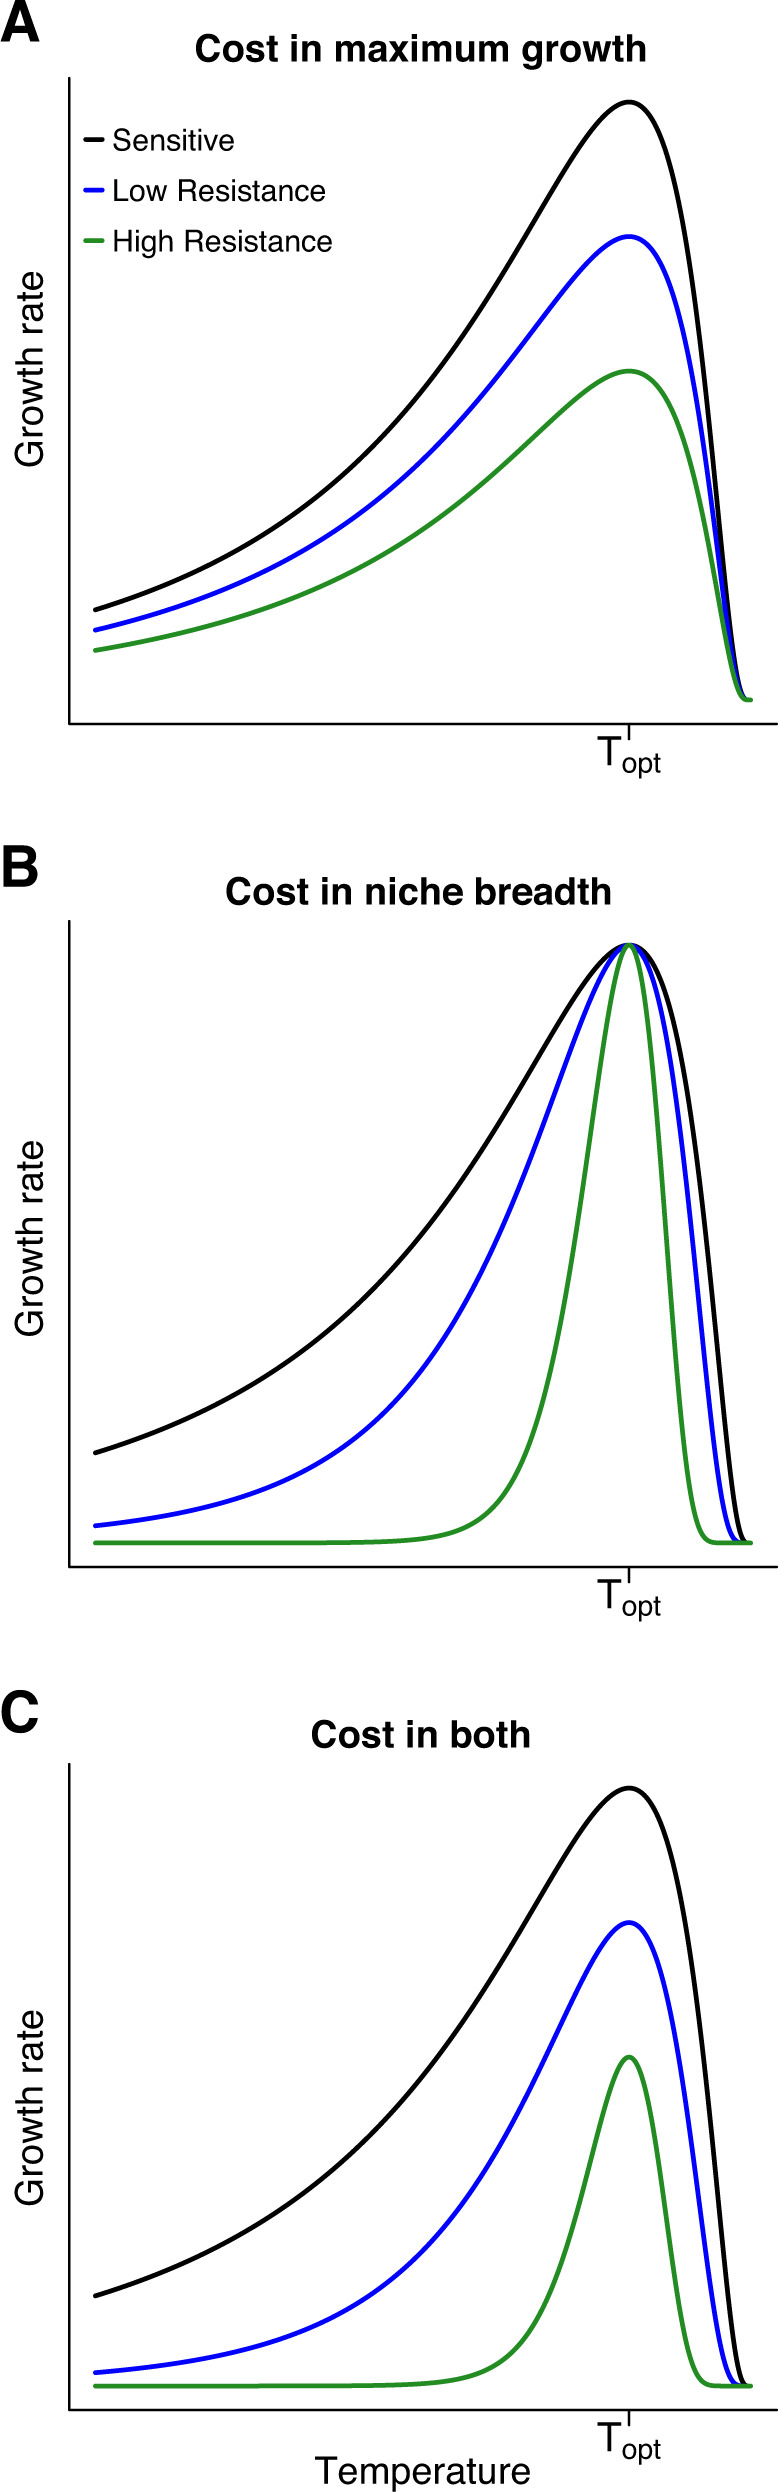
Evolutionary theory predicts that adaptations, including antibiotic resistance, should come with associated fitness costs; yet, many resistance mutations seemingly contradict this prediction by inducing no growth rate deficit. However, most growth assays comparing sensitive and resistant strains have been performed under a narrow range of environmental conditions, which do not reflect the variety of contexts that a pathogenic bacterium might encounter when causing infection. We hypothesized that reduced niche breadth, defined as diminished growth across a diversity of environments, can be a cost of antibiotic resistance. Specifically, we test whether chloramphenicol-resistant Escherichia coli incur disproportionate growth deficits in novel thermal conditions. Here we show that chloramphenicol-resistant bacteria have greater fitness costs at novel temperatures than their antibiotic-sensitive ancestors. In several cases, we observed no resistance cost in growth rate at the historic temperature but saw diminished growth at warmer and colder temperatures. These results were consistent across various genetic mechanisms of resistance. Thus, we propose that decreased thermal niche breadth is an under-documented fitness cost of antibiotic resistance. Furthermore, these results demonstrate that the cost of antibiotic resistance shifts rapidly as the environment changes; these context-dependent resistance costs should select for the rapid gain and loss of resistance as an evolutionary strategy.


Conflict of interest statement

The authors declare no competing interests.

Figures

Fig. 1
Fig. 1. Conceptual illustration of niche breadth and maximum growth rate as independent dimensions of fitness.
Because fitness costs in thermal niche breadth are independent of absolute growth rate, increasing resistance might show a decreased growth rate across all temperatures (cost in maximum growth rate, which occurs at the thermal optimum, Topt; A), a more rapid drop-off in growth rate away from the thermal optimum (cost in thermal niche breadth; B), or both a decreased maximum growth rate and a narrower thermal range (cost in both maximum growth rate and niche breadth; C).
Fig. 2
Fig. 2. Schematic of evolution experiment to obtain strains of varying chloramphenicol resistance.
Beginning with a common ancestor, grown with no chloramphenicol (CAM), we first passaged cultures at their MIC to create 24 replicate lineages. When transferring cultures to new media, we diluted cultures 1:10 during each passage. The rate of increase in antibiotic was a factor of √2 between sequential levels.
Fig. 3
Fig. 3. Strong fitness costs to both thermal niche breadth and maximum growth rate.
Absolute growth rates (measured as the maximum difference in sequential log-transformed optical densities) varied across the three temperatures, and were generally highest at 42 °C for a given culture (A). Increasing resistance, as measured by timepoint in the evolution experiment (darker colors indicate higher resistance levels), resulted in reduced maximum growth rates (A). These differences are more apparent when analyzing relative growth rates (i.e. the growth rates divided by the respective ancestral growth at T1 at each respective temperature) (B). As resistance increased, the relative growth rate decreased at 37 °C, but showed even larger declines at the novel temperatures of 32 °C and 42 °C (B). Of the three scenarios depicted in Fig. 1, these findings mirror Fig. 1C, where there are costs to both maximum growth rate and thermal niche breadth. Points show the mean and standard error of growth rates from measurements from each of the 24 lineages.
Fig. 4
Fig. 4. Resistant strains are outcompeted by their sensitive ancestors in the absence of drug, particularly at the warmer temperature.
Heatmaps show the performance of two strains in competition experiments at the 3 temperatures, with cell values giving the mean ratio of a strain’s population frequency after competition with another strain vs. competition with itself. The axes are the timepoints from which each strain was sampled. A value of 1 indicates no differential performance. Purple cells (values larger than 1) indicate that Strain 1 out-performed in final community composition, as compared with when that same strain was competed against a strain from the same timepoint, but sampled separately (and labeled with a different fluorophore, mCherry for Strain 2 vs. GFP for Strain 1). In contrast, darker pink cells (values smaller than 1) indicate that the first strain performed worse than in competition with the same timepoint. At 42 °C (C), the there was a greater differential in frequencies than at 32 °C or 37 °C (A, B), indicated by the darker colors (note the different scale bars between 42 °C and the other two temperatures).
Fig. 5
Fig. 5. Lineage-specific fitness costs in thermal tolerance.
While many lineages demonstrated a greater cost of resistance at 42 °C than the other two temperatures, some lineages showed no increased effect at the warmer temperature. Lineage 5 (A) is an example of an evolutionary trajectory where fitness costs were not substantially different across temperatures. The x-axis is the difference in experimental timepoints at which strains were collected (a proxy for minimum resistance level). The y-axis gives the change in performance of the GFP strain as compared with competition against the same timepoint. Conversely, lineage 19 (B) shows an example of a strong interactive effect of fitness costs and temperature, where strain performance is more impacted by resistance at 42 °C (red circles) than at the other two temperatures.
Fig. 6
Fig. 6. Transition of resistance strategies across the chloramphenicol gradient.
The types of mutations acquired at each timesteps changed as antibiotic levels increased. The most common pathways to resistance at the four timepoints were mutations in the acr efflux pump (T1), ATP synthase genes (T5), outer-membrane proteins (T9), and the mdfA efflux pump (T13).
Fig. 7
Fig. 7. Effects of mutations are more extreme at a warmer temperature.
Results of the linear regression quantifying the effects of mutations within 37 genes show that the estimated impact of mutations is greatest at 42 °C, as compared with 32 °C or 37 °C. Values in histograms are the coefficients from the linear model, where each coefficient is the estimated effect of a gene-specific mutation on the ratio of that strain in competition. Effect sizes near zero indicate no effect, whereas an effect size of 1 indicates a one-log-fold increase in the competitive success of a strain that has acquired a mutation in the given gene. The variance of effect sizes at 42 °C is significantly greater than at the other two temperatures.

References

    1. Chatterjee A, Modarai M, Naylor NR, Boyd SE, Atun R, Barlow J, et al. Quantifying drivers of antibiotic resistance in humans: a systematic review. Lancet Infect Dis. 2018;18:e368–e378. doi: 10.1016/S1473-3099(18)30296-2. - DOI - PubMed
    1. Andersson DI, Hughes D. Antibiotic resistance and its cost: is it possible to reverse resistance? Nat Rev Microbiol. 2010;8:260–71. doi: 10.1038/nrmicro2319. - DOI - PubMed
    1. Law R. Optimal life histories under age-specific predation. Am Nat. 1979;114:399–417. doi: 10.1086/283488. - DOI
    1. Luciani F, Sisson SA, Jiang H, Francis AR, Tanaka MM. The epidemiological fitness cost of drug resistance in Mycobacterium tuberculosis. Proc Natl Acad Sci USA. 2009;106:14711–5. doi: 10.1073/pnas.0902437106. - DOI - PMC - PubMed
    1. El Meouche I, Dunlop MJ. Heterogeneity in efflux pump expression predisposes antibiotic-resistant cells to mutation. Science. 2018;362:686–90. - PMC - PubMed

Publication types