. 2022 May;7(5):620-629.
doi: 10.1038/s41564-022-01101-3. Epub 2022 Apr 14.

Drinking water chlorination has minor effects on the intestinal flora and resistomes of Bangladeshi children

Affiliations

Drinking water chlorination has minor effects on the intestinal flora and resistomes of Bangladeshi children

Maya L Nadimpalli et al. Nat Microbiol. 2022 May.

Abstract

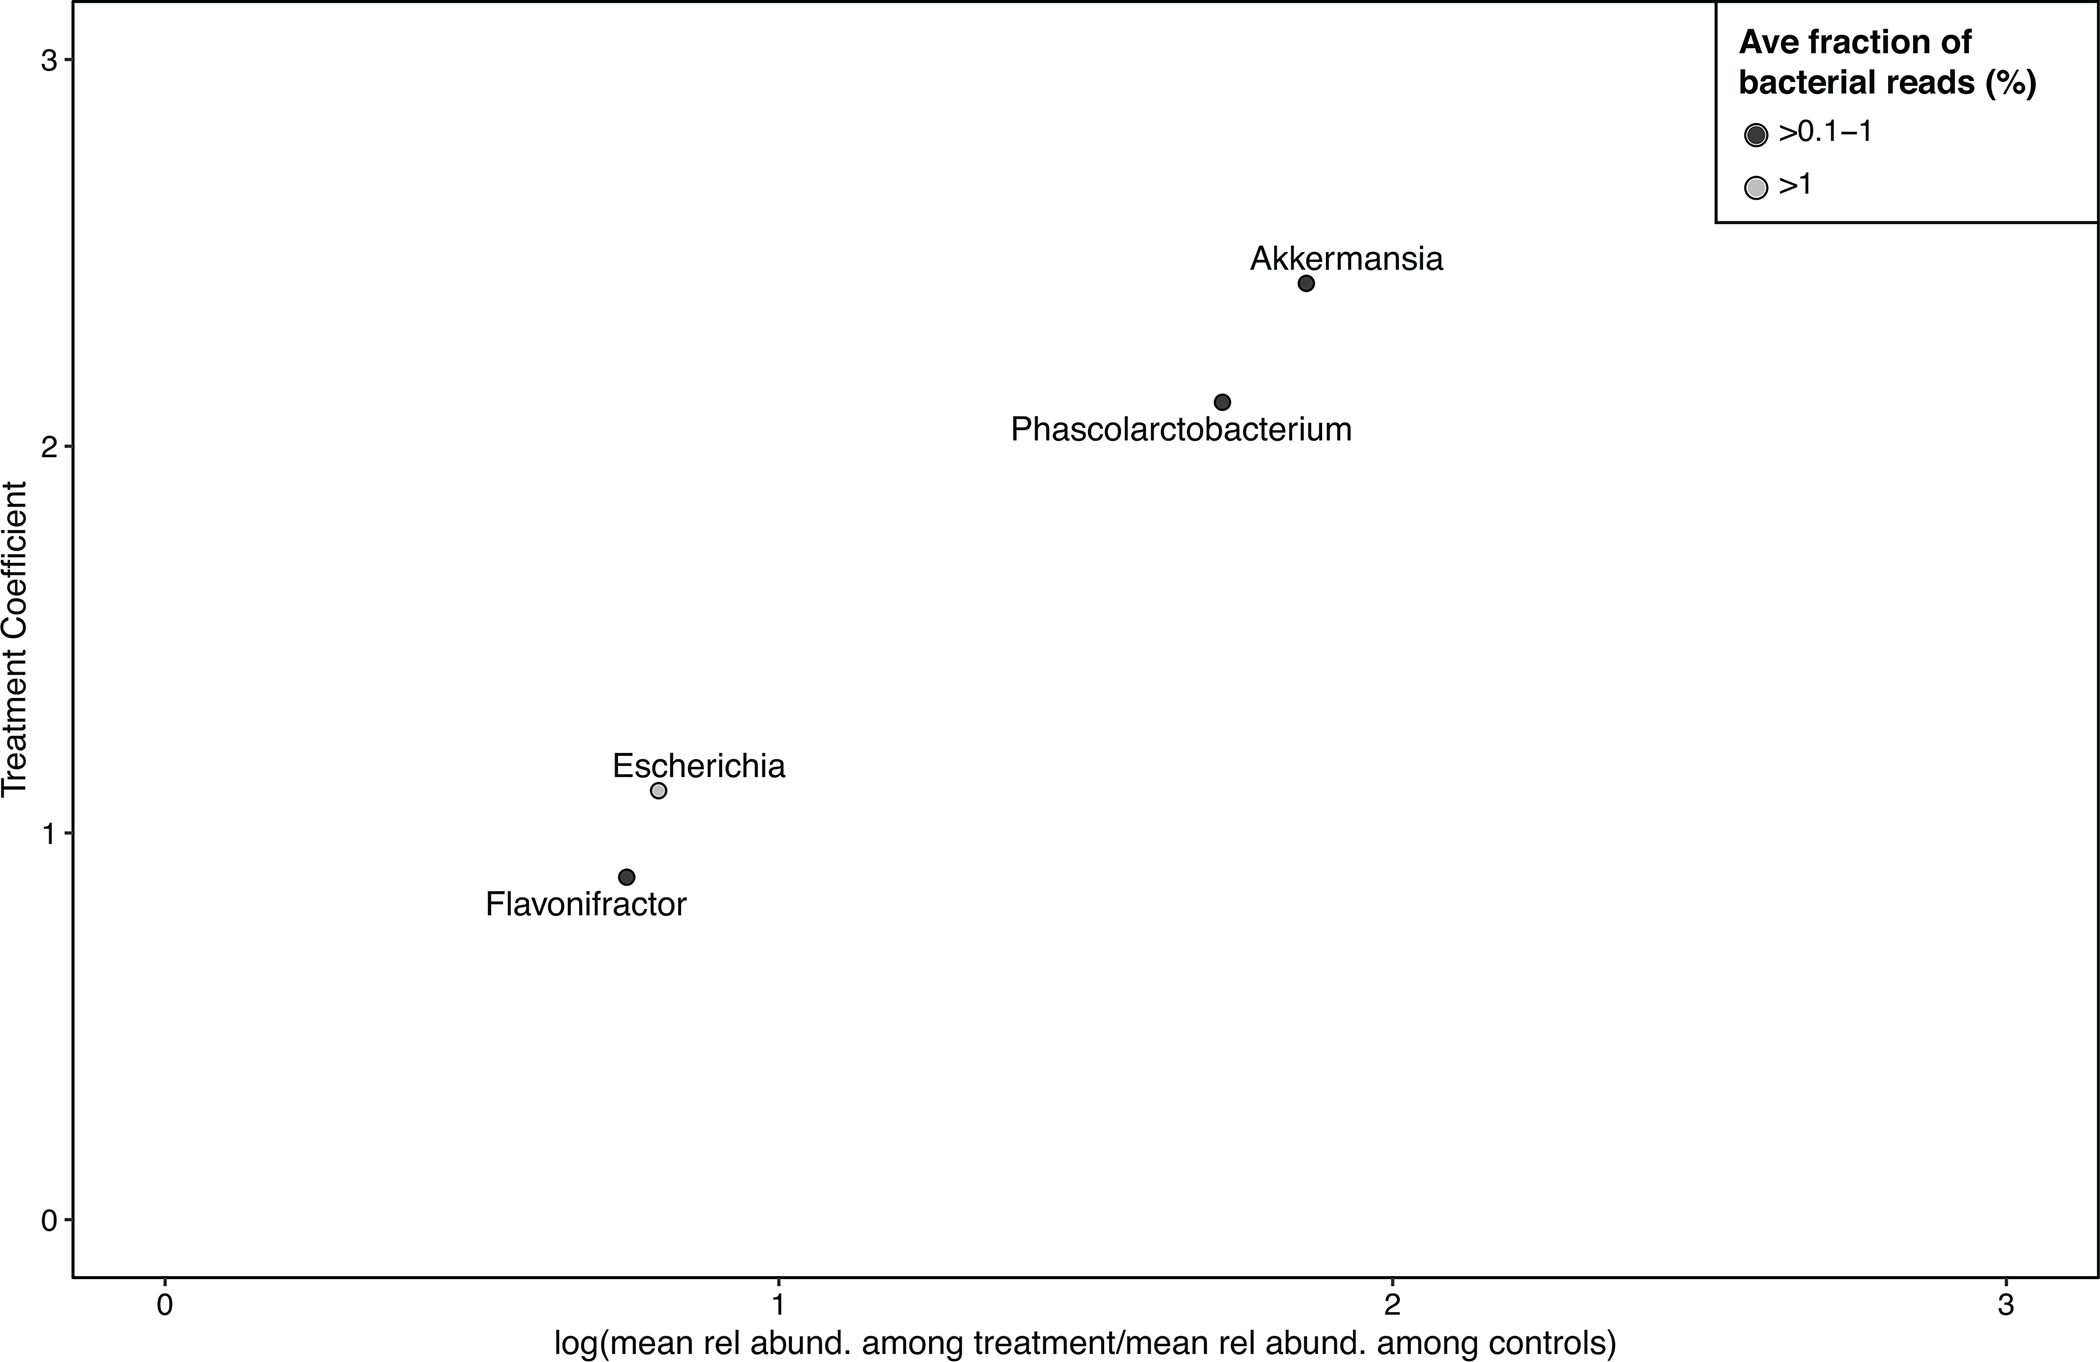
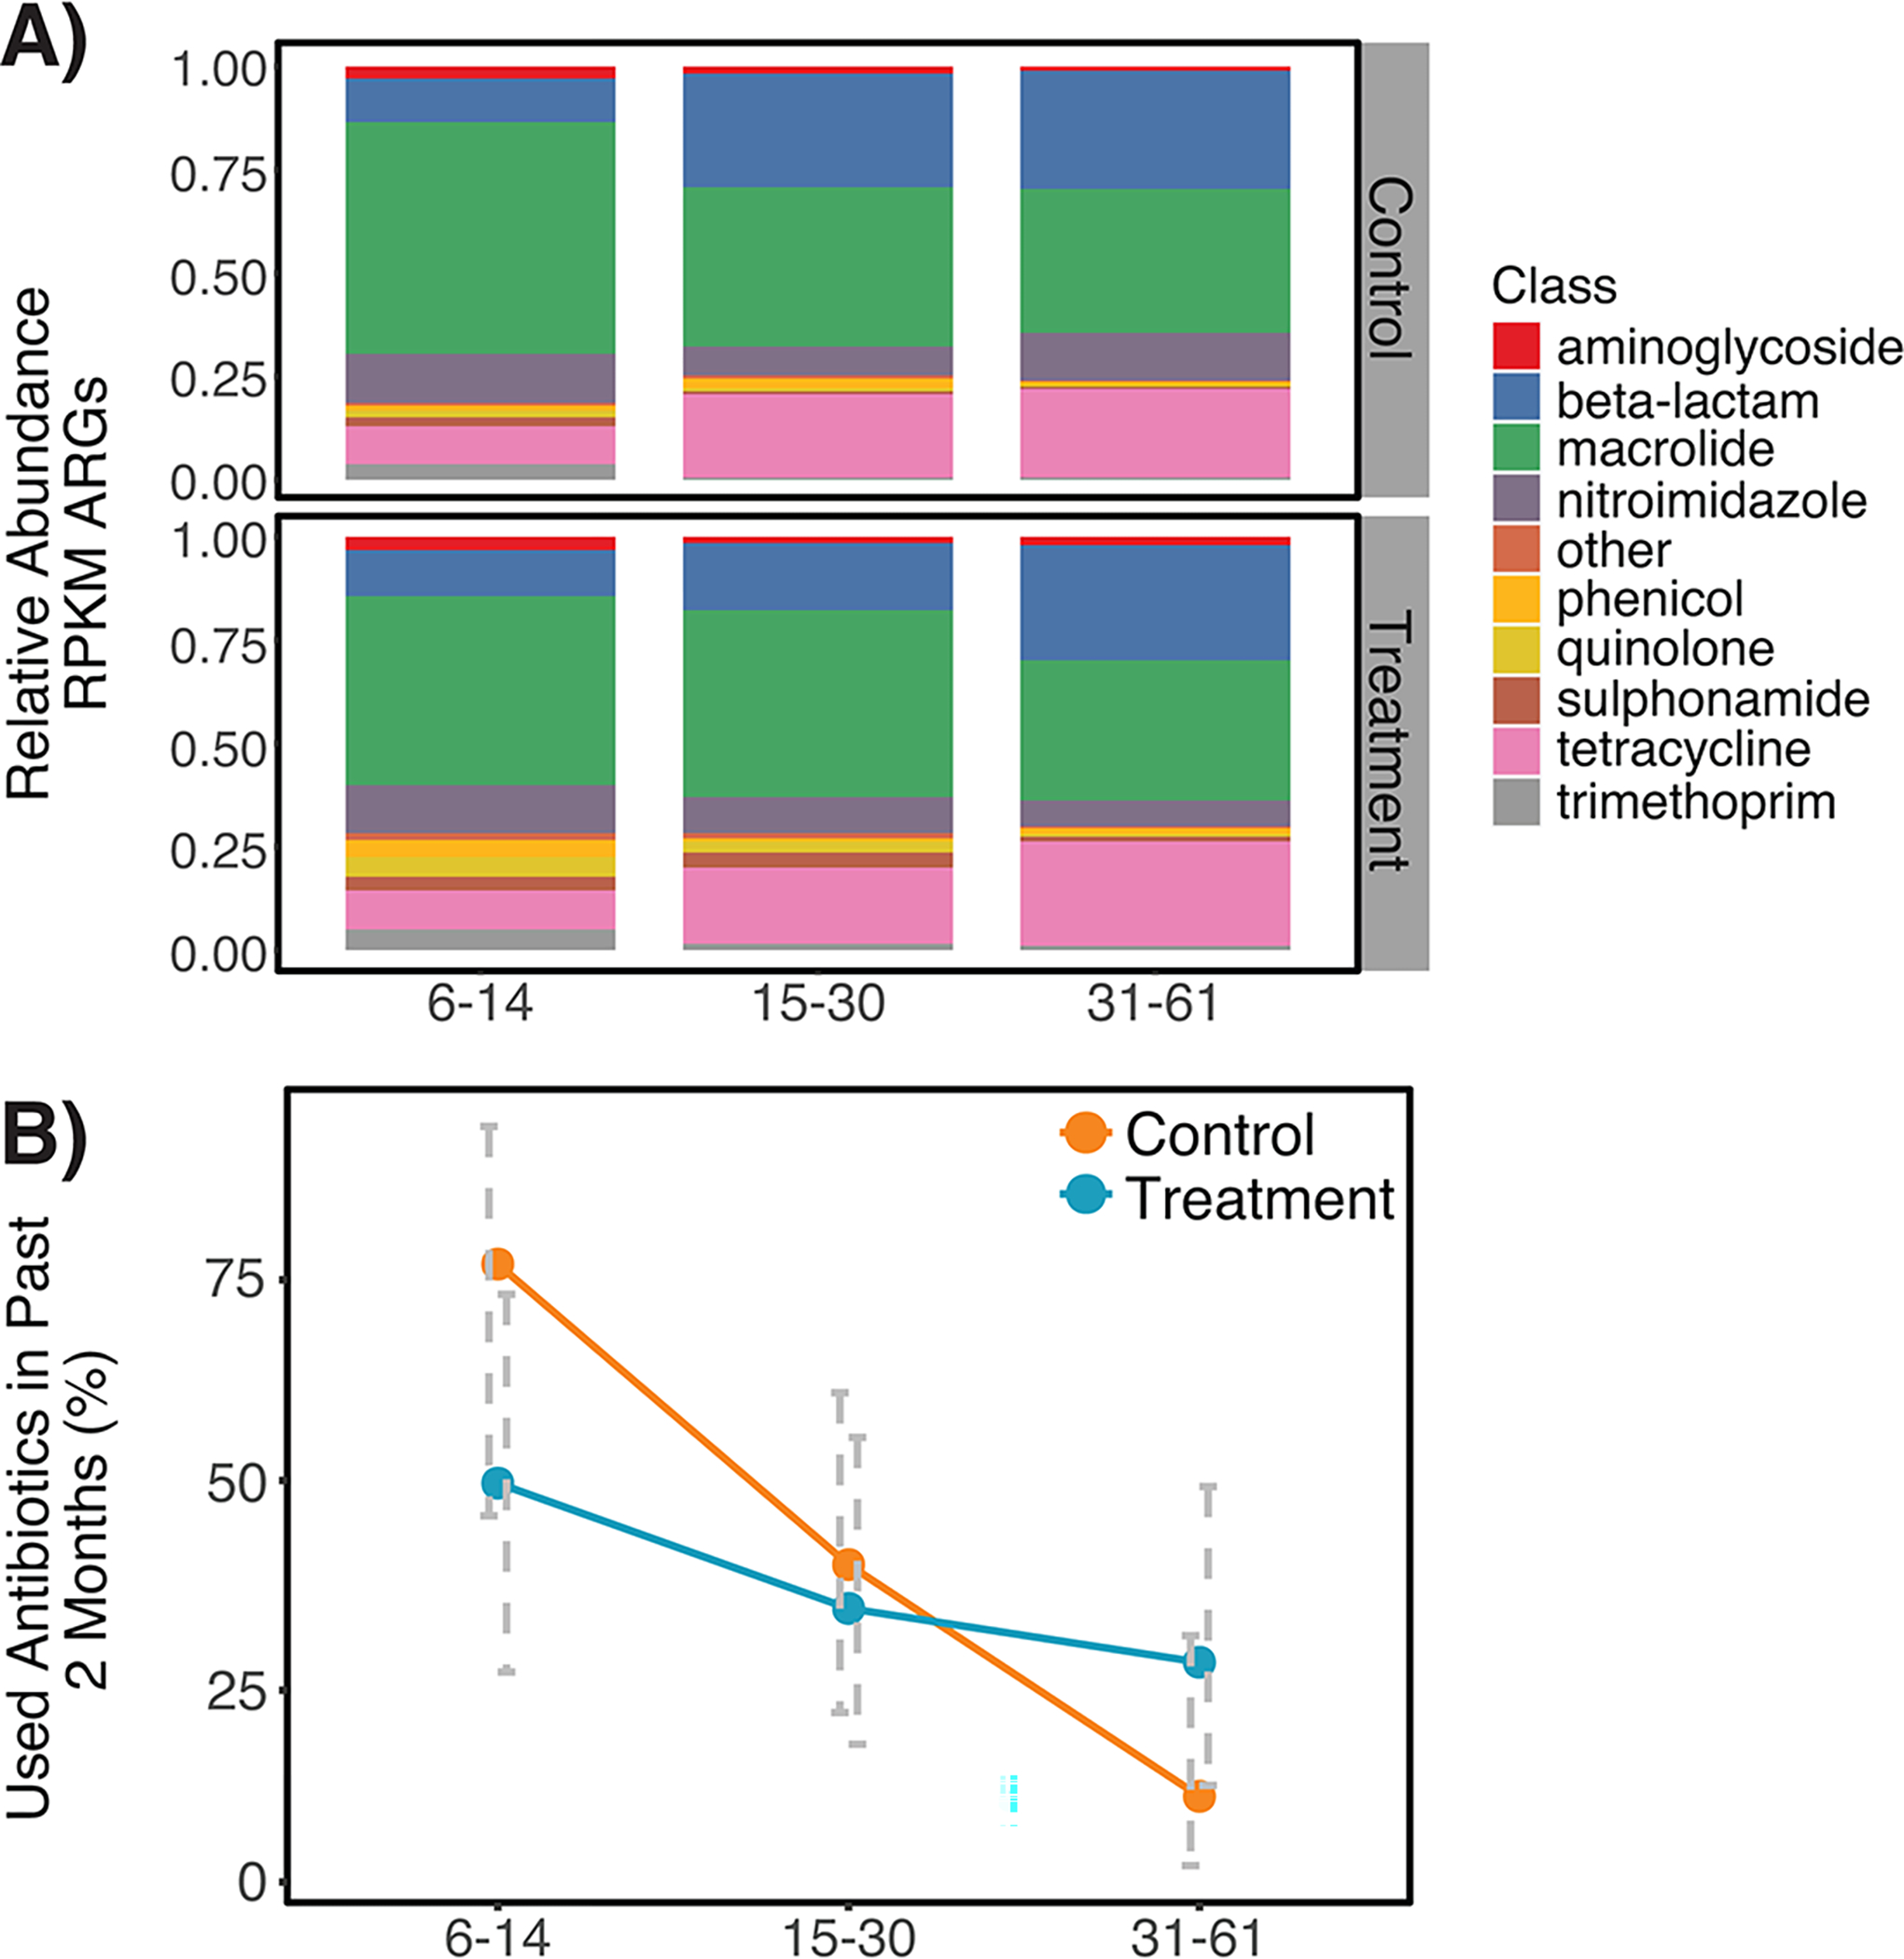
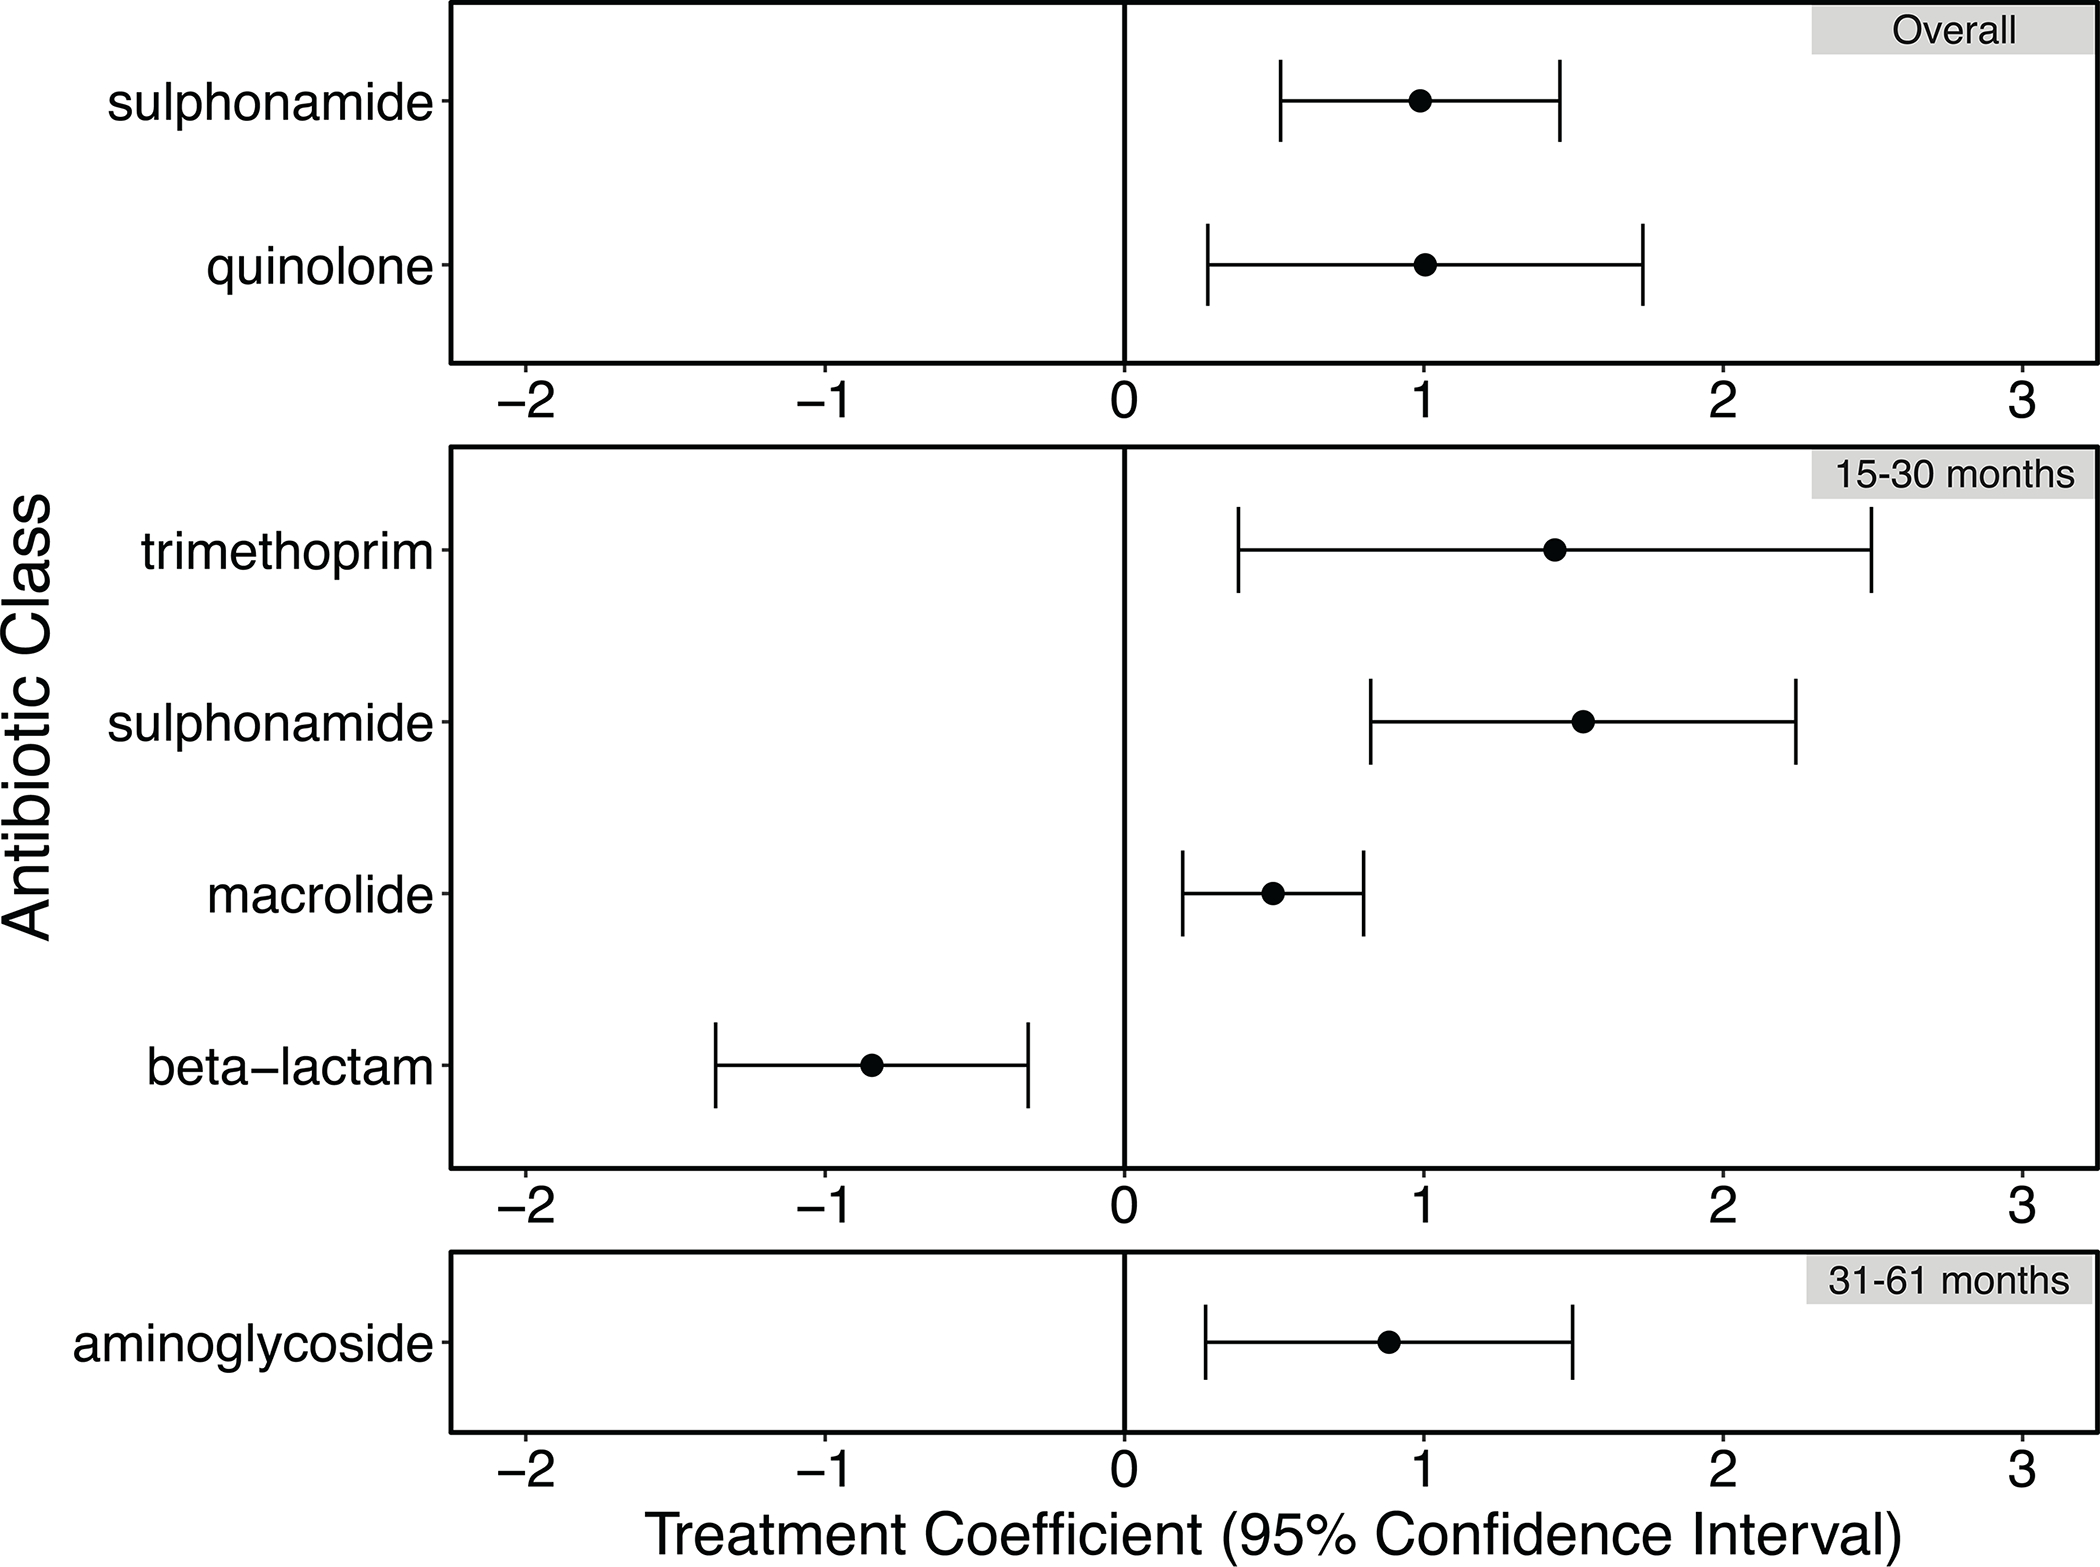
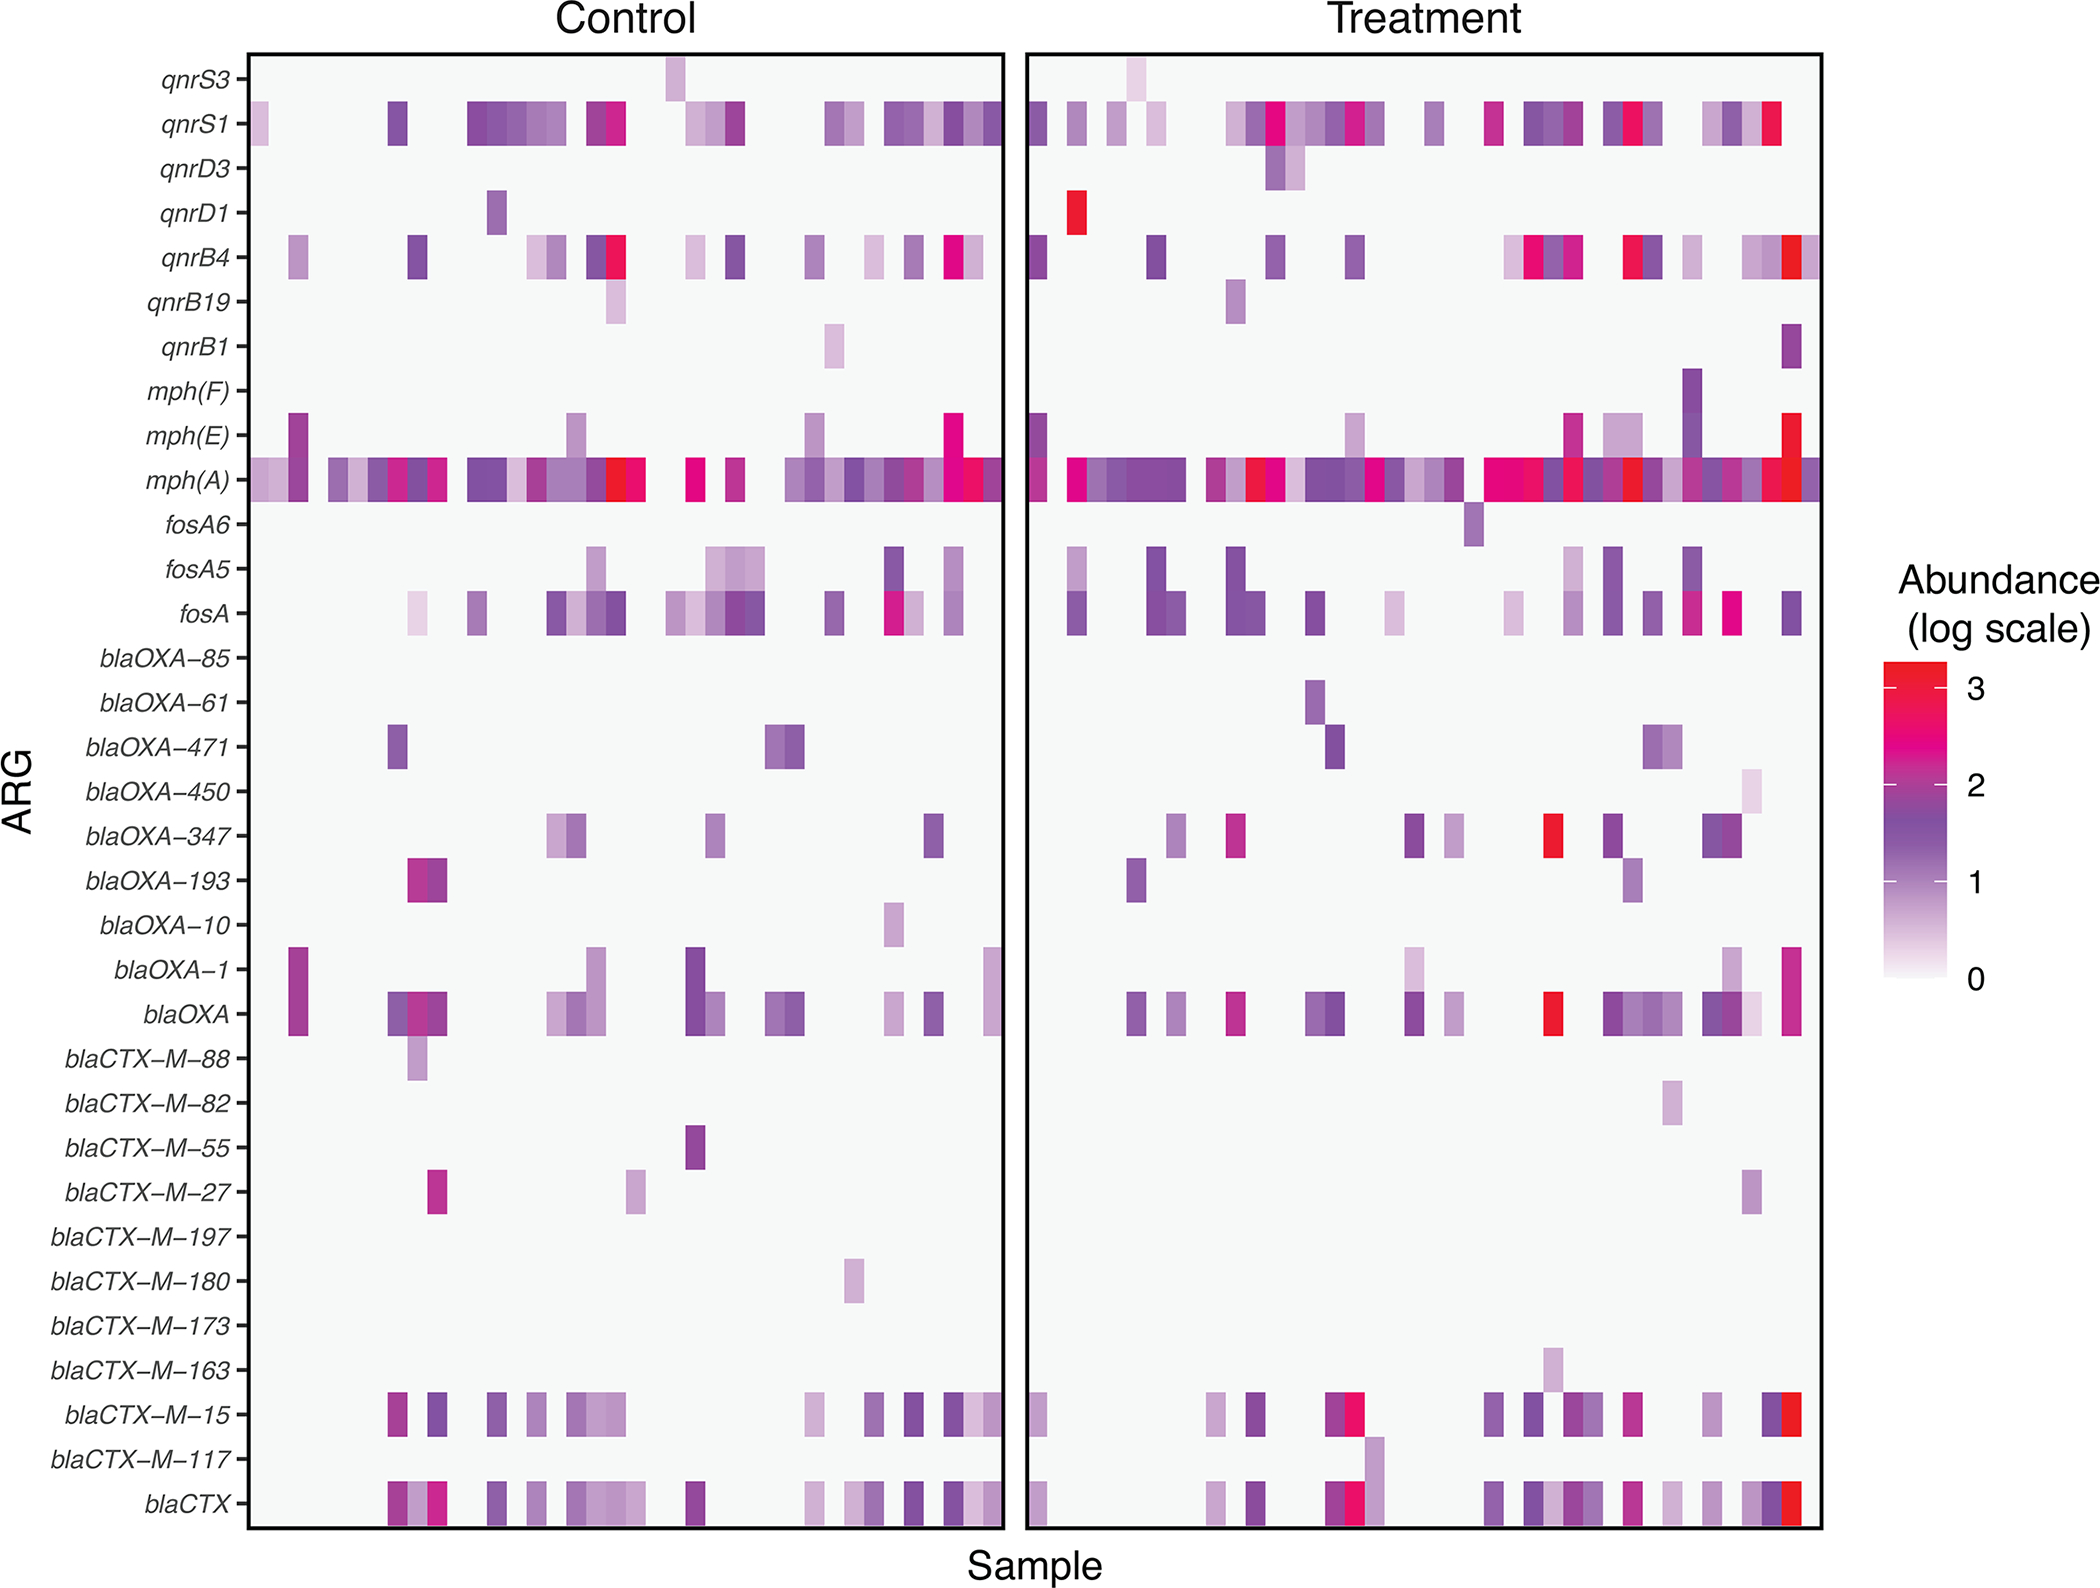
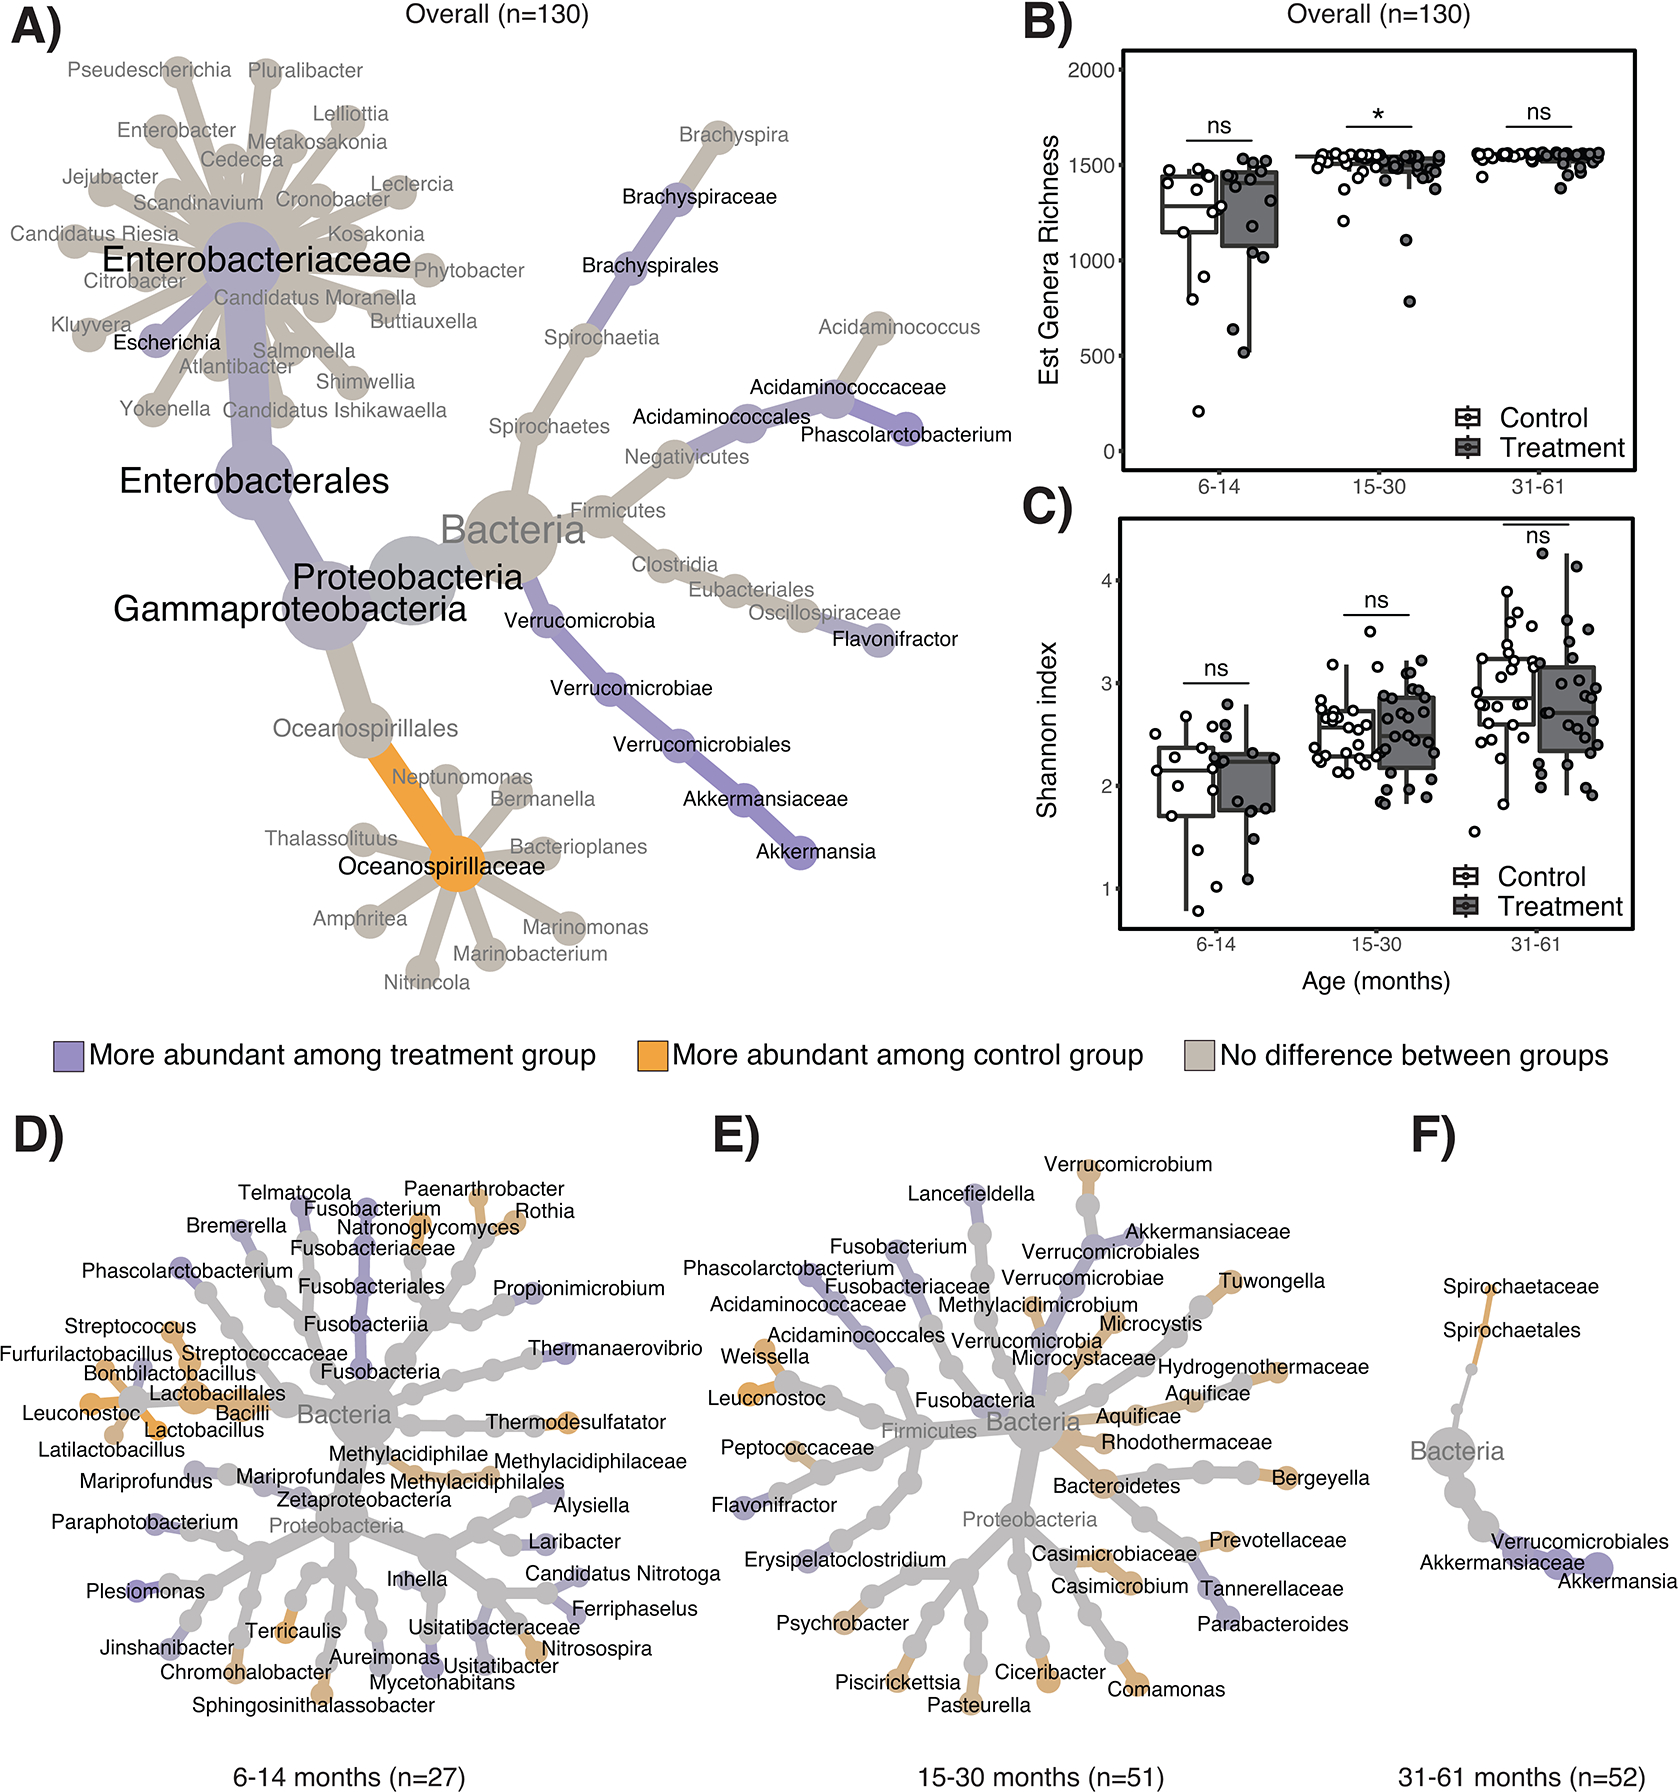
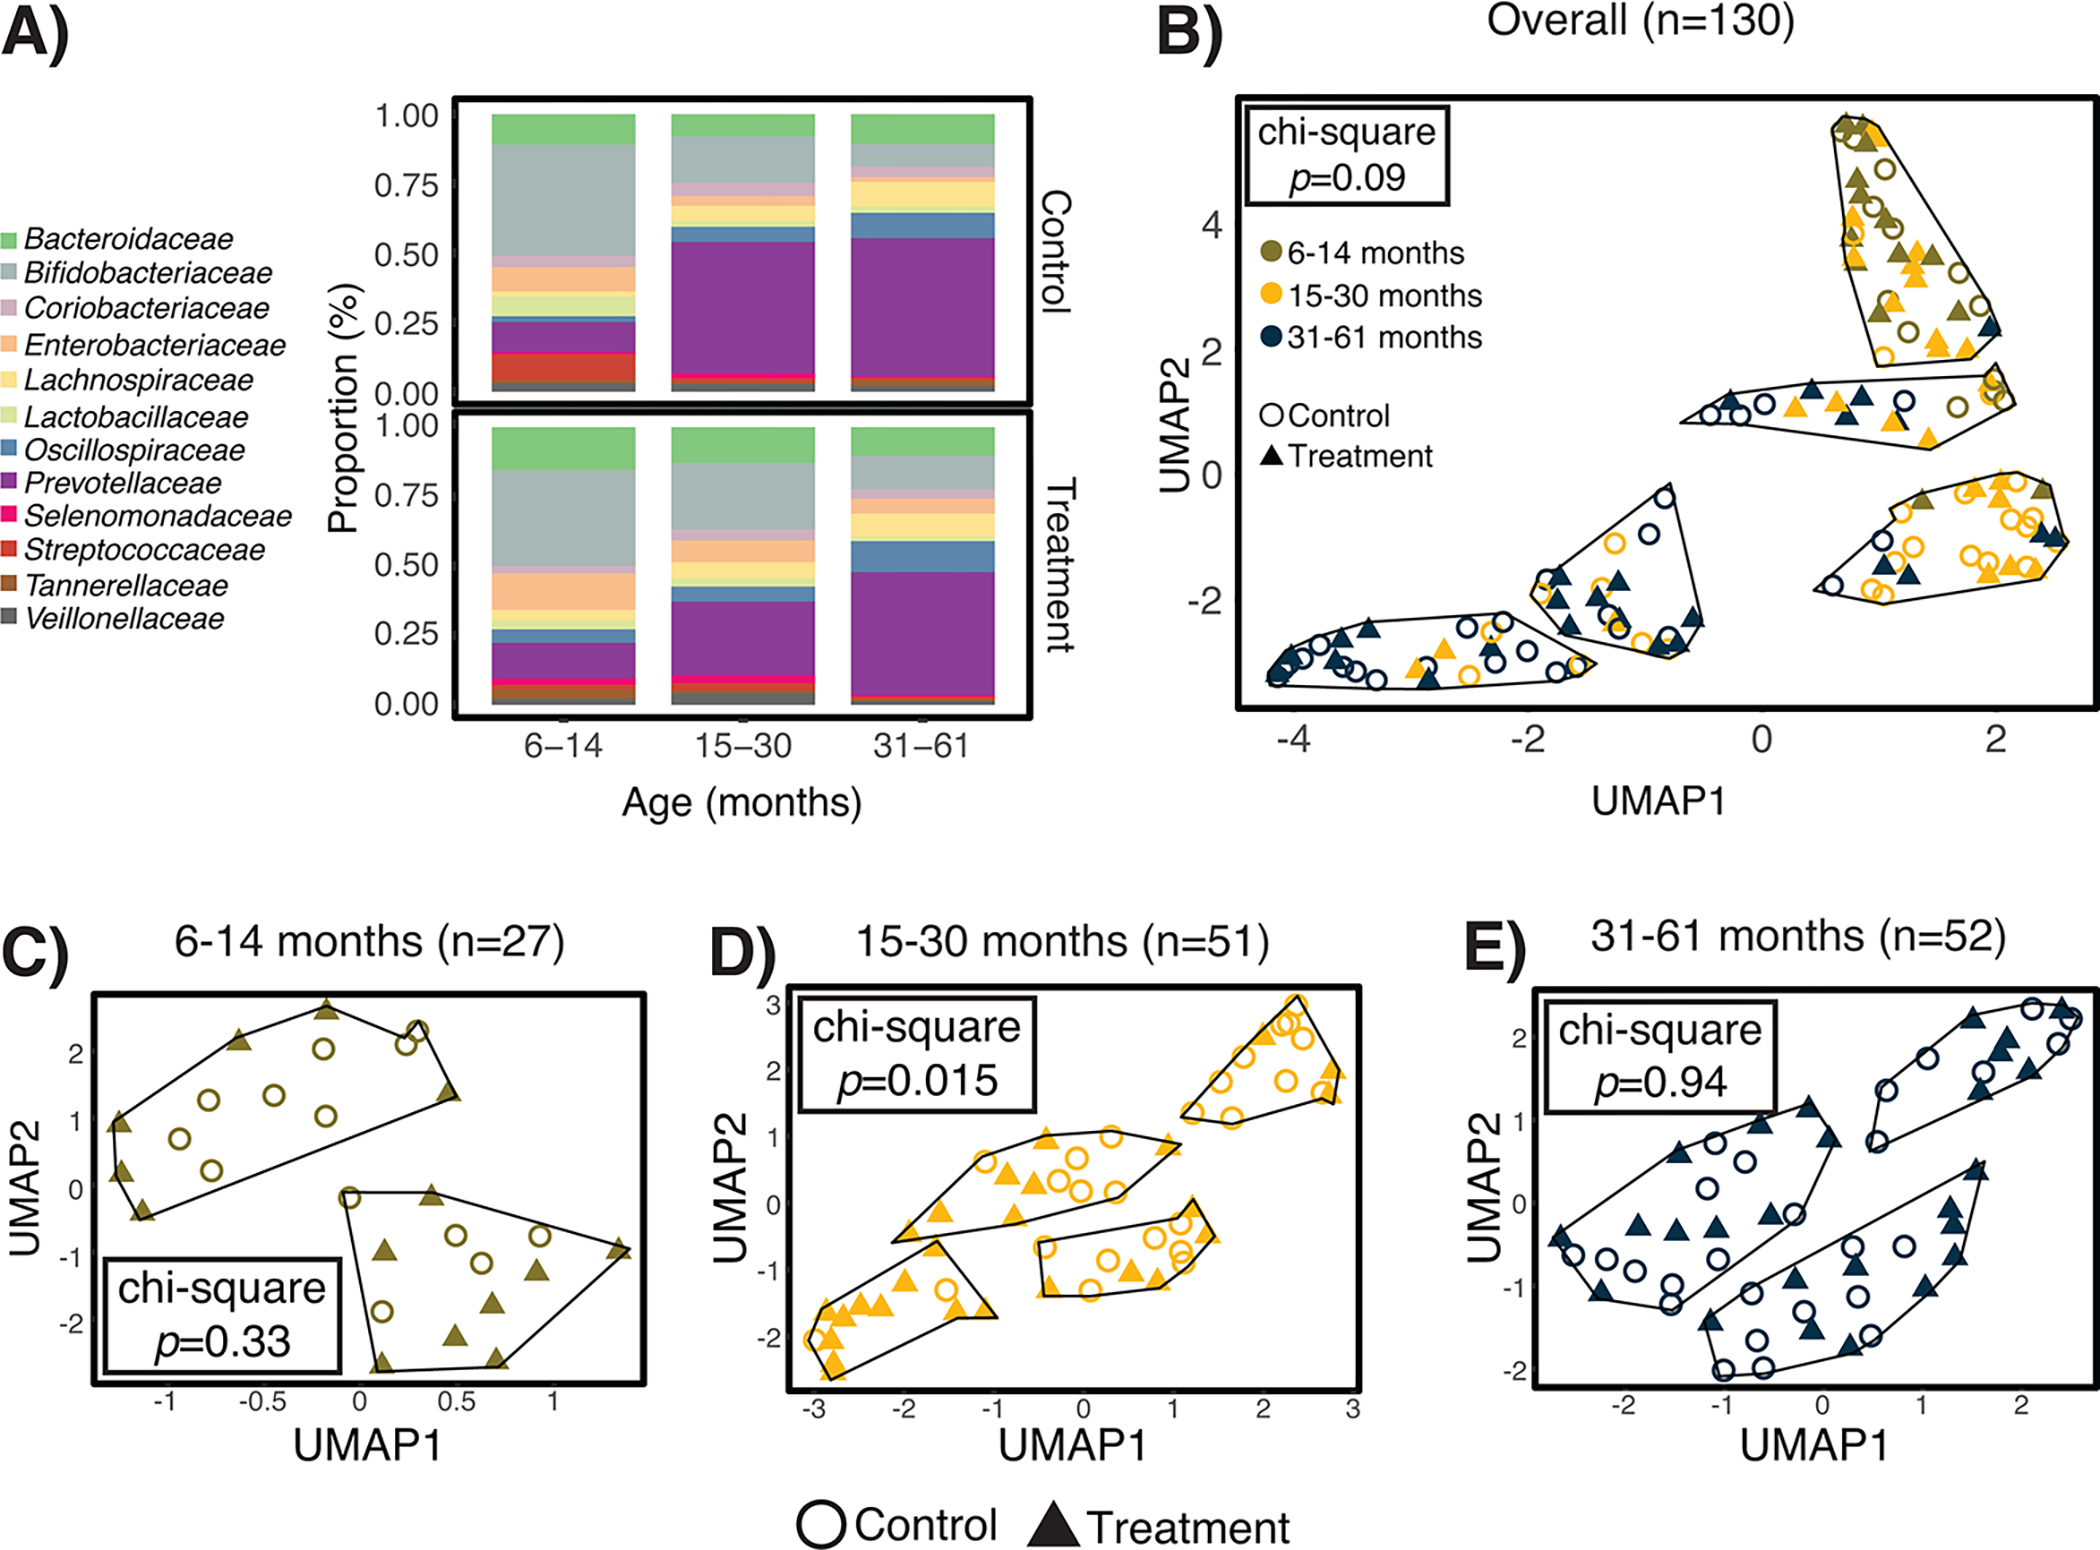
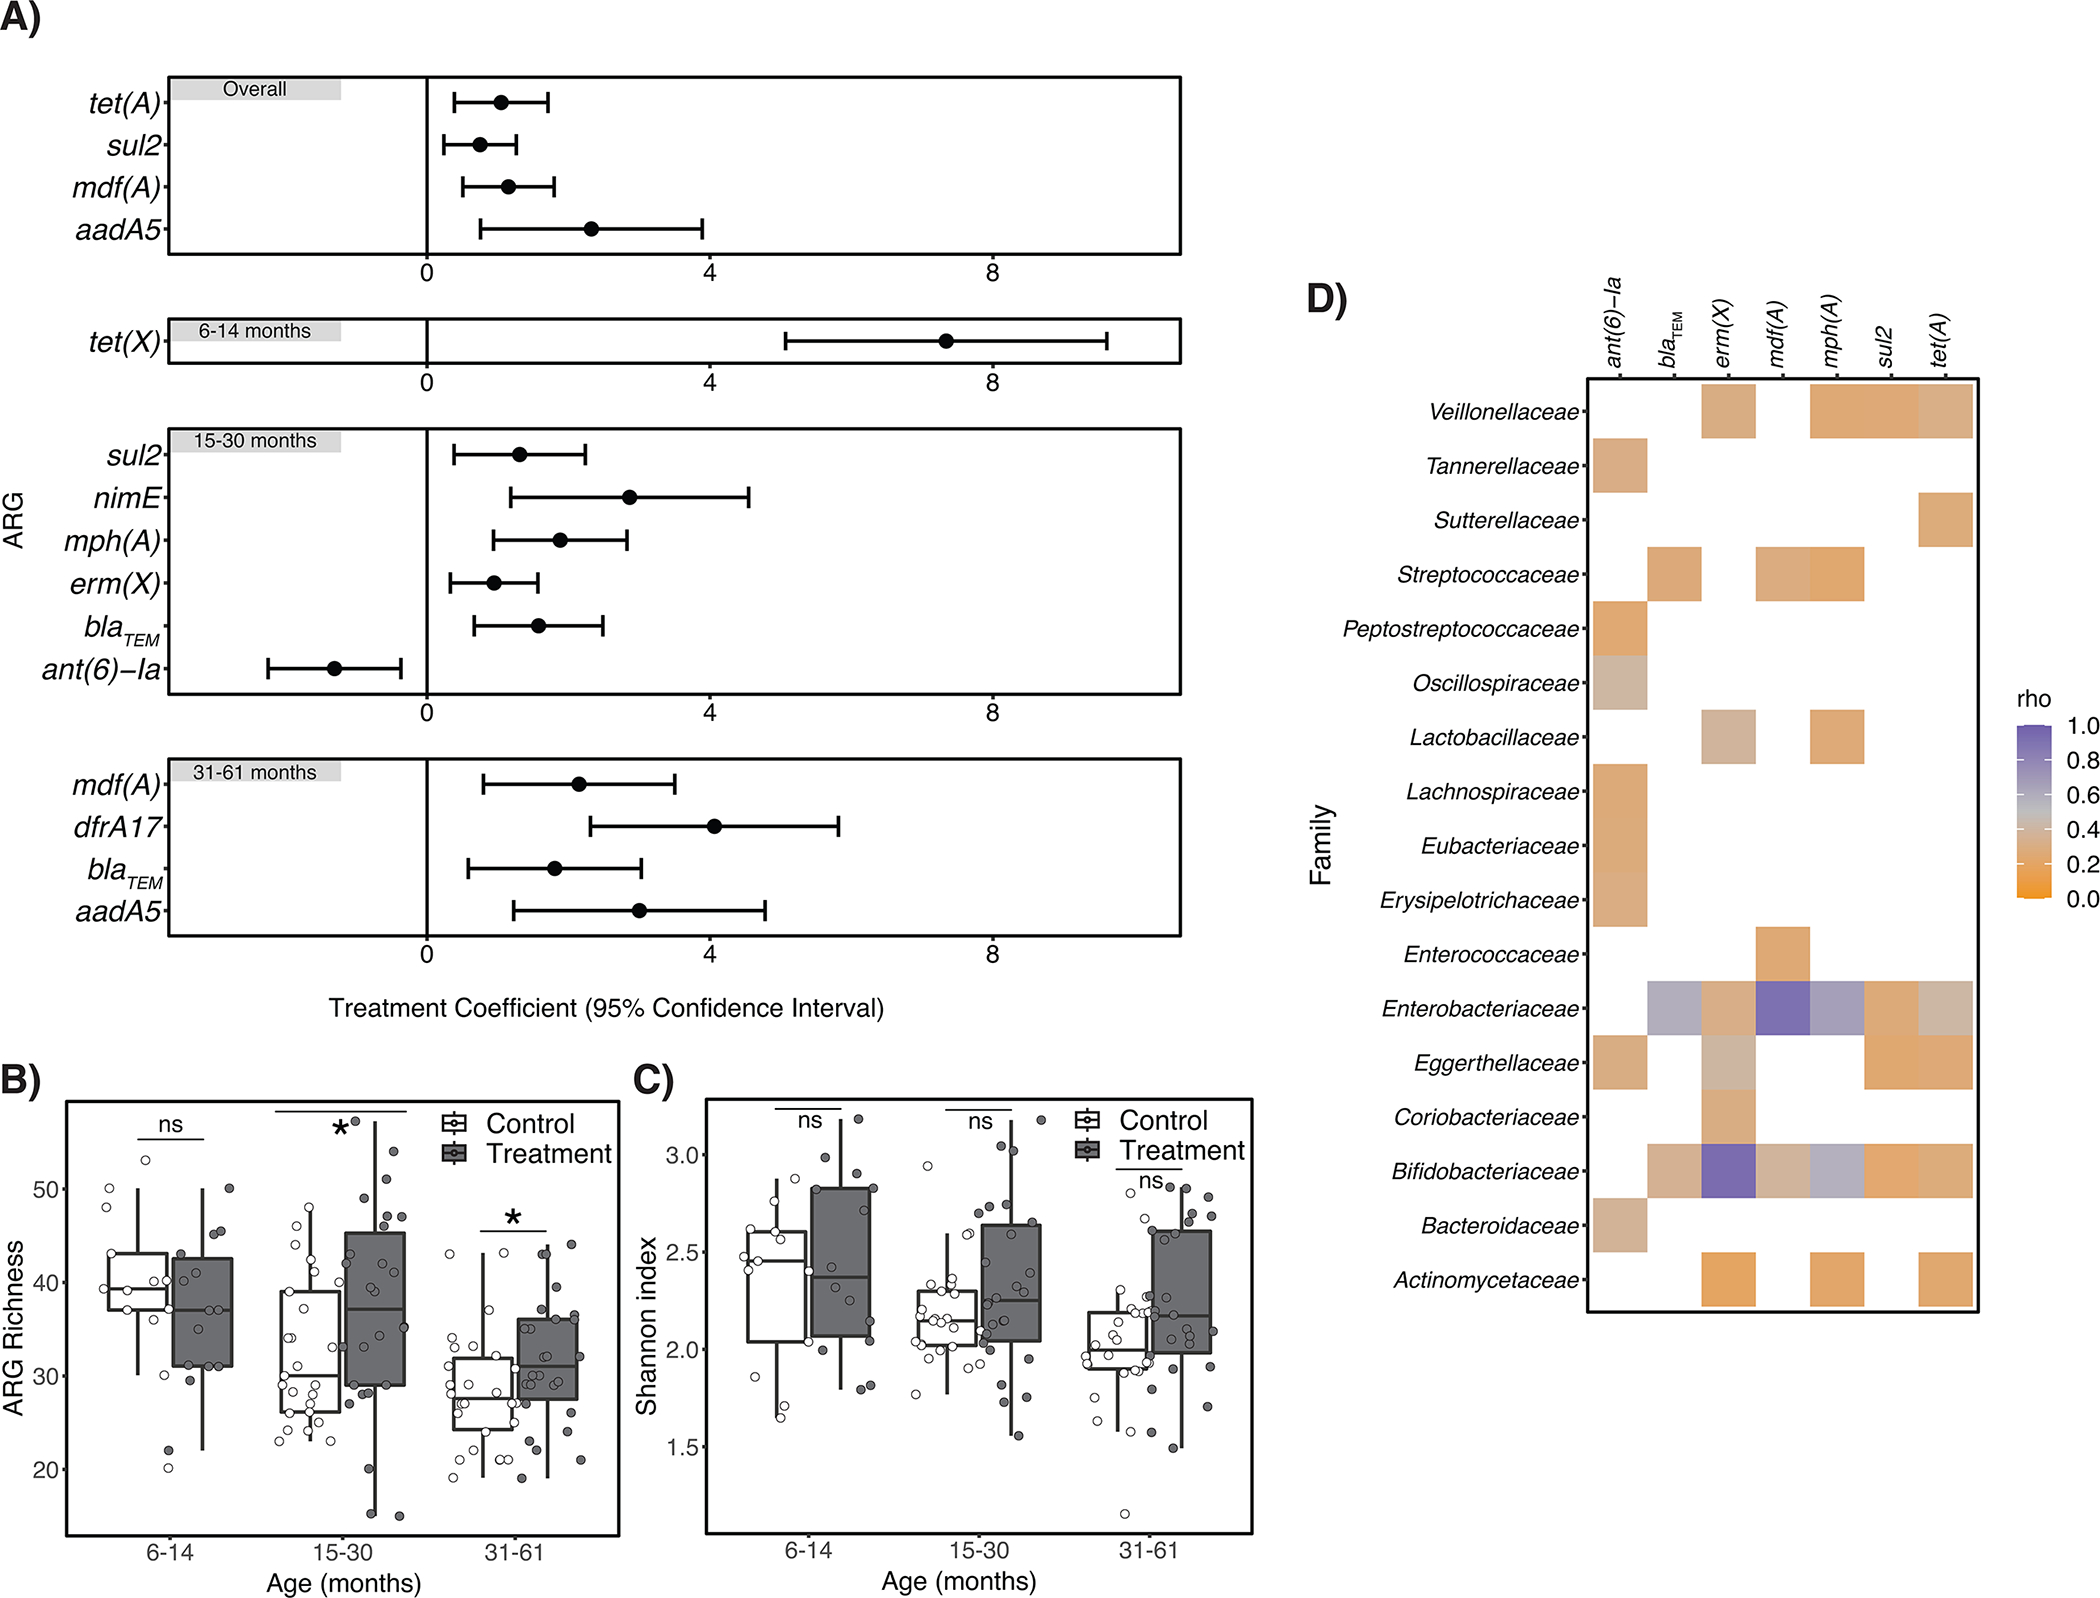
Healthy development of the gut microbiome provides long-term health benefits. Children raised in countries with high infectious disease burdens are frequently exposed to diarrhoeal pathogens and antibiotics, which perturb gut microbiome assembly. A recent cluster-randomized trial leveraging >4,000 child observations in Dhaka, Bangladesh, found that automated water chlorination of shared taps effectively reduced child diarrhoea and antibiotic use. In this substudy, we leveraged stool samples collected from 130 children 1 year after chlorine doser installation to examine differences between treatment and control children's gut microbiota. Water chlorination was associated with increased abundance of several bacterial genera previously linked to improved gut health; however, we observed no effects on the overall richness or diversity of taxa. Several clinically relevant antibiotic resistance genes were relatively more abundant in the gut microbiome of treatment children, possibly due to increases in Enterobacteriaceae. While further studies on the long-term health impacts of drinking chlorinated water would be valuable, we conclude that access to chlorinated water did not substantially impact child gut microbiome development in this setting, supporting the use of chlorination to increase global access to safe drinking water.


Conflict of interest statement

Competing interests statement

The authors report no relevant financial or non-financial competing interests.

Figures

Extended Data. Fig. 1
Extended Data. Fig. 1. Treatment coefficients generated by the R package corncob, representing the additive change in the logit-transformed relative abundance of bacterial genera between treatment and control children, compared to the log of the ratio of the mean relative abundance among treatment children to the mean relative abundance among control children, i.e., the log fold change.
Treatment coefficients generated by corncob generally approximate the log fold change.
Extended Data Fig. 2
Extended Data Fig. 2. Average fraction of reads from 130 Bangladeshi children’s gut metagenomes that were not classified to any taxonomy by Kraken2, stratified by age.
Error bars represent the 95% confidence interval around the mean. The proportion of unclassified reads significantly differed at the p=0.05 level between treatment and control children aged 15–30 months by a two-sided, two-sample t-test, but not among other age strata. The number of biologically independent samples considered for each age strata is as follows: 6–14 months, n=27; 15–30 months, n=51; 31–61 months, n=52.
Extended Data Fig. 3
Extended Data Fig. 3. Gut resistomes and antibiotic consumption patterns among 130 children participating in an automated water chlorination trial in urban Bangladesh.
Panel A) depicts relative abundance of antibiotic resistance genes (ARGs) belonging to each ARG class harbored by the fecal metagenomes of control and treatment children, expressed as reads per kilobase of read per million (RPKM). Panel B) depicts the average proportion of control and treatment children whose caretakers reported they had consumed antibiotics in the two months prior to stool collection, stratified by age. Error bars represent the 95% confidence interval around the mean. Antibiotic use was significantly associated with age strata (p<0.001 by chi-square) but was not associated with treatment status in this subset of children from the parent trial. For both panels, the number of biologically independent samples considered for each age strata is as follows: 6–14 months, n=27; 15–30 months, n=51; 31–61 months, n=52.
Extended Data Fig. 4
Extended Data Fig. 4. Differences in resistance to specific antibiotic classes as detected in the fecal metagenomes of 130 children participating in an automated water chlorination trial in urban Bangladesh.
Treatment coefficients were generated by the R package corncob. Positive treatment coefficients indicate that ARGs belonging to the given antibiotic class were relatively more abundant among treatment children relative to controls; negative treatment coefficients indicate ARGs belonging to the given antibiotic class were relatively less abundant. Error bars depict the 95% confidence interval around the treatment coefficient. The number of biologically independent samples examined for each age strata is as follows: 15–30 months, n=51; 31–61 months, n=52. The “Overall” category included 130 biologically independent samples.
Extended Data Fig. 5
Extended Data Fig. 5. Relative abundance of genes conferring resistance to medically important antibiotics in the fecal metagenomes of 130 children participating in an automated chlorinated water intervention trial in urban Bangladesh.
Genes conferring resistance to fluoroquinolones (qnr), azithromycin (mph), fosfomycin (fos), beta lactams (blaOXA), and third-generation cephalosporins (blaCTX) were detected. Genes conferring resistance to colistin and carbapenems, which are considered “last-resort” antibiotics, were not detected.
Extended Data Fig. 6
Extended Data Fig. 6. Comparison of two sets of extraction controls, extracted from the stool of a child aged 6–14 months (Sample A) and 31–61 months (Sample B).
Within each set of duplicates, we observed a similar relative abundance of bacterial families and genera that comprised at least 1% of bacterial reads among all fecal metagenomes sequenced for this study. We observed some discordance in the genera that were identified within each extraction pair (3 discordant genera versus 1552 concordant genera among extraction duplicates for Sample A; 85 discordant genera versus 1063 concordant genera among extraction duplicates for Sample B); however, all discordant genera were of exceptionally low abundance (<0.007%).
Figure 1.
Figure 1.. Differentially abundant gut taxa among children aged 6–61 months who were cluster randomized to an automated chlorinated water intervention in urban Bangladesh and effects on overall richness and diversity.
Panel A) is a differential heat tree depicting the taxonomies of bacterial genera and families that significantly differed in their relative abundance between treatment and control children. Genera within differentially abundant families are also depicted. For any given taxonomic level, only taxa that were significantly less abundant (orange) or more abundant (purple) among treatment relative to control children are depicted in color; non-significant taxa are depicted in gray. Panel B) depicts estimated genera richness and Panel C) depicts Shannon diversity indices for treatment and control children, stratified by child age. Estimated genera richness differed between treatment and control children aged 15–30 months by two-sided Wilcoxon signed-rank test (p=0.04); Shannon diversity did not significantly differ for any age stratum using two-sided Wilcoxon signed-rank tests. For all box plots, center line indicates the median; box limits indicate the upper and lower quartiles; and whiskers indicate 1.5x interquartile range. Panels D) – E) are differential heat trees depicting the taxonomies of bacterial genera and families that significantly differed in their relative abundance between treatment and control children aged D) 6–14 months, E) 15–30 months, and F) 31–61 months, controlling for study site. Note: ns=non-significant. *indicates p<0.05 by Wilcoxon signed-rank test.
Figure 2.
Figure 2.. Effects of automated water chlorination on the taxonomic structure of children’s gut microbiomes in urban Bangladesh.
Water chlorination impacted the structure of the gut microbiomes of children aged 15–30 months, but not younger or older children. Panel A) depicts the average relative abundance of bacterial families with ≥1% mean relative abundance across all samples. Panel B) is a two-dimensional representation of the pairwise genomic distances between each sample, as identified by Mash. We observed a marginal association between treatment status and cluster classification by the chi-square test. Panels C-E) depict pairwise distances and resulting clusters when stratified by child age. Treatment status was only associated with cluster classifications among children aged 15–30 months.
Figure 3.
Figure 3.. Effects of automated water chlorination on the richness, diversity, and relative abundance of antibiotic resistance genes (ARGs) harbored by children’s intestinal flora in urban Bangladesh.
Panel A) describes ARGs that were differentially abundant between treatment and control children (n=130 biologically independent samples), controlling for study site (and child age in the “Overall” panel only). Error bars depict the 95% confidence interval around the treatment coefficient. Positive treatment coefficient values indicate ARGs were more abundant among treatment children relative to controls; negative values indicate ARGs were less abundant. Panel B) depicts the estimated number of unique ARGs (i.e., ARG richness) detected in children’s fecal metagenomes, stratified by child age. Estimated ARG richness significantly differed between treatment and control children aged 15–30 months (p=0.015) and 31–61 months (p=0.016) controlling for study site and using the betta function of the R package breakaway. Panel C) depicts the Shannon diversity indices for treatment and control children, stratified by child age. There was no statistical association between treatment status and ARG diversity for any age stratum by two-sided Wilcoxon signed-rank test. For all box plots, center line indicates the median; box limits indicate the upper and lower quartiles; and whiskers indicate 1.5x interquartile range. For Panels A) – C) the number of biologically independent samples considered for each age strata is as follows: 6–14 months, n=27; 15–30 months, n=51; 31–61 months, n=52. Panel D) is a heatmap depicting the strength of the association between ARGs listed in Panel A) that occurred in at least half of samples and bacterial families that occurred in at least half of samples, as determined by Spearman correlation tests. Resulting rho values are only depicted for statistically significant correlations (p<0.05 after adjustment for multiple testing using the Benjamini–Hochberg method.). Note: ns=non-significant. *indicates p≤0.05.

References

    1. Stewart CJ et al. Temporal development of the gut microbiome in early childhood from the TEDDY study. Nature 562, 583–588 (2018). - PMC - PubMed
    1. Robertson RC, Manges AR, Finlay BB & Prendergast AJ The Human Microbiome and Child Growth – First 1000 Days and Beyond. Trends in Microbiology 27, 131–147 (2019). - PubMed
    1. Aversa Z et al. Association of Infant Antibiotic Exposure With Childhood Health Outcomes. Mayo Clinic Proceedings 96, 66–77 (2021). - PMC - PubMed
    1. Platts-Mills JA et al. Use of quantitative molecular diagnostic methods to assess the aetiology, burden, and clinical characteristics of diarrhoea in children in low-resource settings: a reanalysis of the MAL-ED cohort study. Lancet Glob Health 6, e1309–e1318 (2018). - PMC - PubMed
    1. Carding S, Verbeke K, Vipond DT, Corfe BM & Owen LJ Dysbiosis of the gut microbiota in disease. Microb Ecol Health Dis 26, (2015). - PMC - PubMed

Publication types