. 2022 May;3(5):629-648.
doi: 10.1038/s43018-022-00348-3. Epub 2022 Apr 14.

Loss of MAT2A compromises methionine metabolism and represents a vulnerability in H3K27M mutant glioma by modulating the epigenome

Affiliations

Loss of MAT2A compromises methionine metabolism and represents a vulnerability in H3K27M mutant glioma by modulating the epigenome

Brian J Golbourn et al. Nat Cancer. 2022 May.

Erratum in

  • Author Correction: Loss of MAT2A compromises methionine metabolism and represents a vulnerability in H3K27M mutant glioma by modulating the epigenome.
    Golbourn BJ, Halbert ME, Halligan K, Varadharajan S, Krug B, Mbah NE, Kabir N, Stanton AJ, Locke AL, Casillo SM, Zhao Y, Sanders LM, Cheney A, Mullett SJ, Chen A, Wassell M, Andren A, Perez J, Jane EP, Premkumar DRD, Koncar RF, Mirhadi S, McCarl LH, Chang YF, Wu YL, Gatesman TA, Cruz AF, Zapotocky M, Hu B, Kohanbash G, Wang X, Vartanian A, Moran MF, Lieberman F, Amankulor NM, Wendell SG, Vaske OM, Panigrahy A, Felker J, Bertrand KC, Kleinman CL, Rich JN, Friedlander RM, Broniscer A, Lyssiotis C, Jabado N, Pollack IF, Mack SC, Agnihotri S. Golbourn BJ, et al. Nat Cancer. 2022 Jul;3(7):899. doi: 10.1038/s43018-022-00407-9. Nat Cancer. 2022. PMID: 35739422 No abstract available.

Abstract

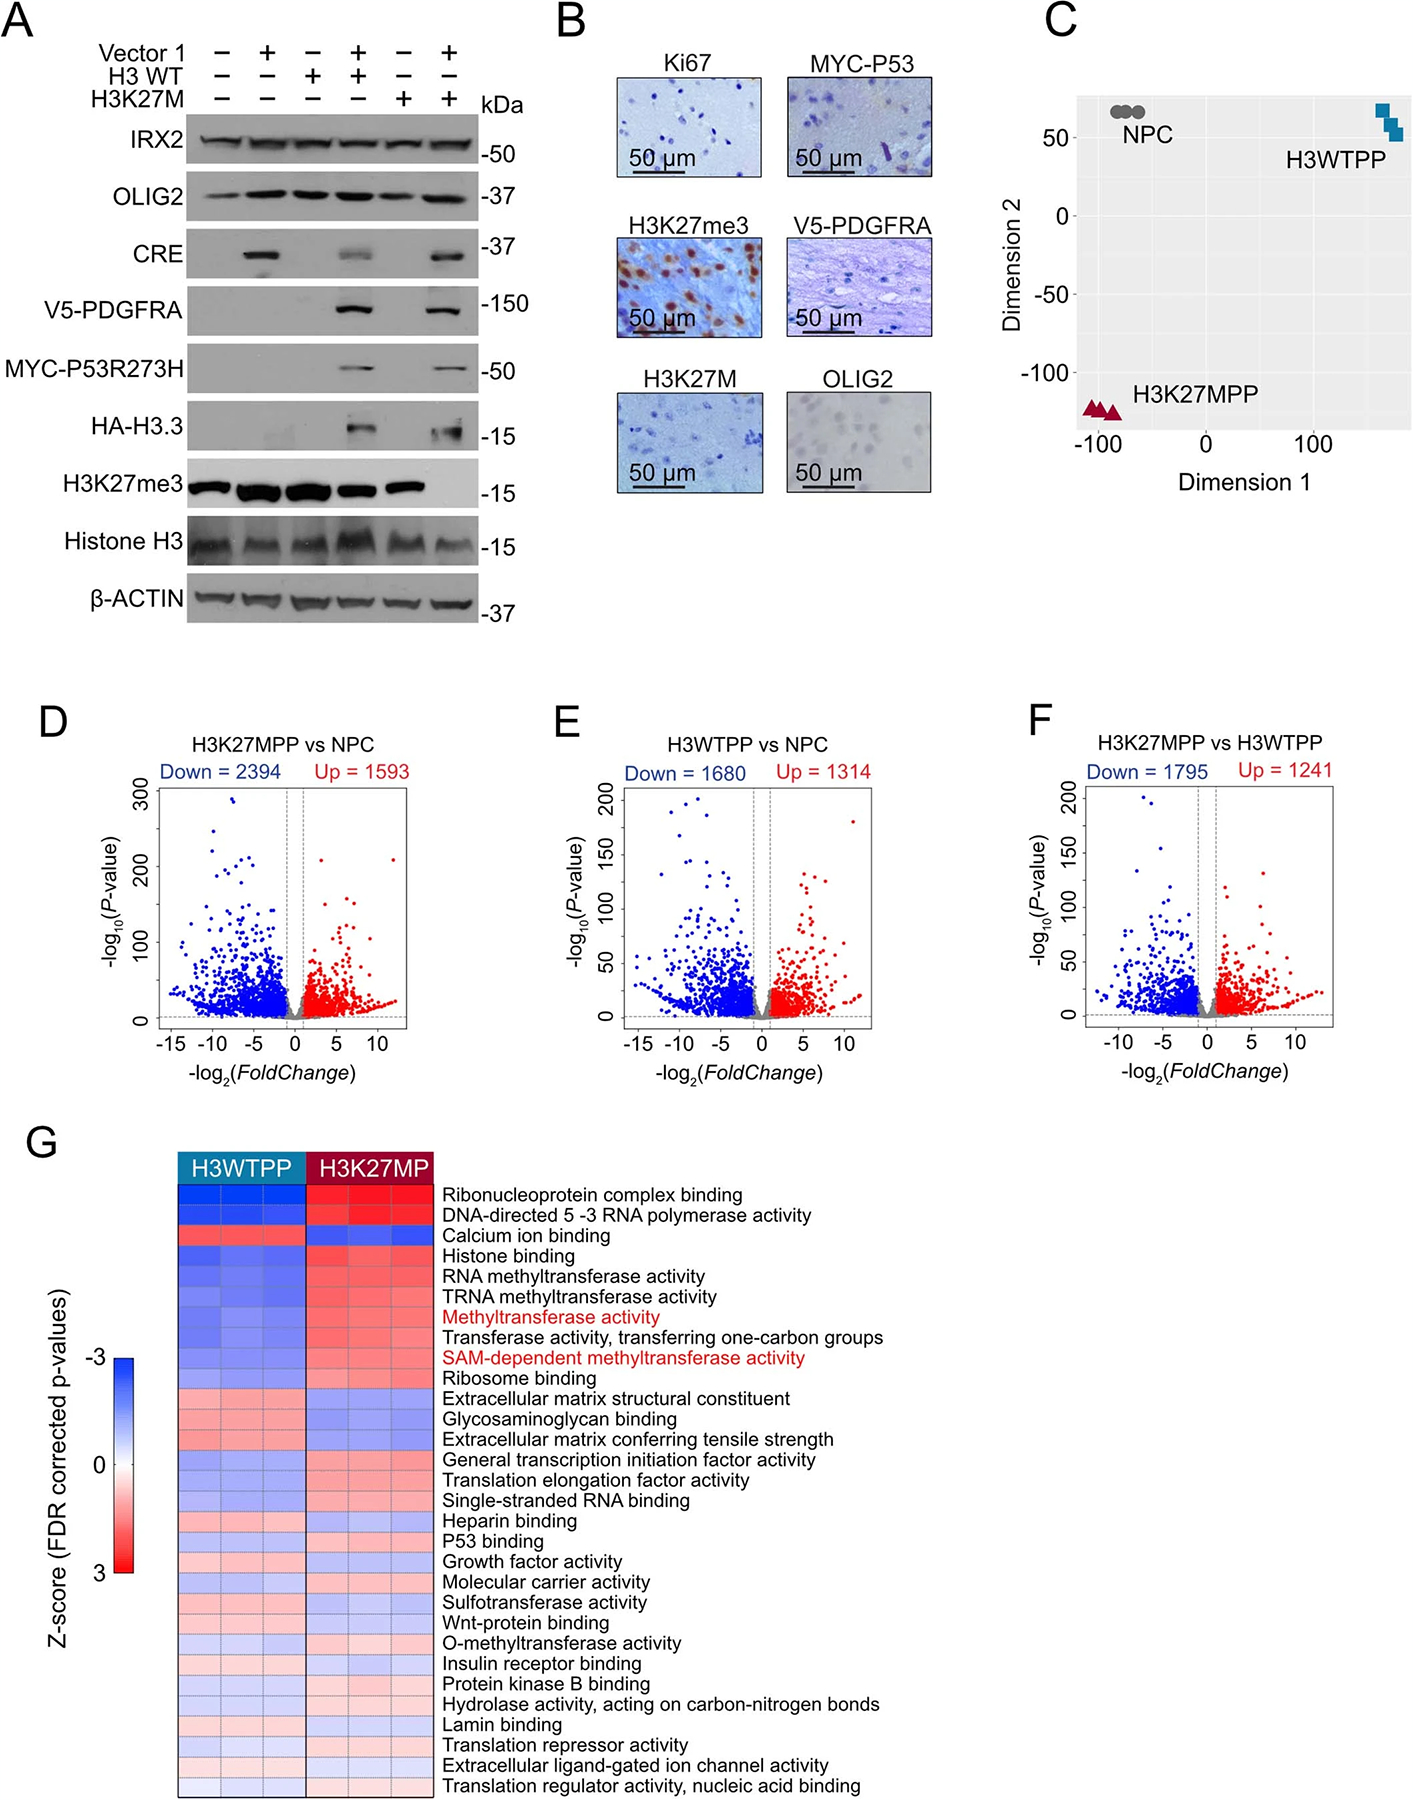
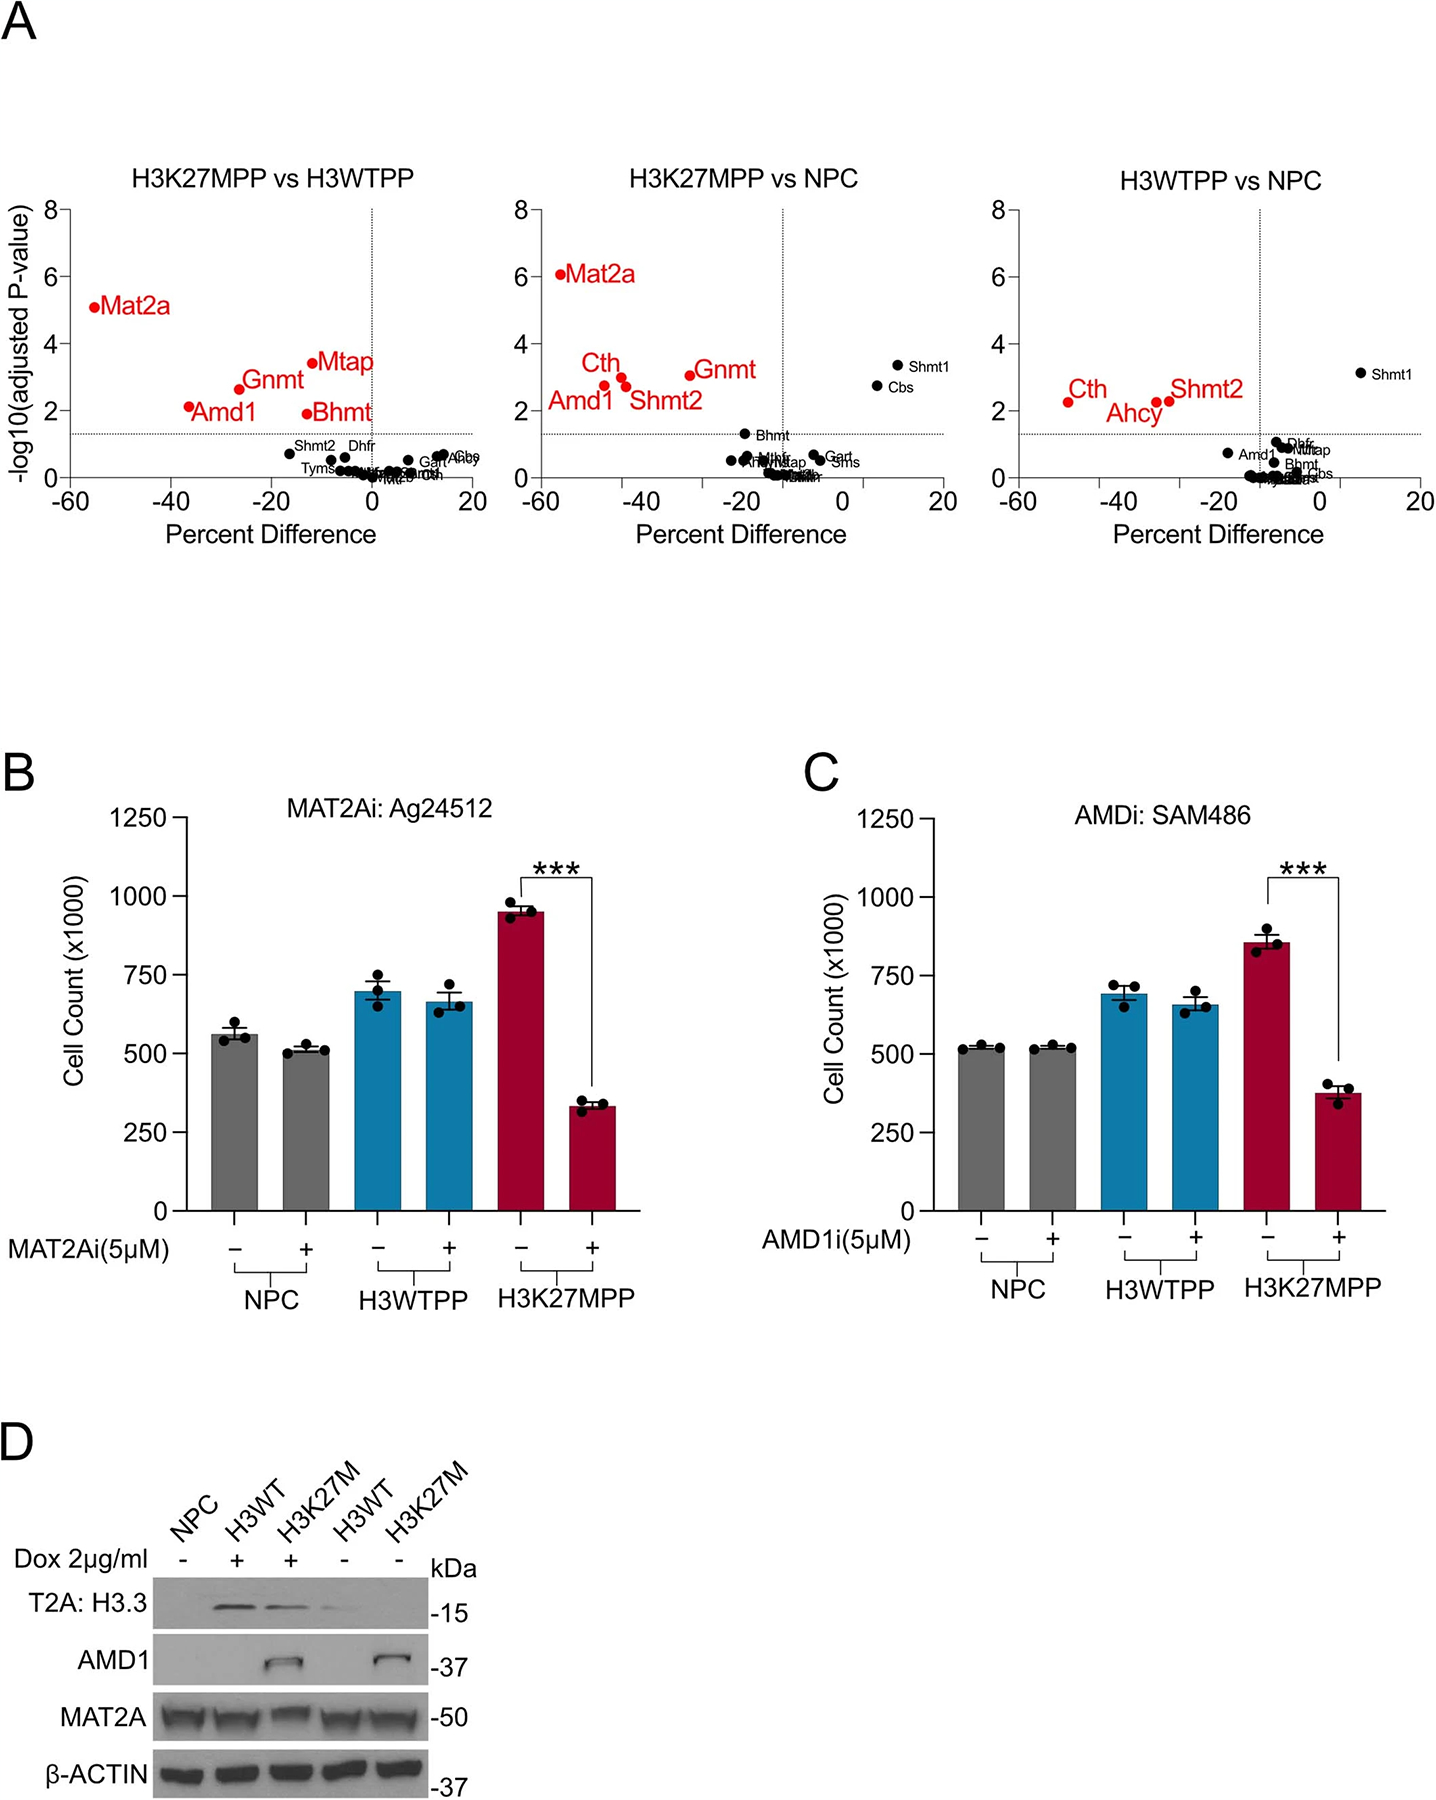
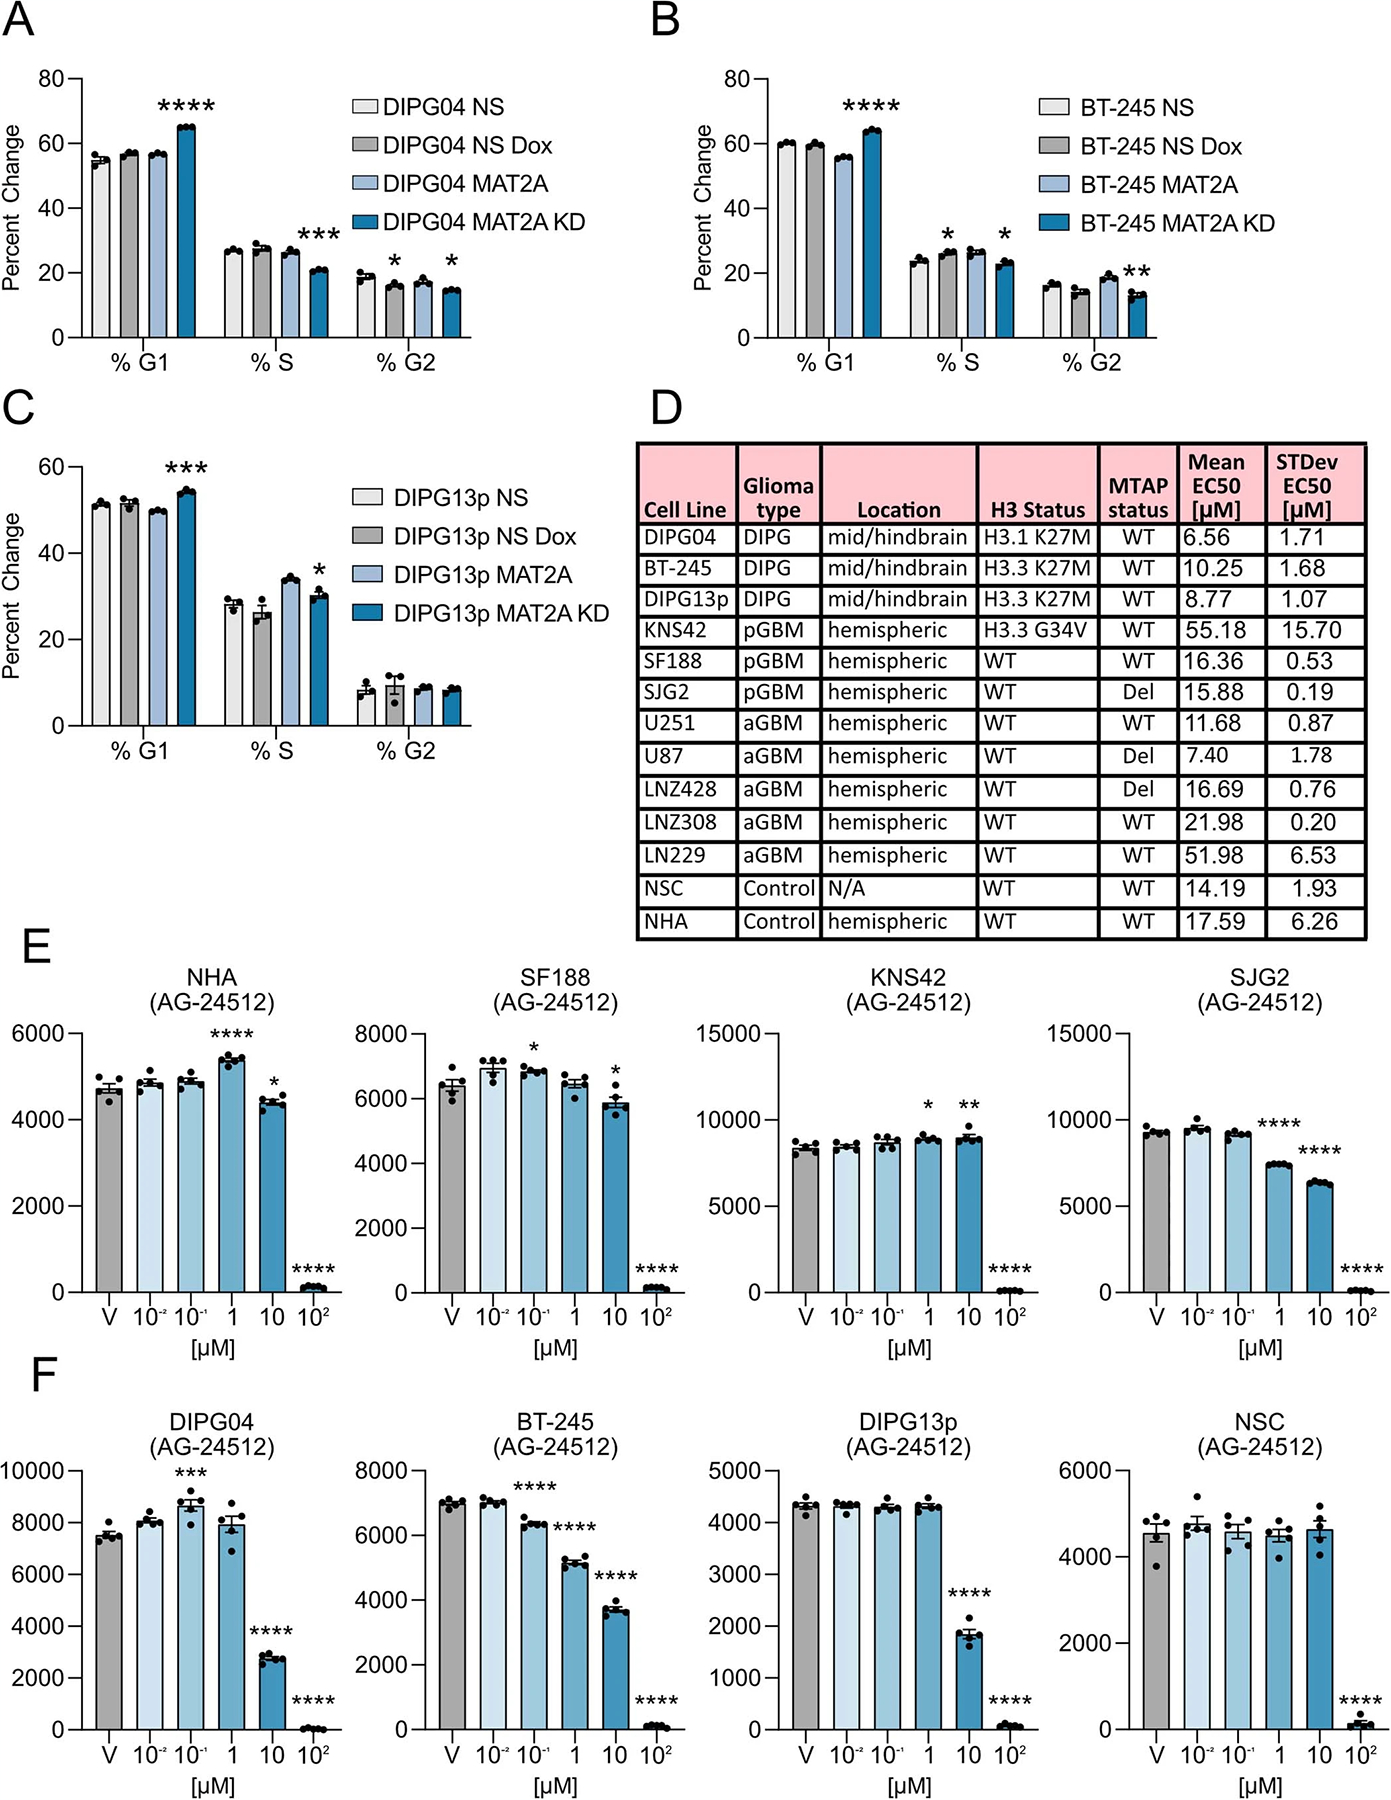
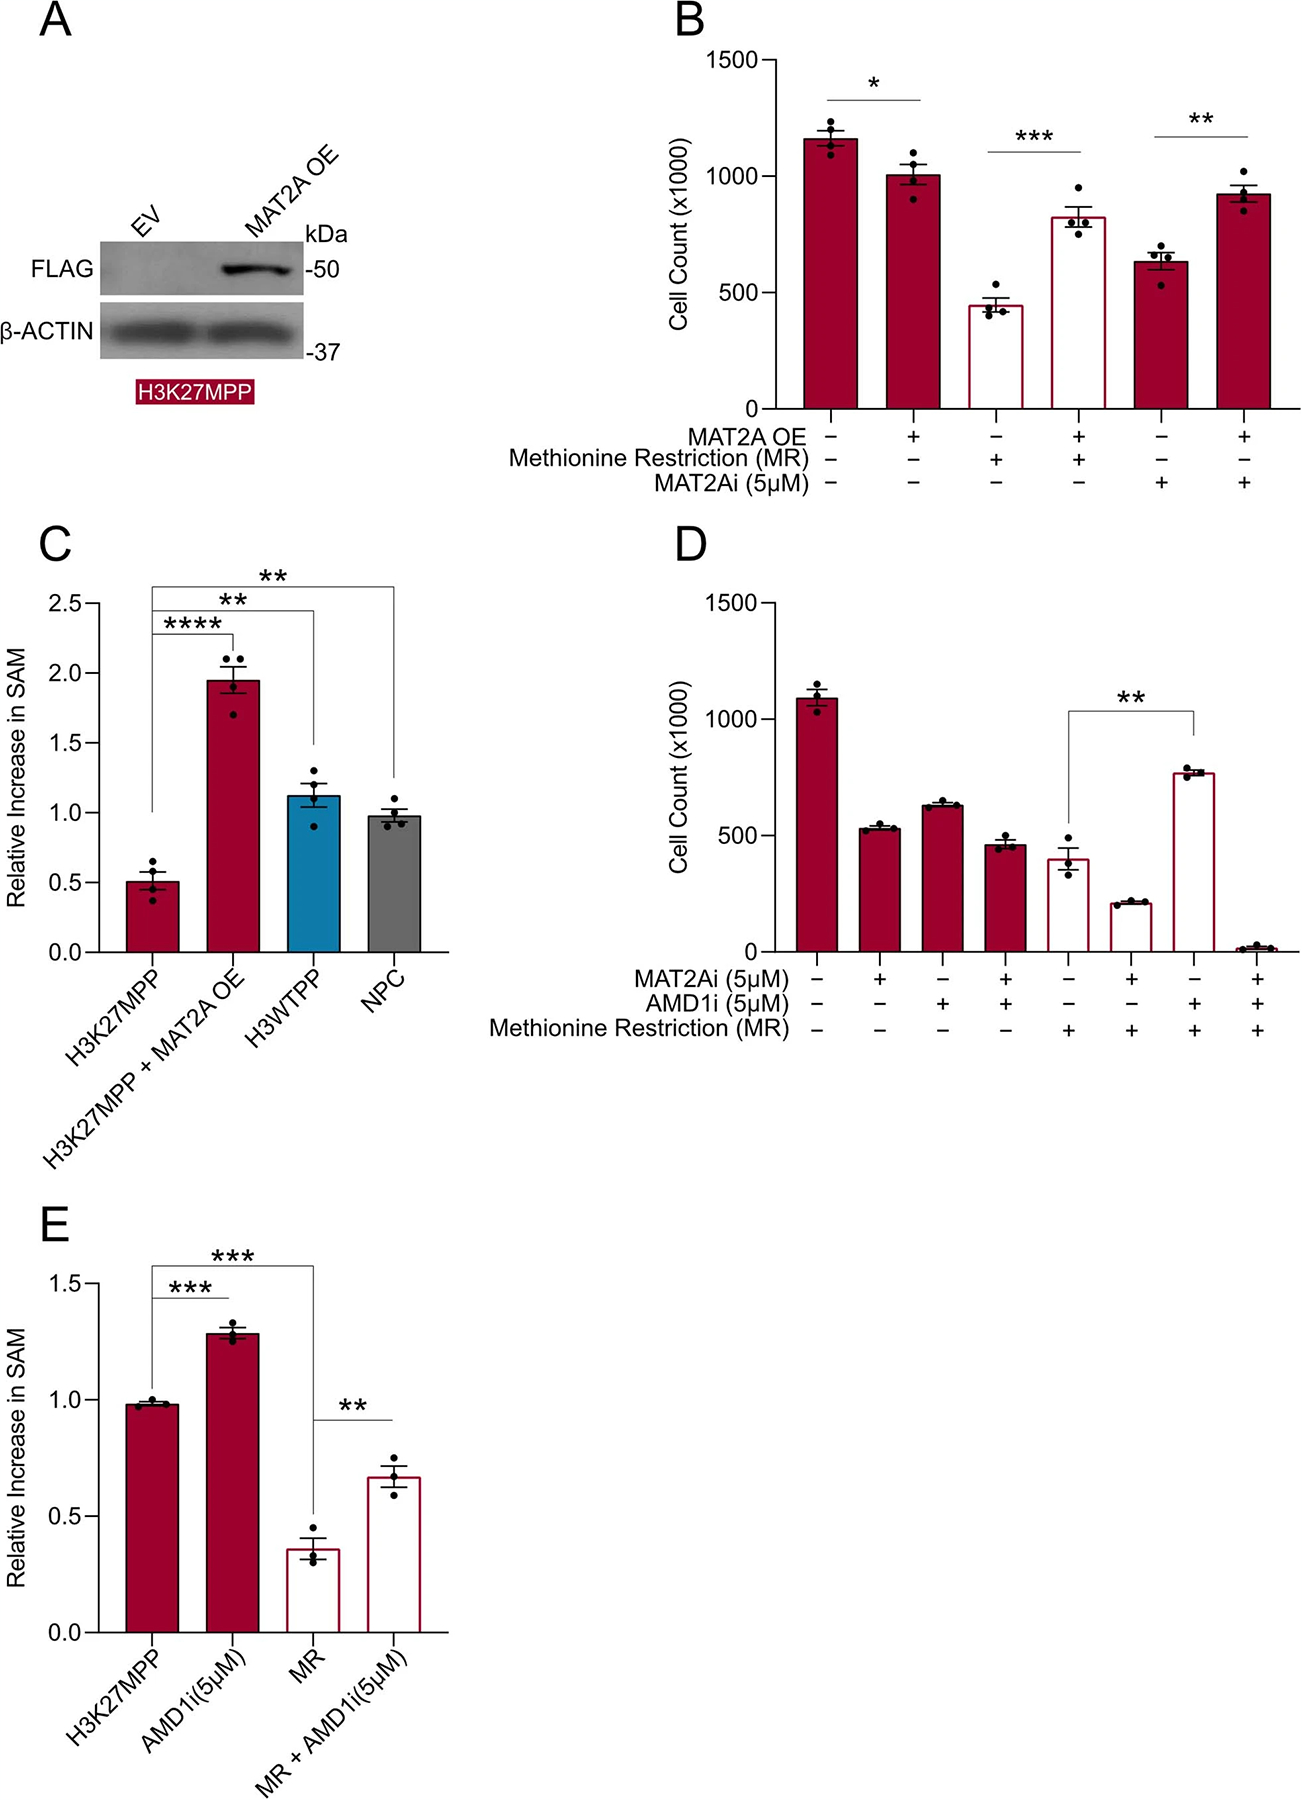
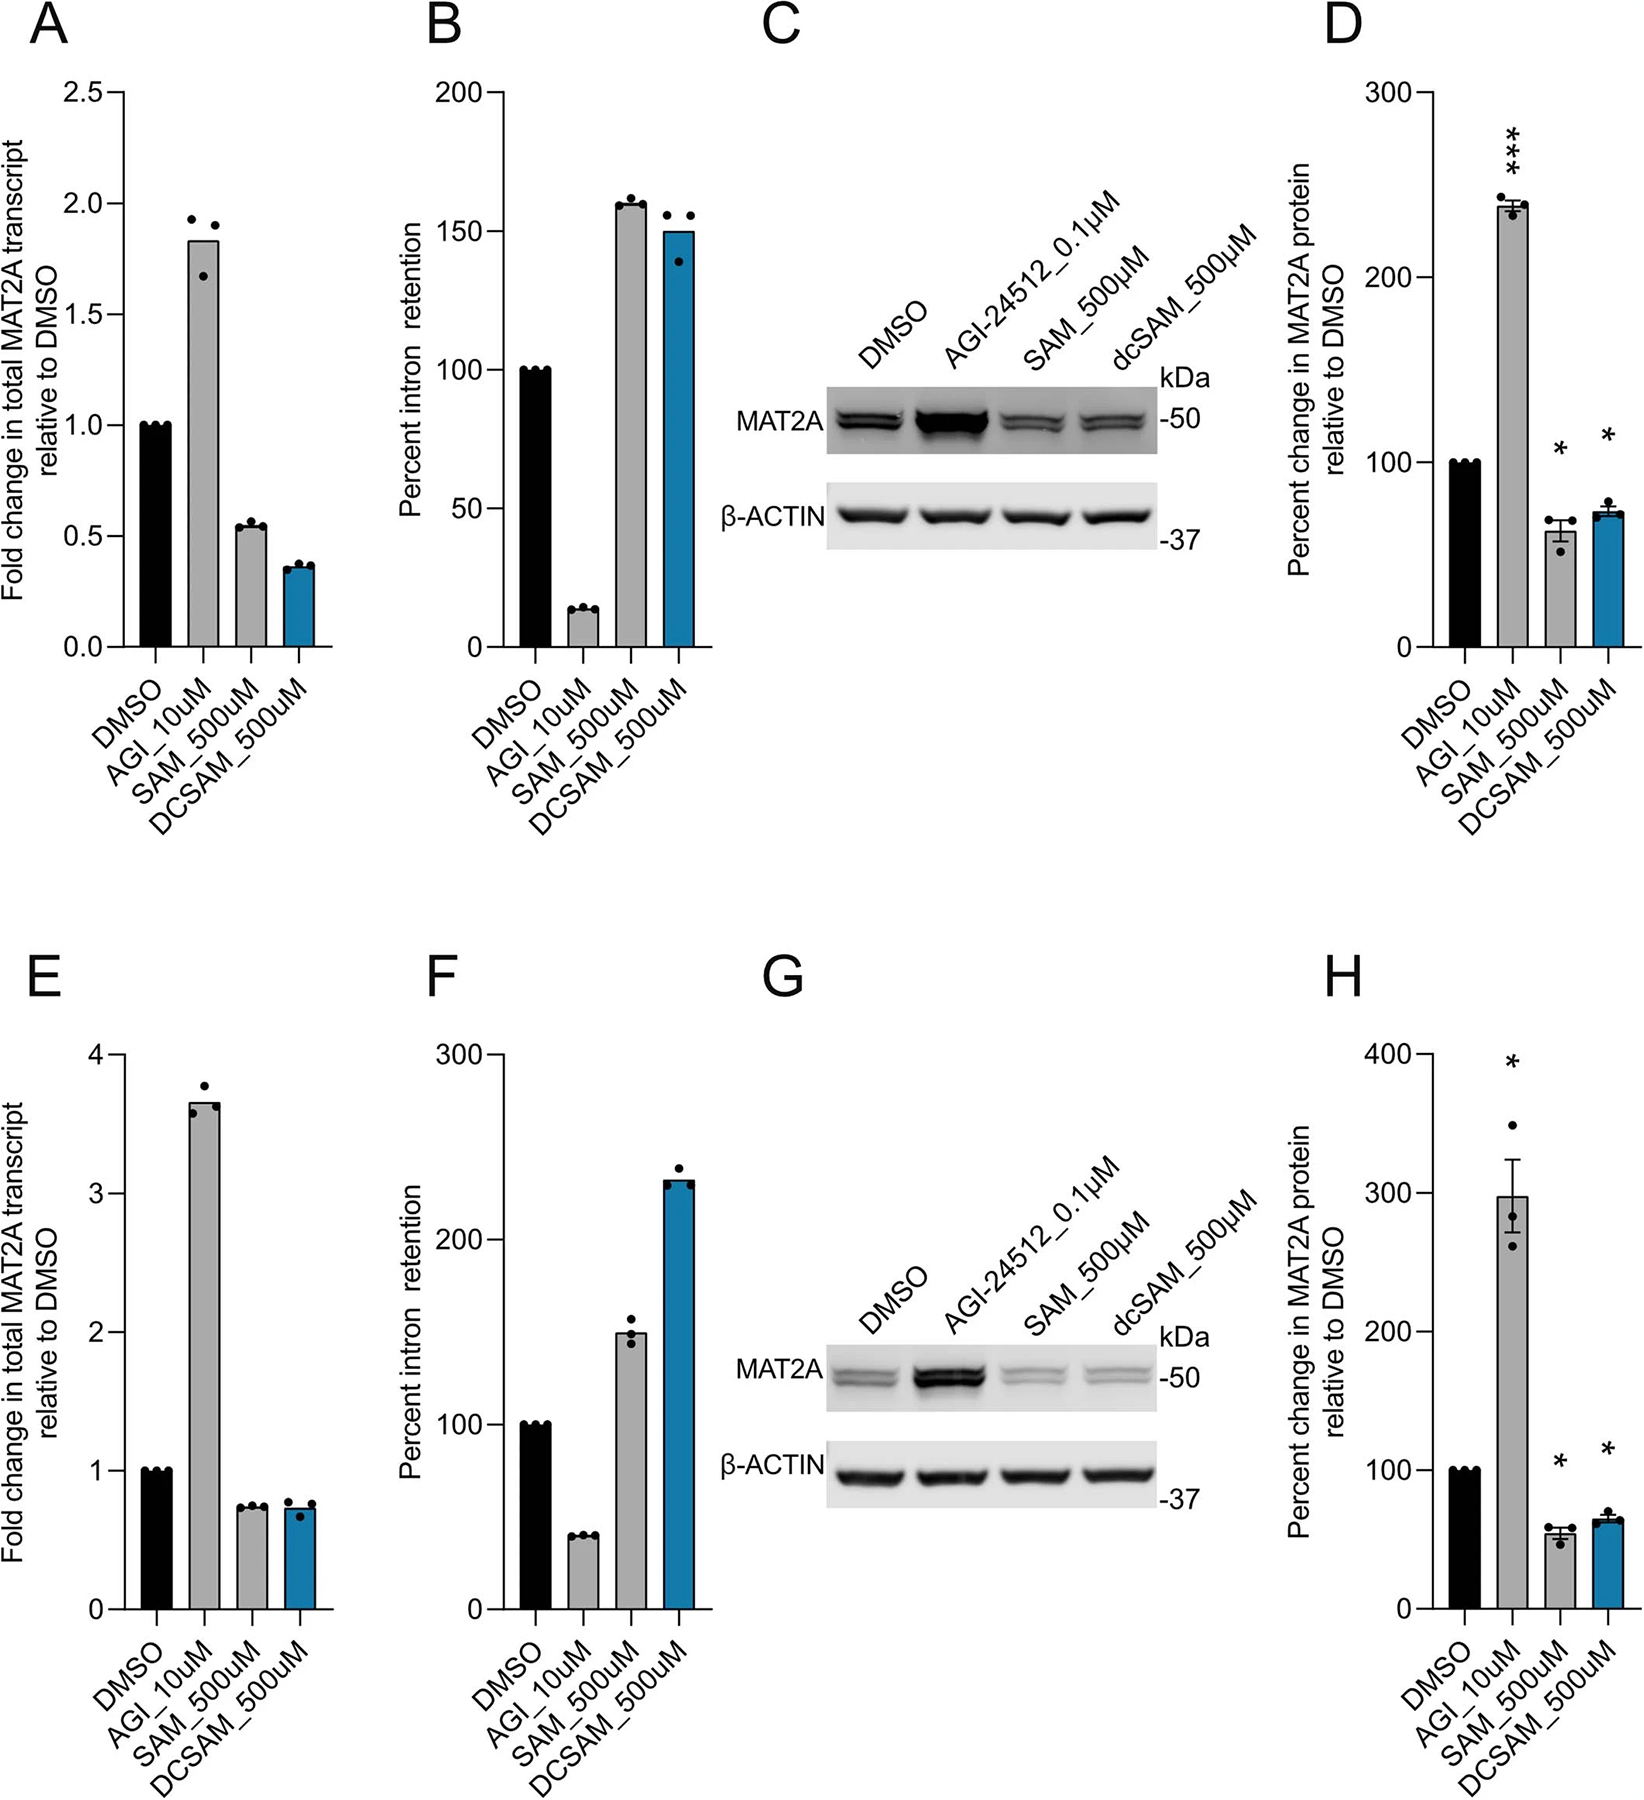
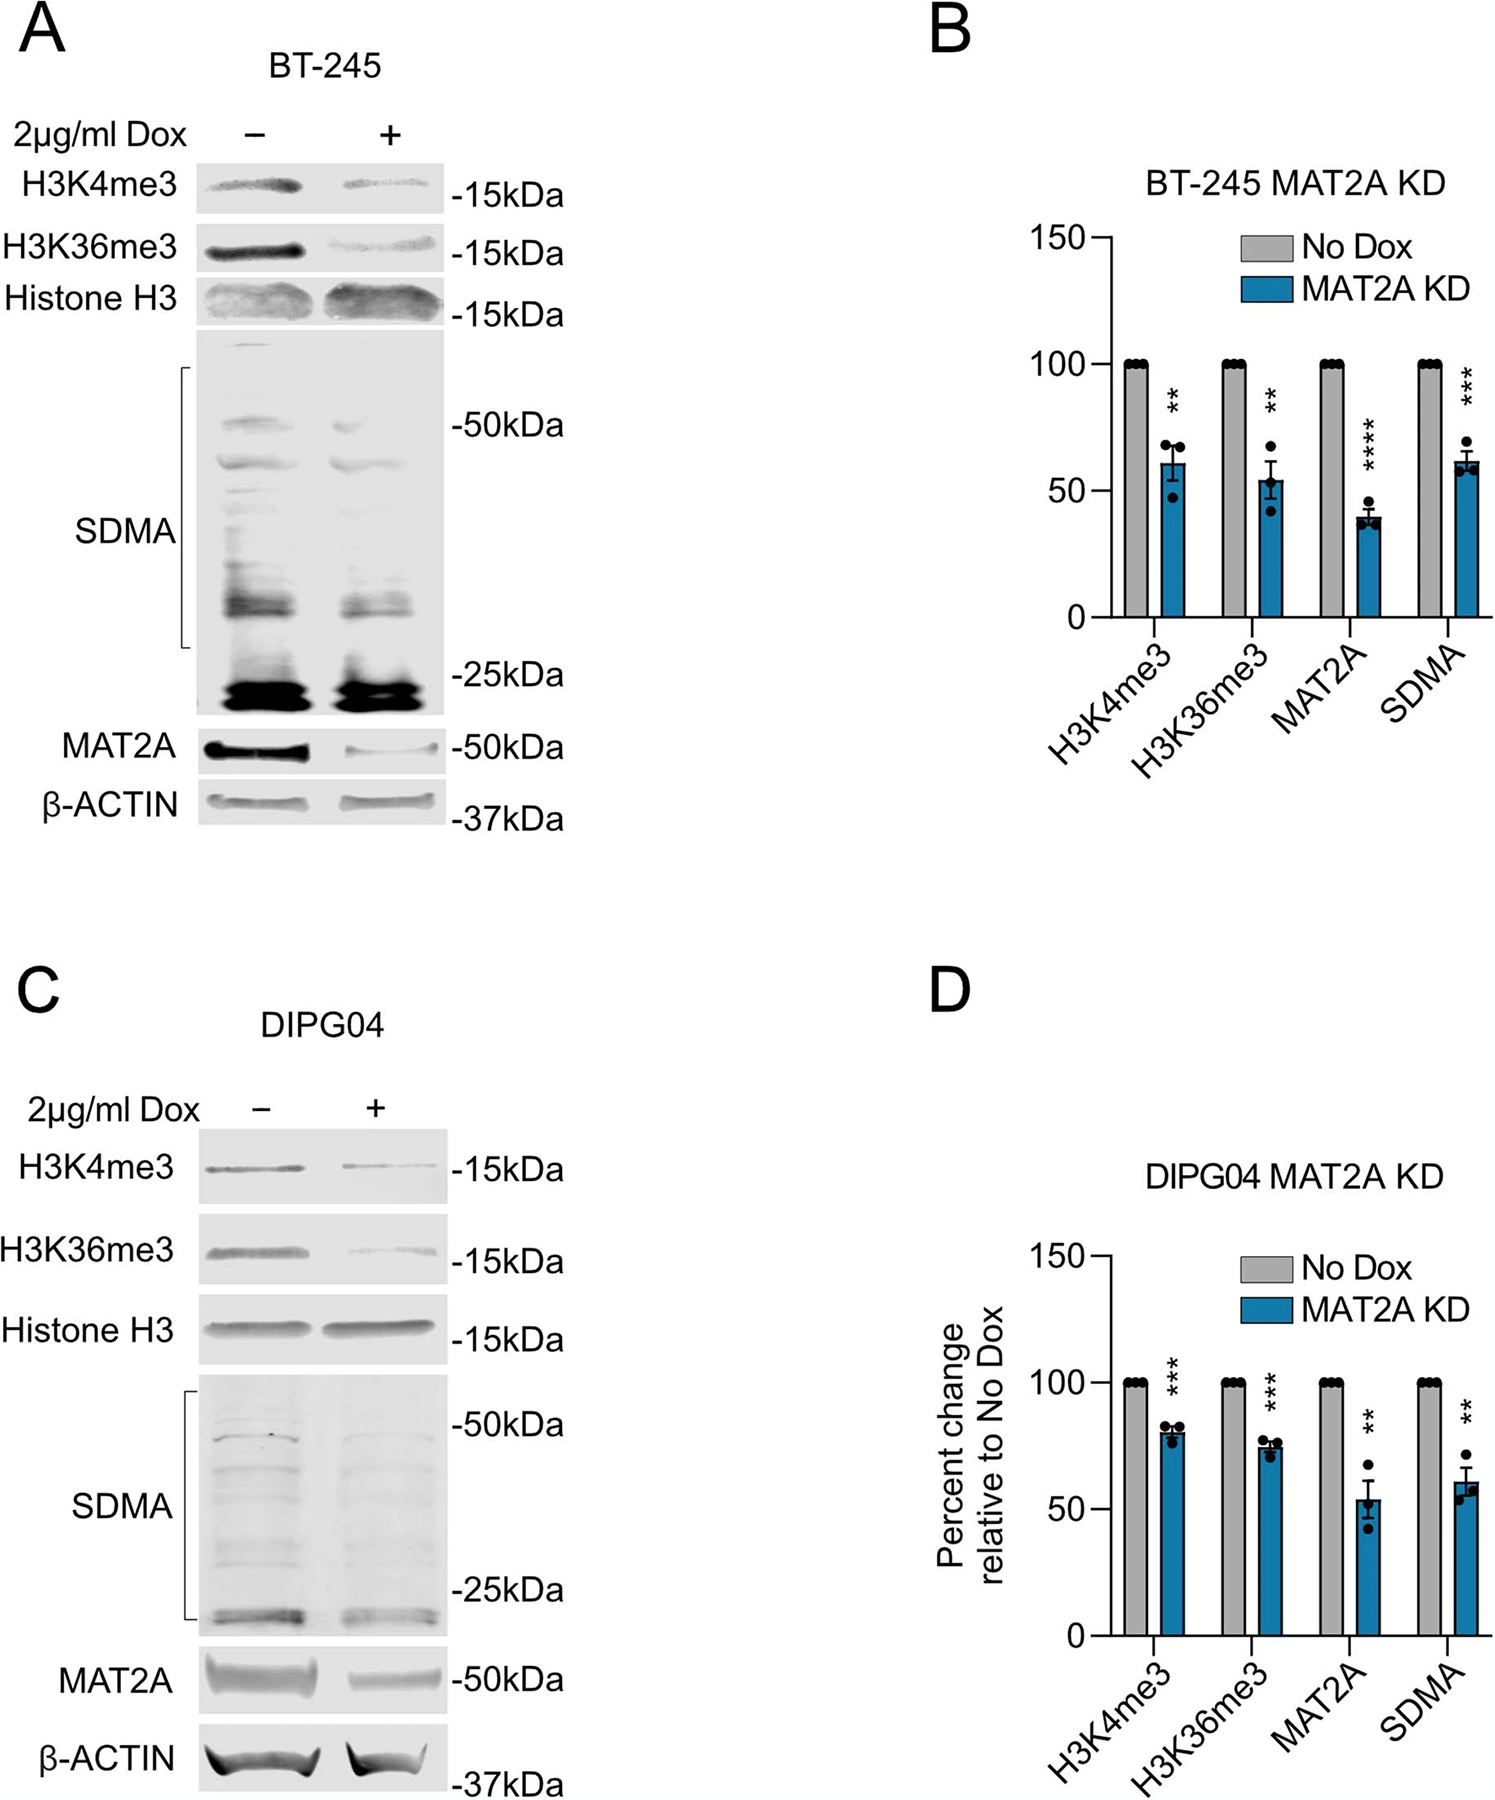
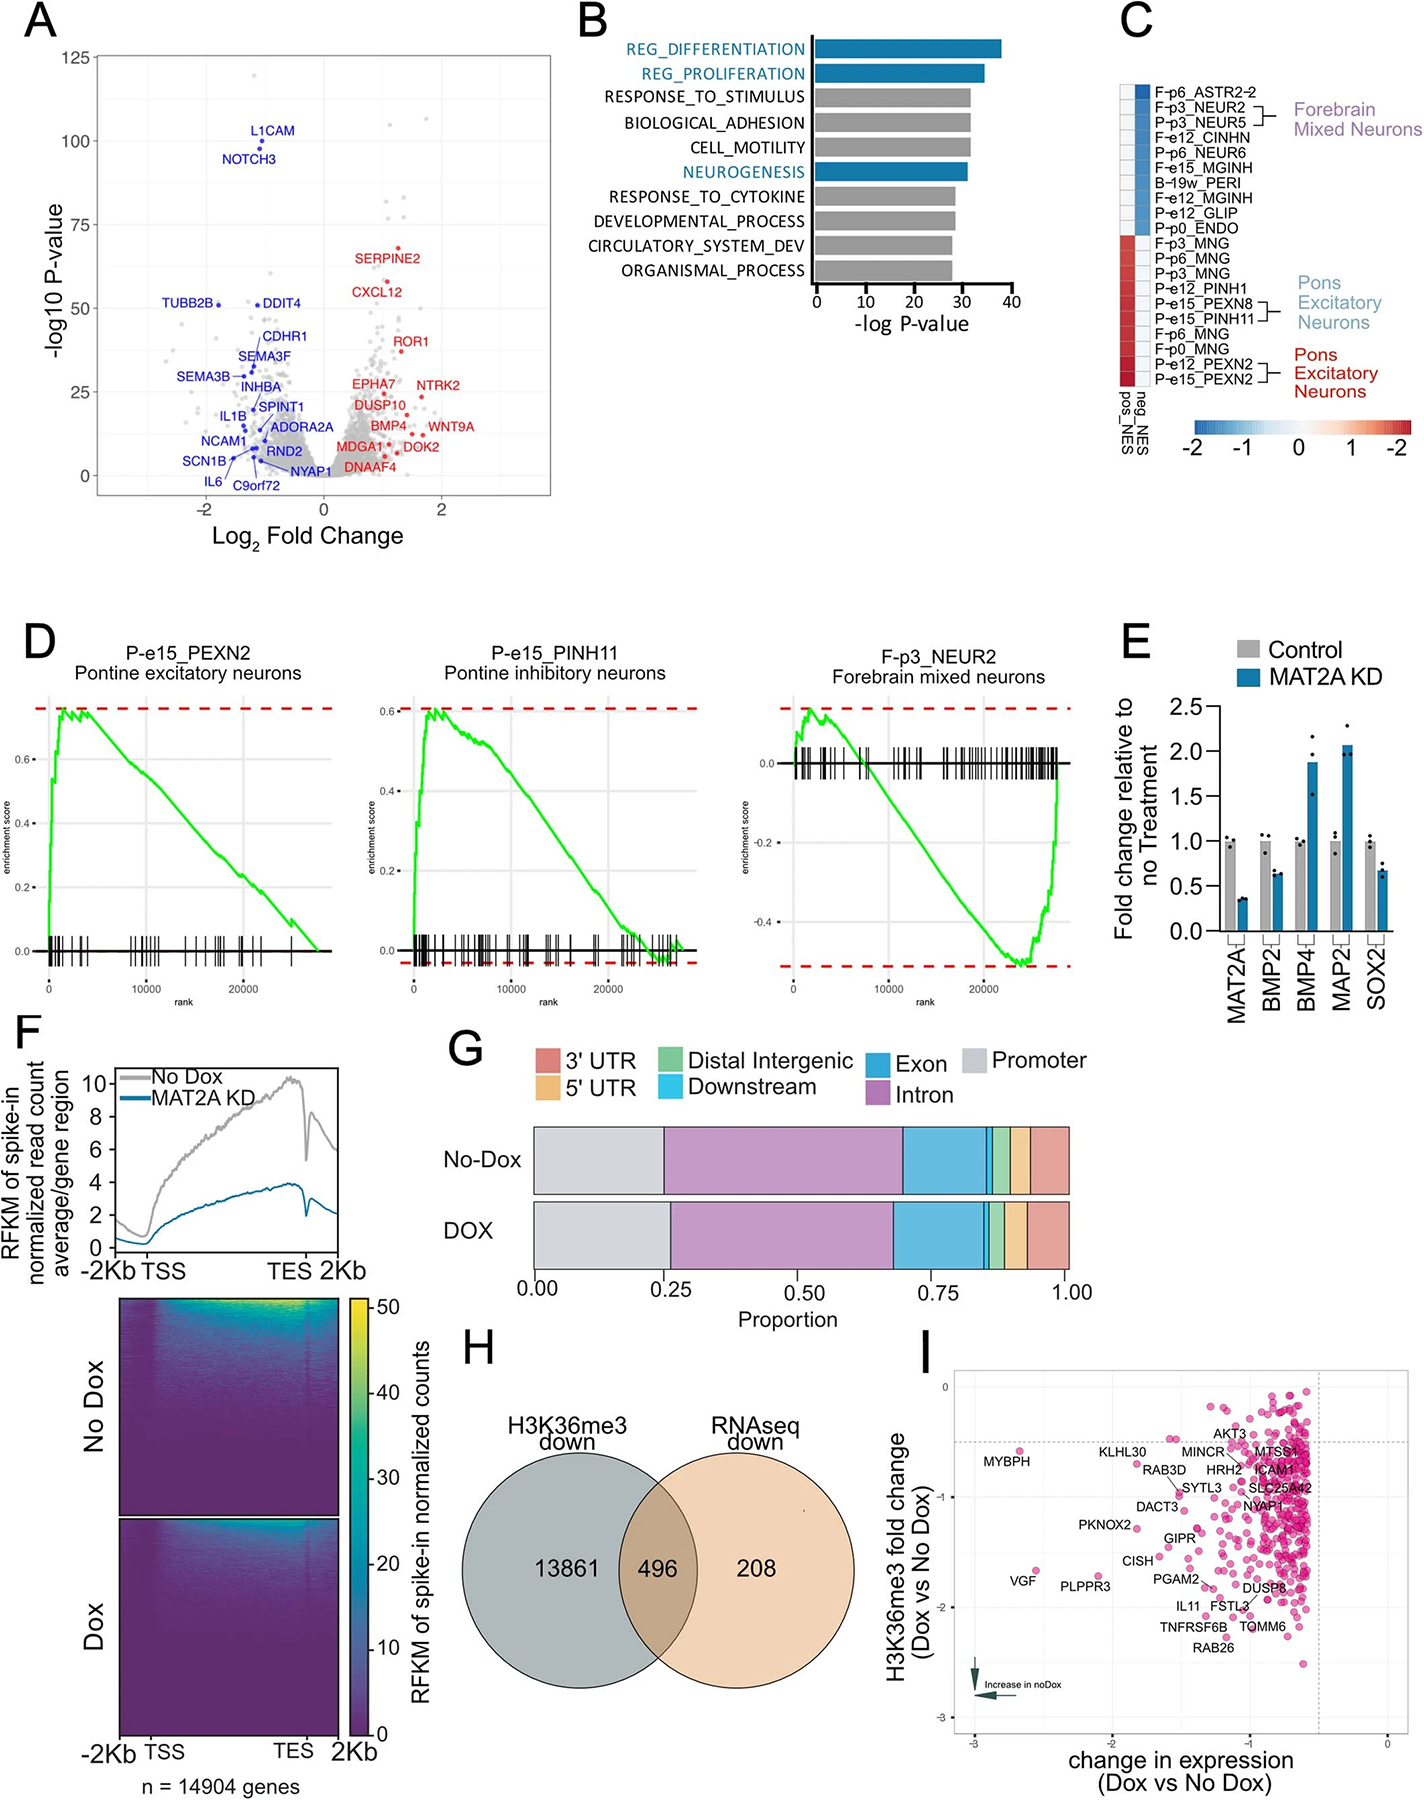
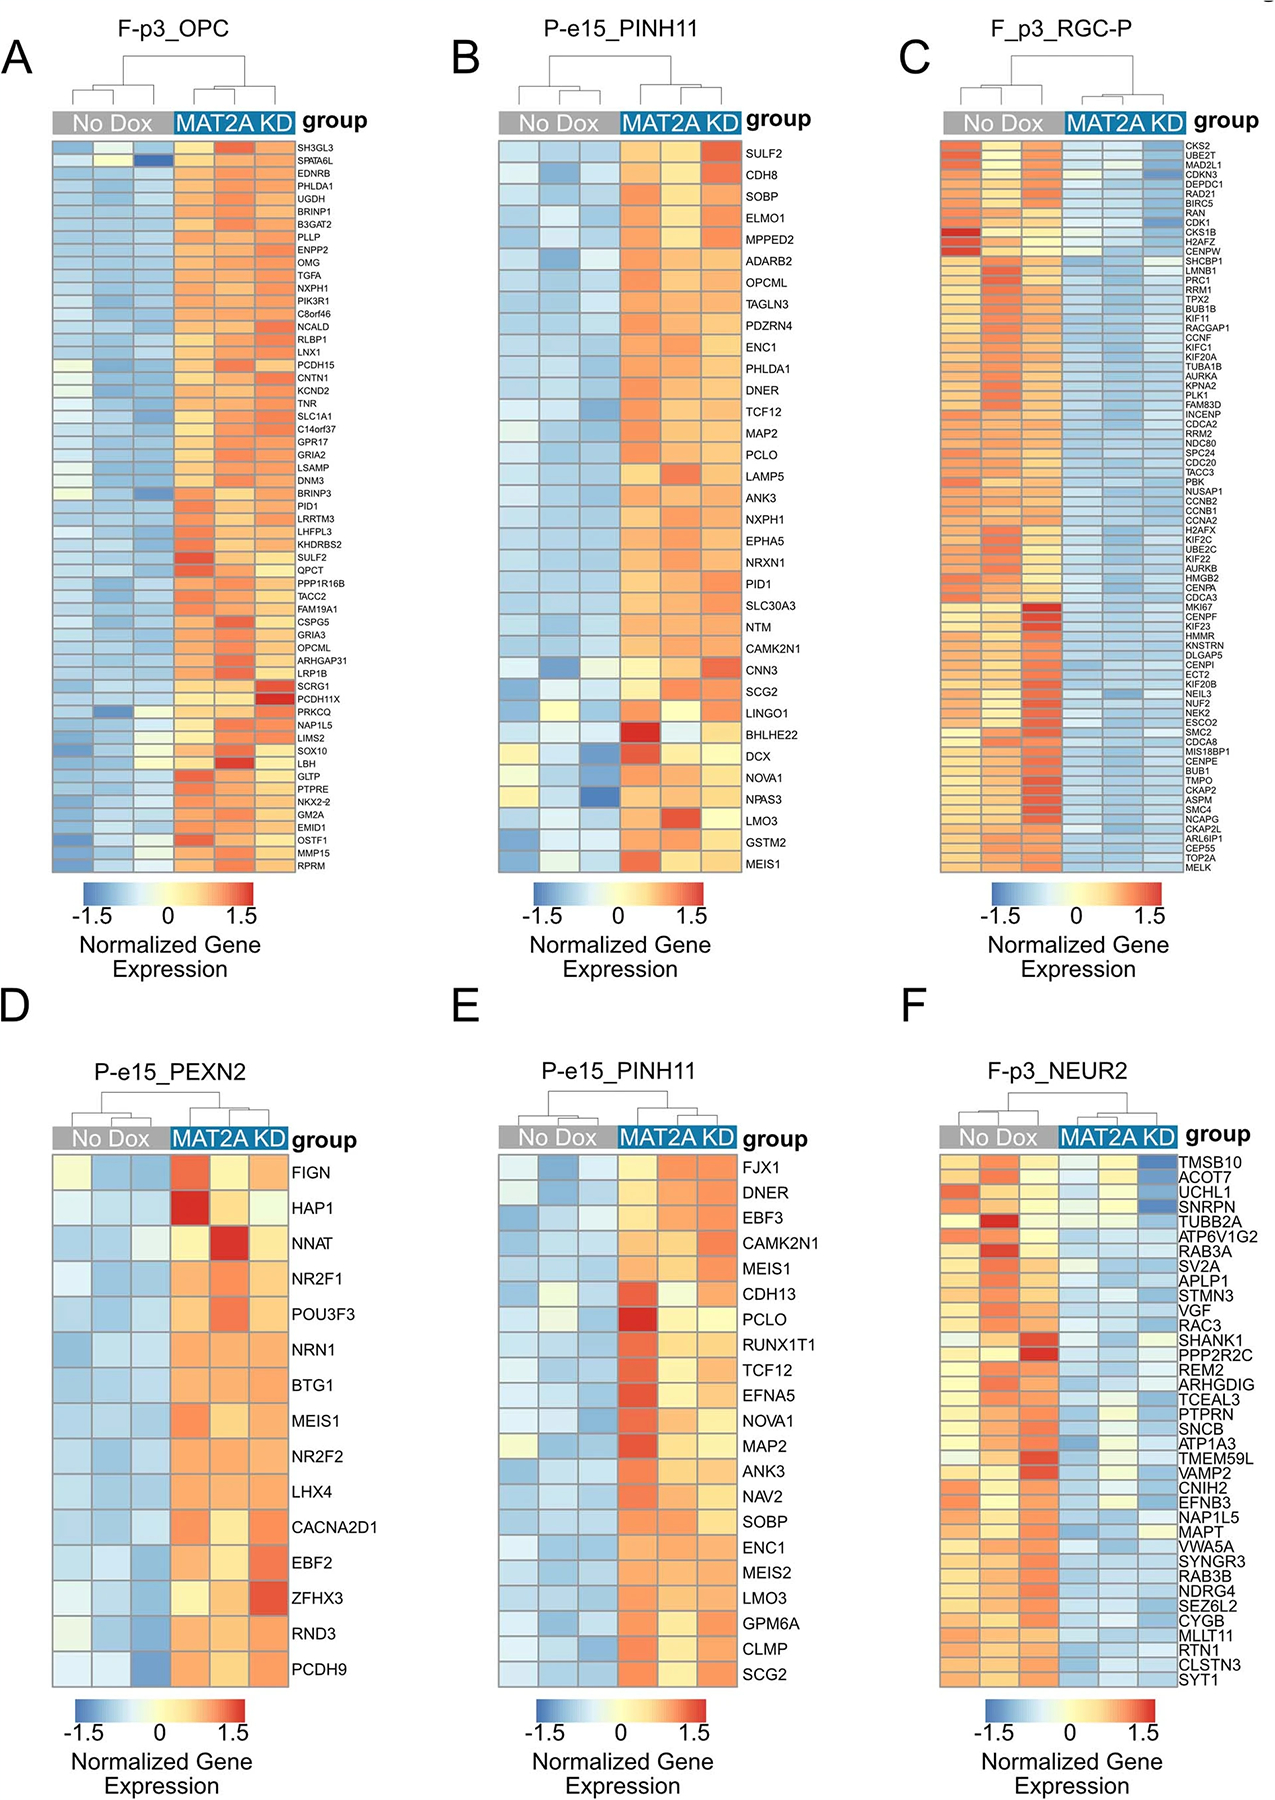
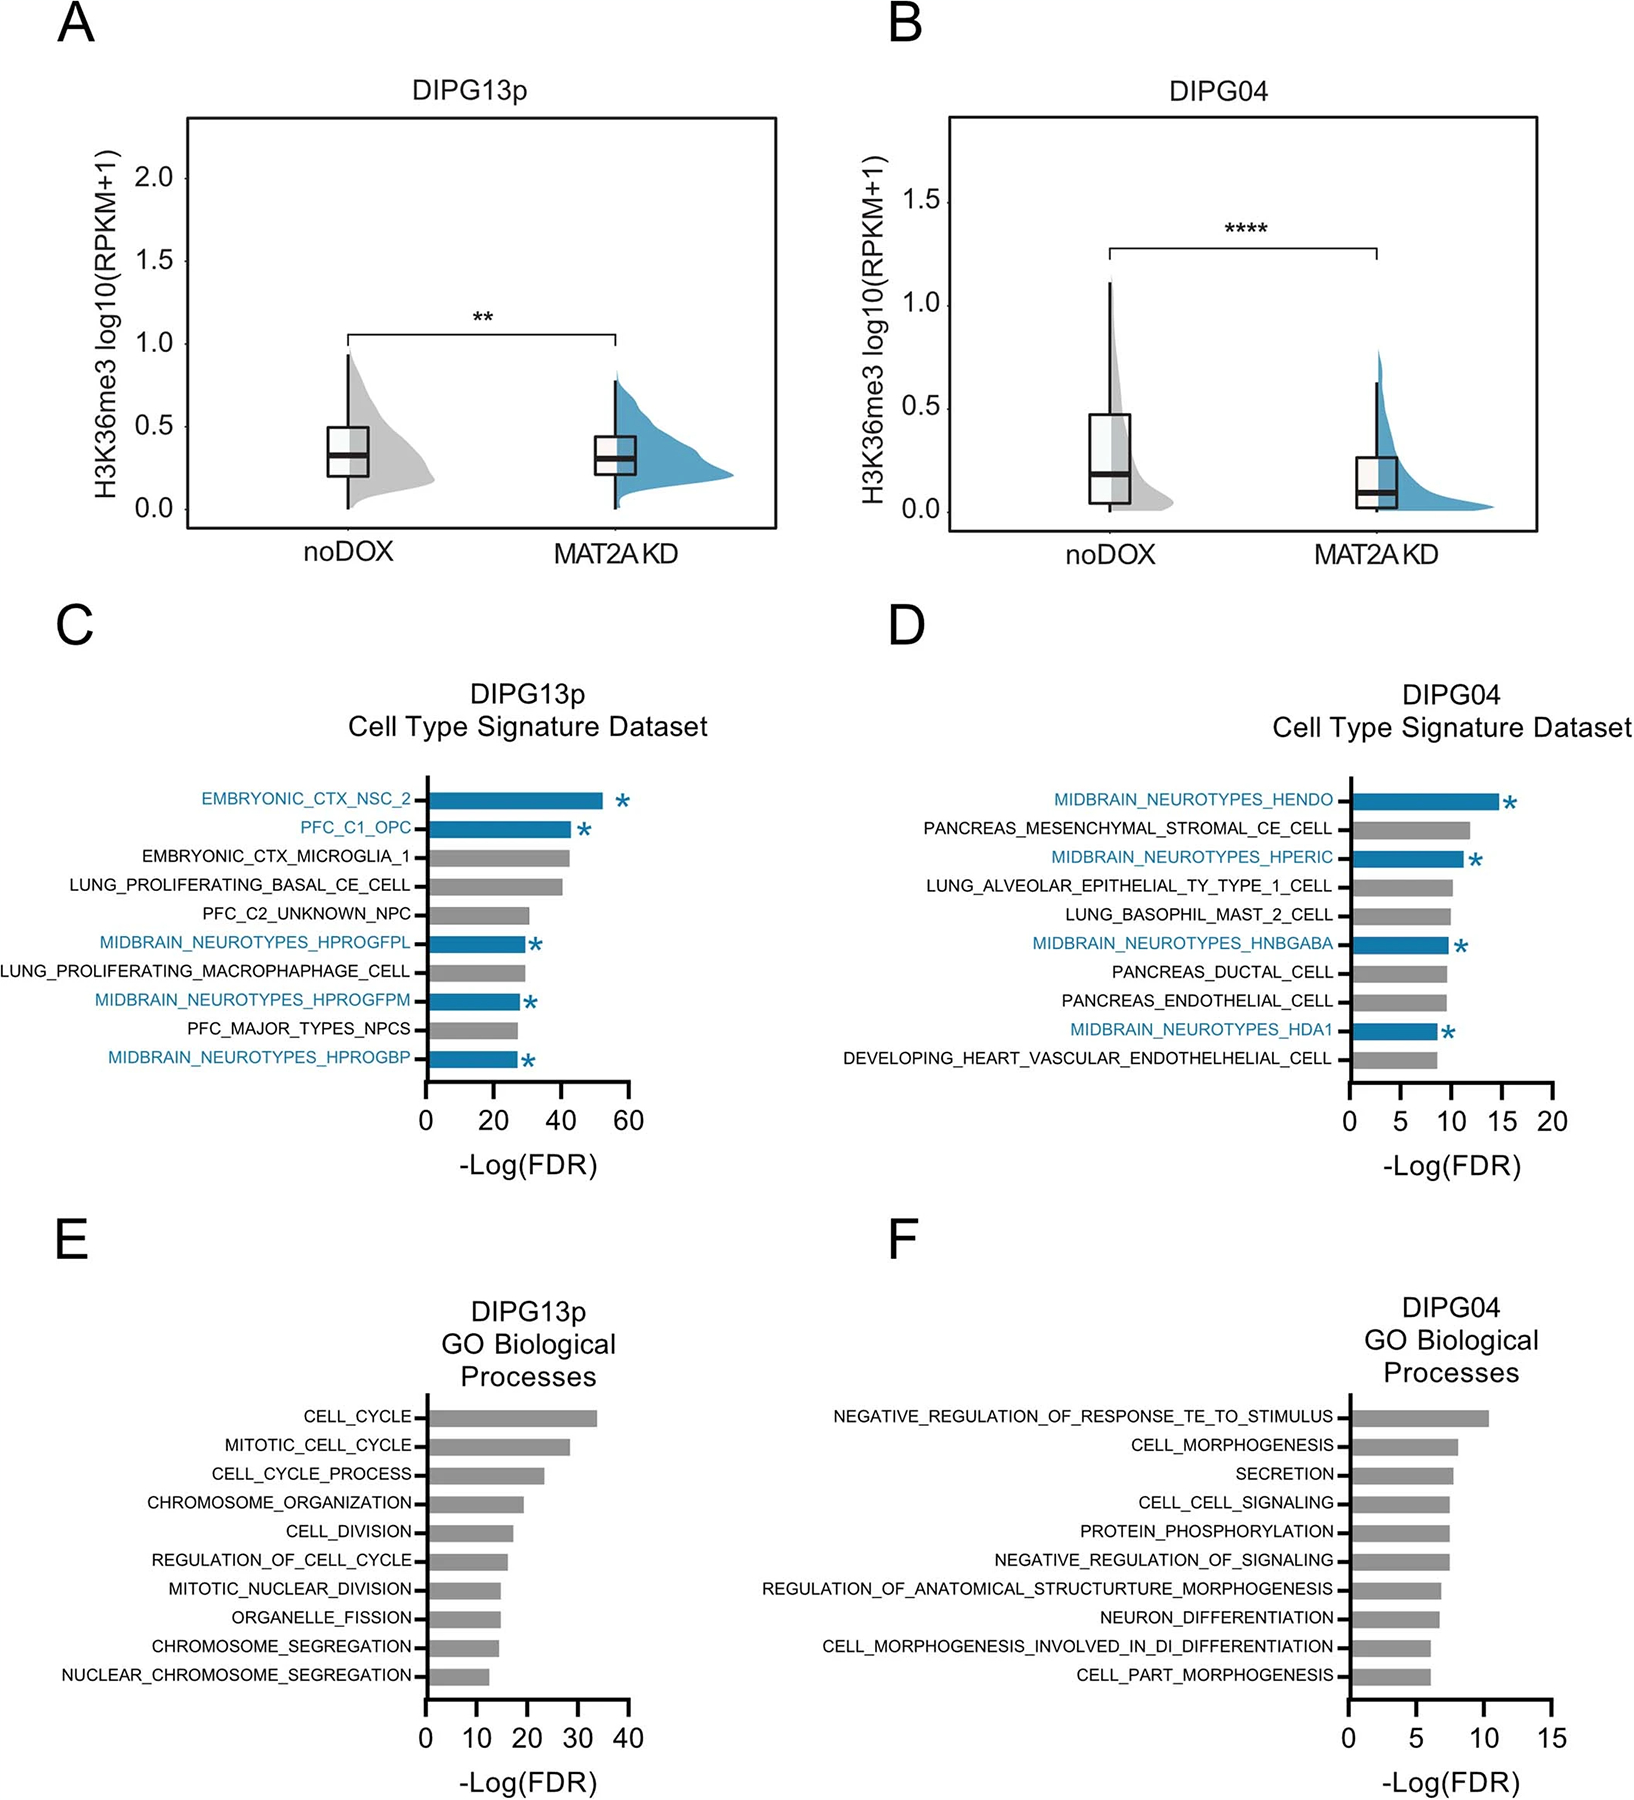
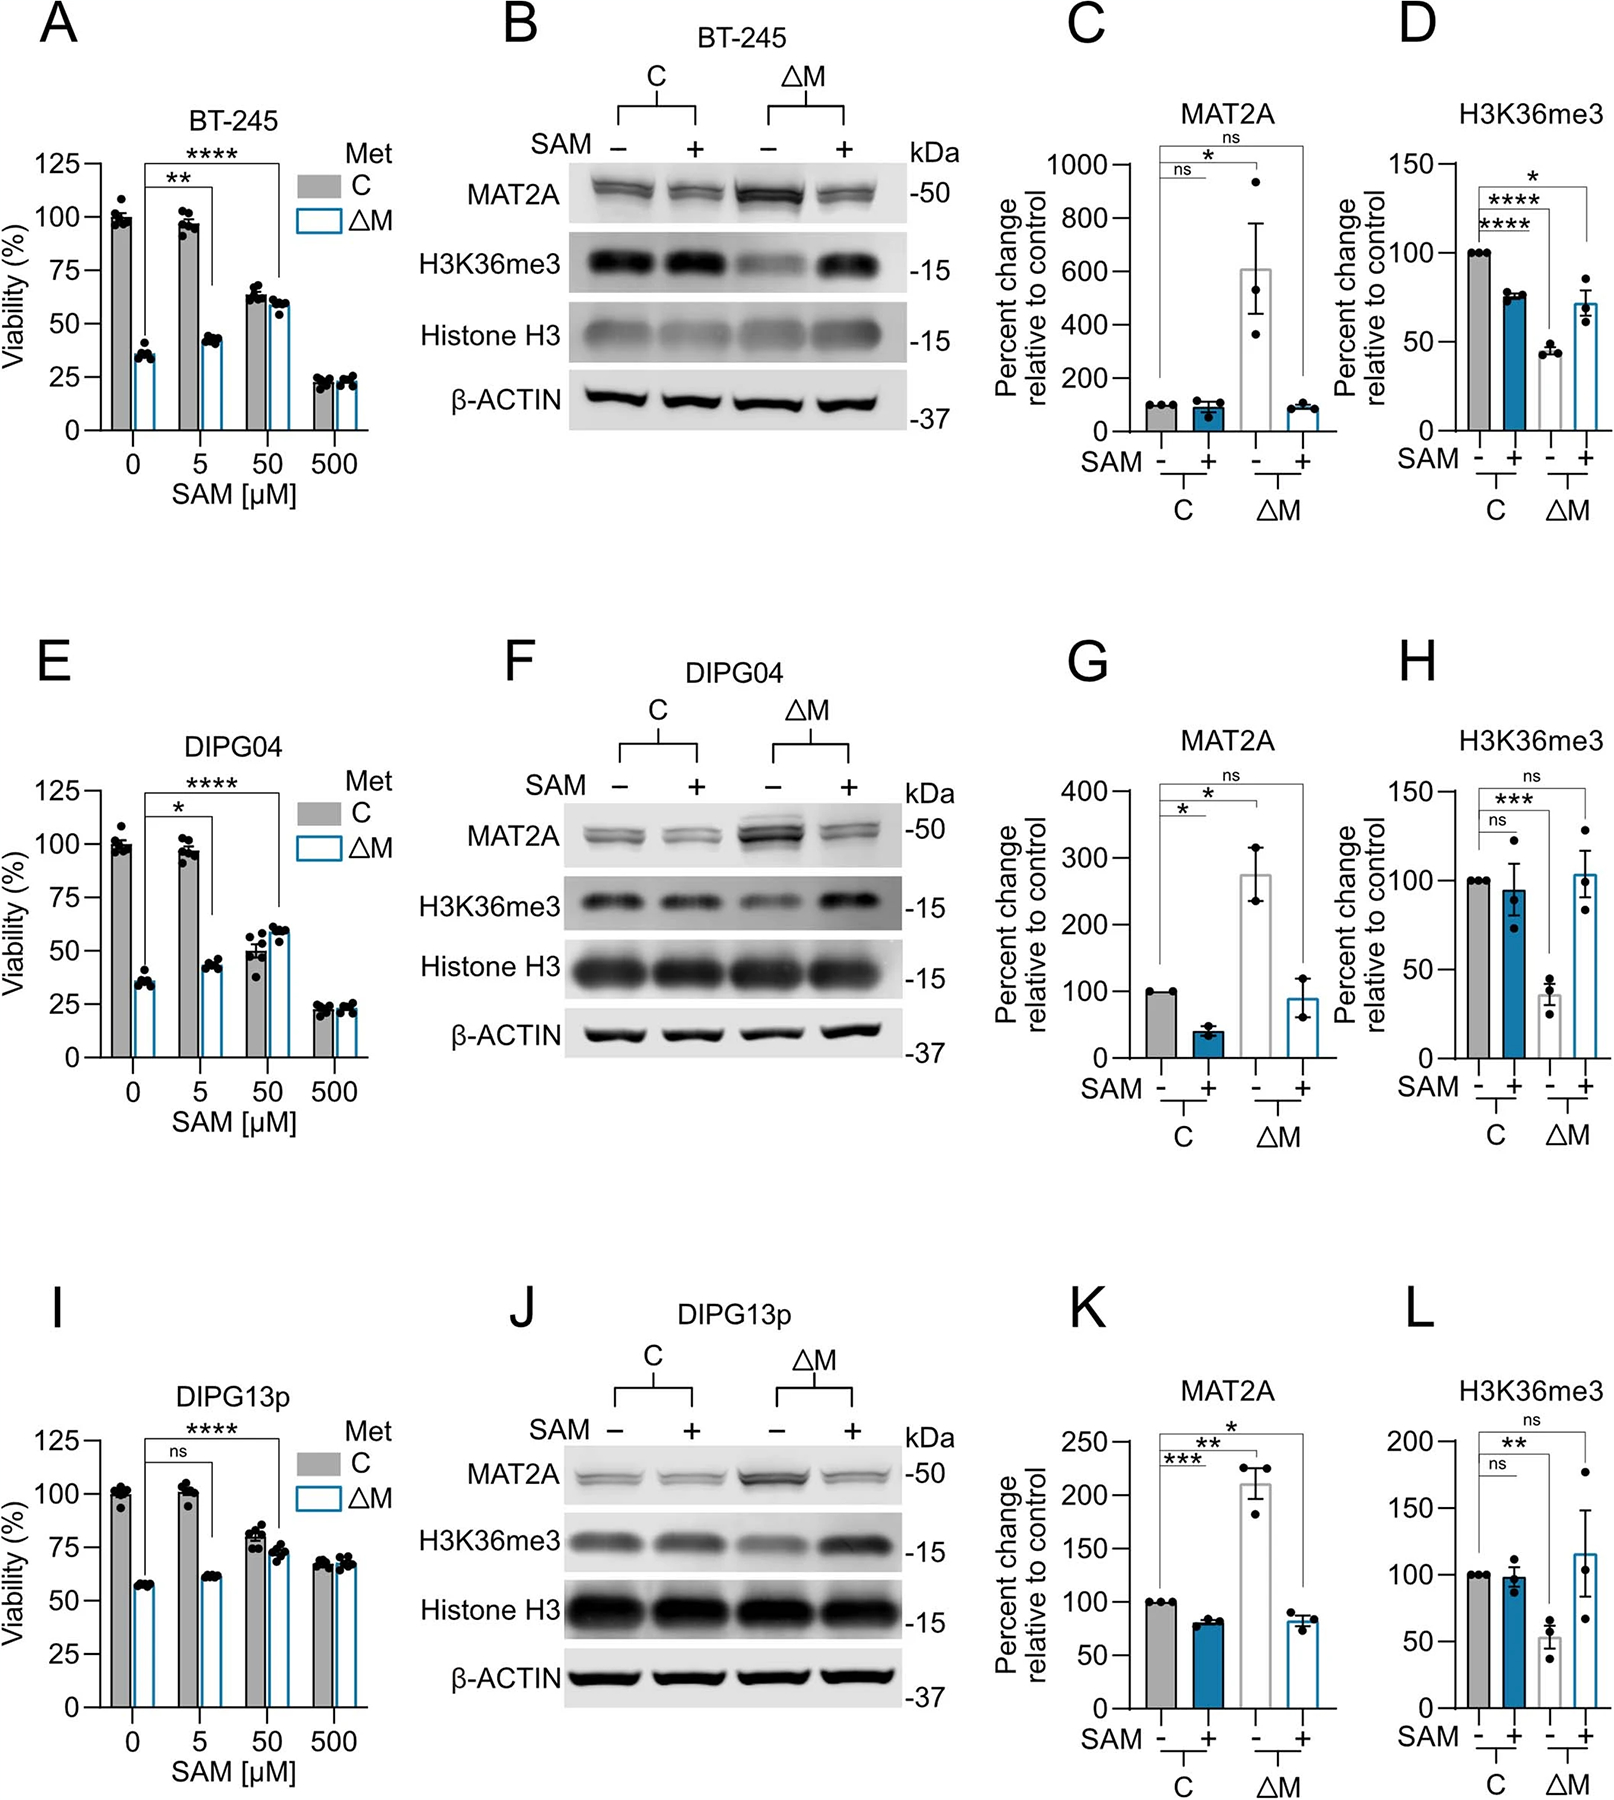
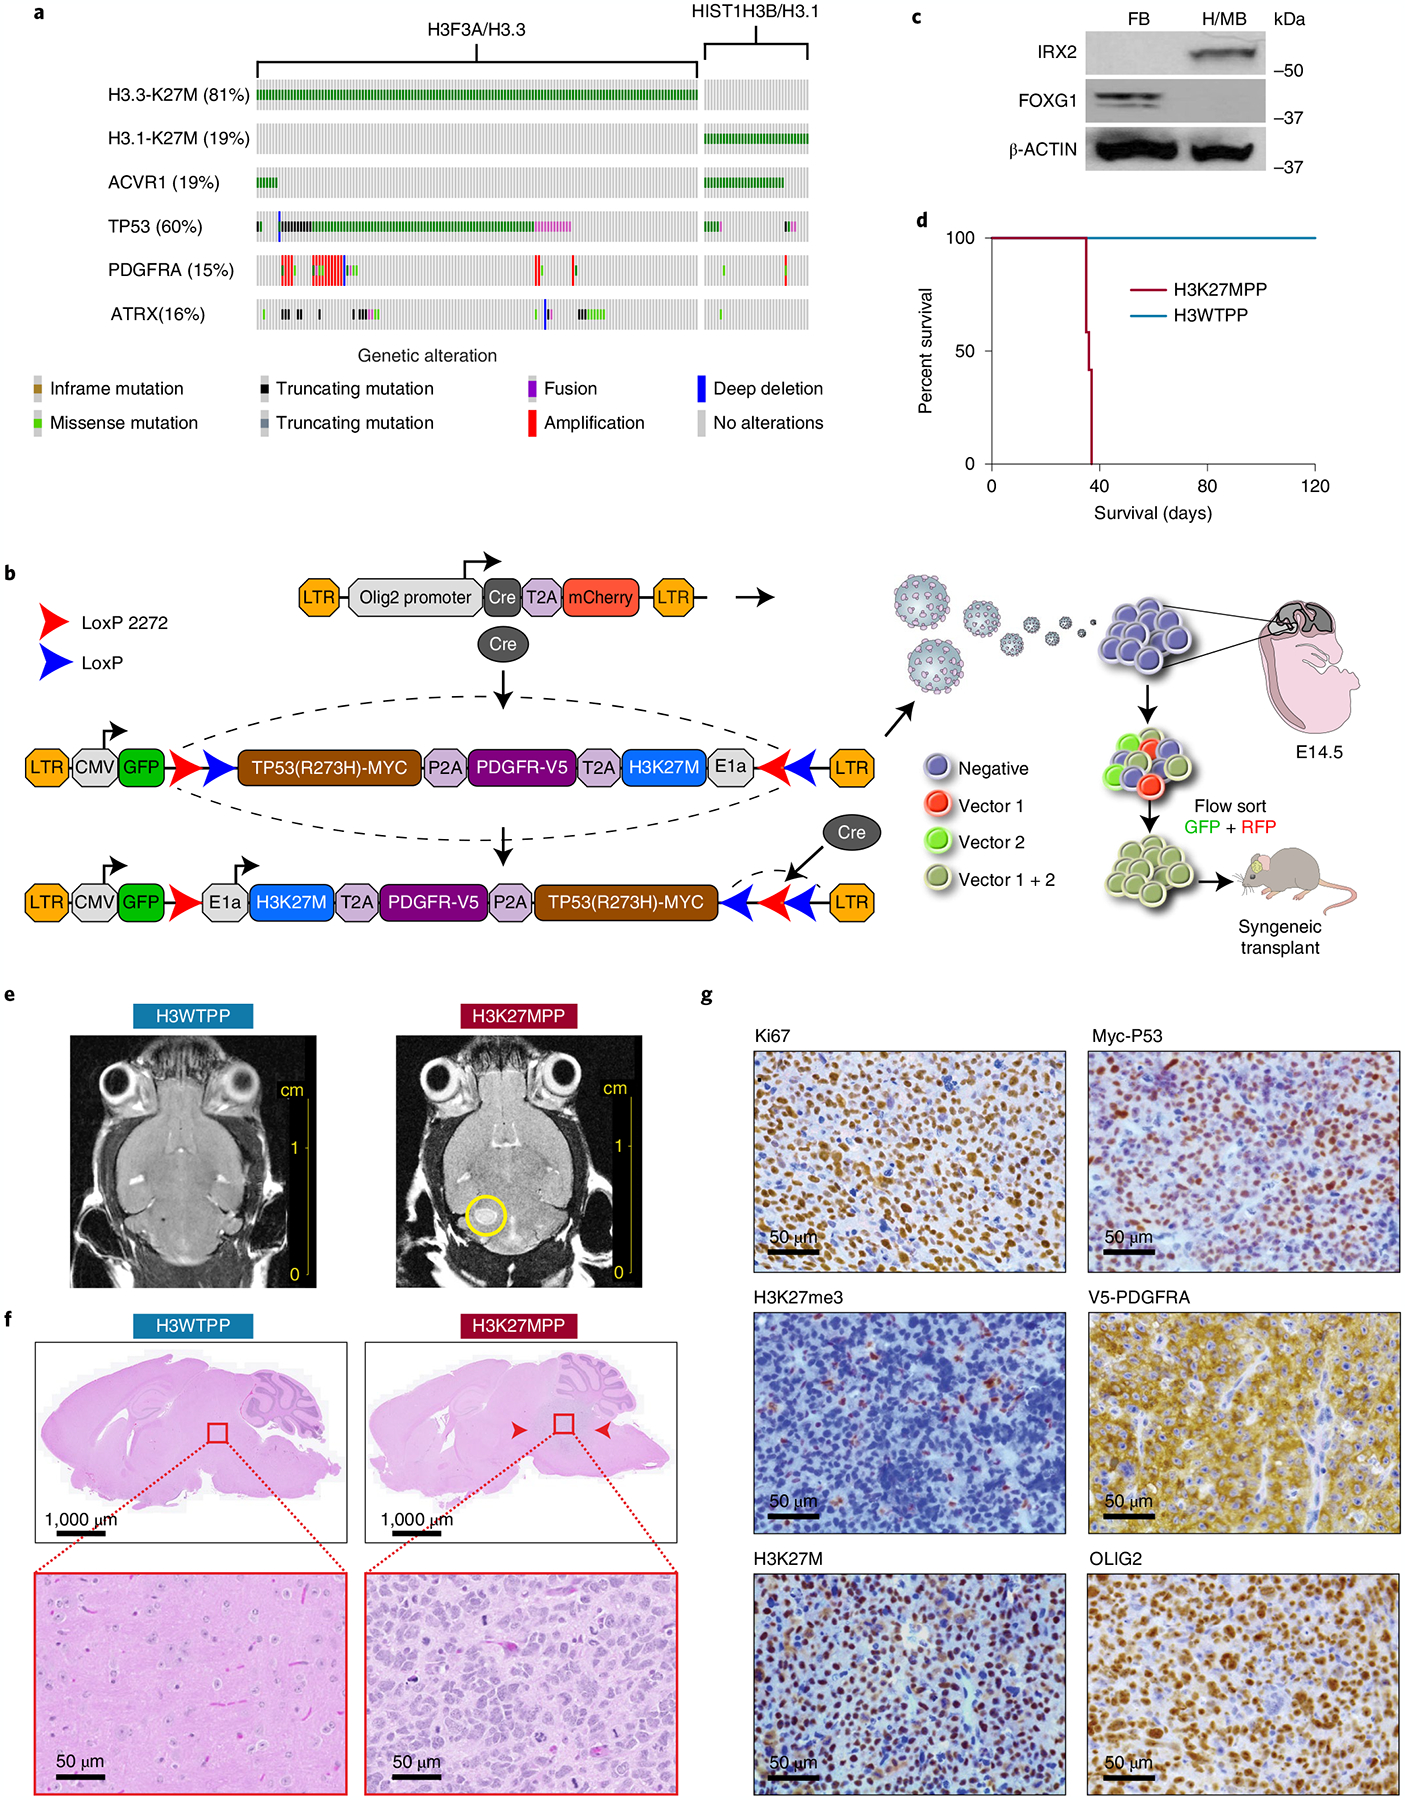
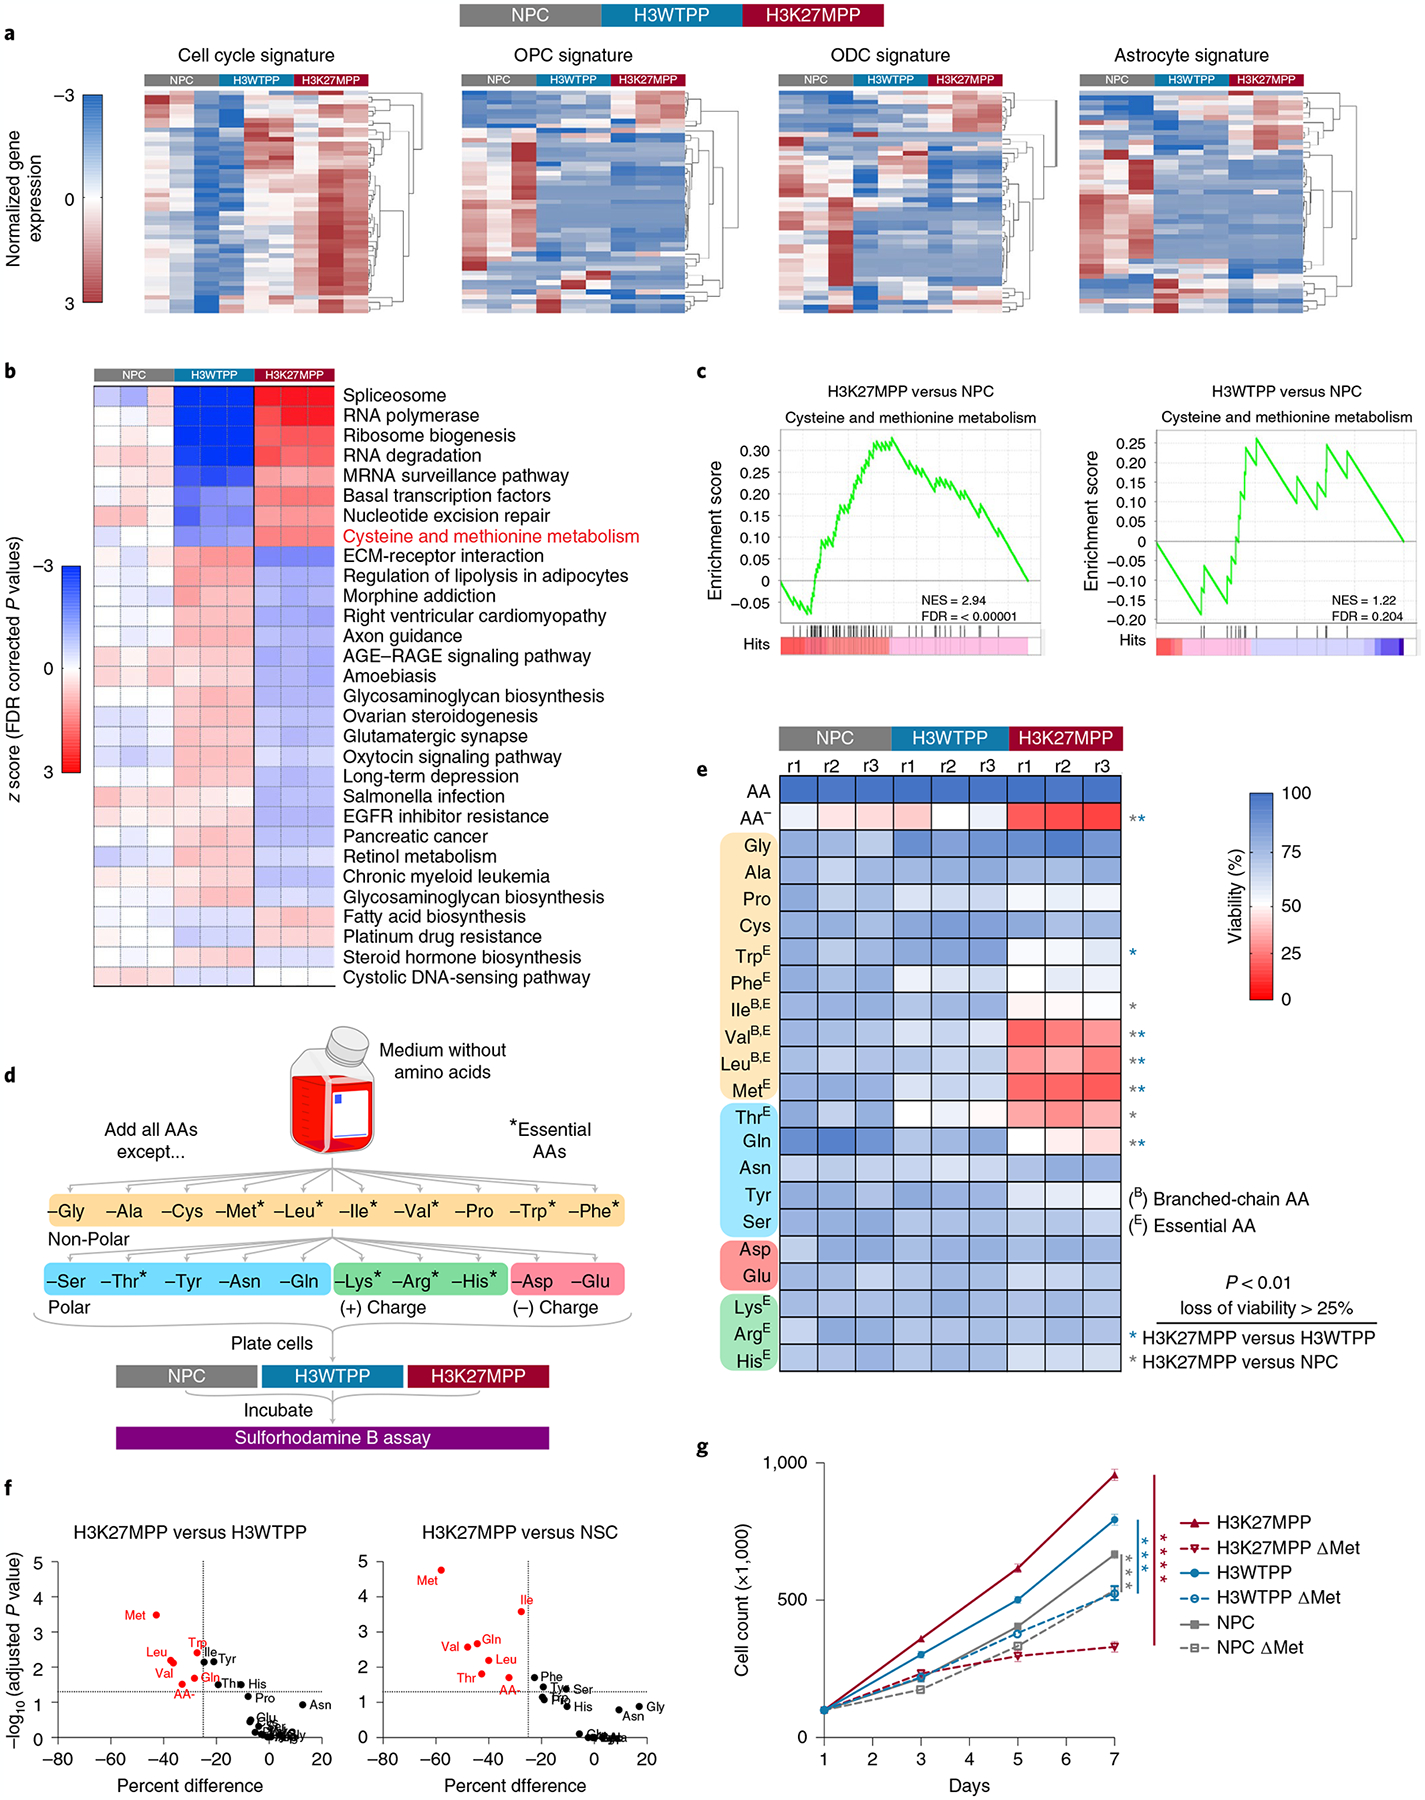
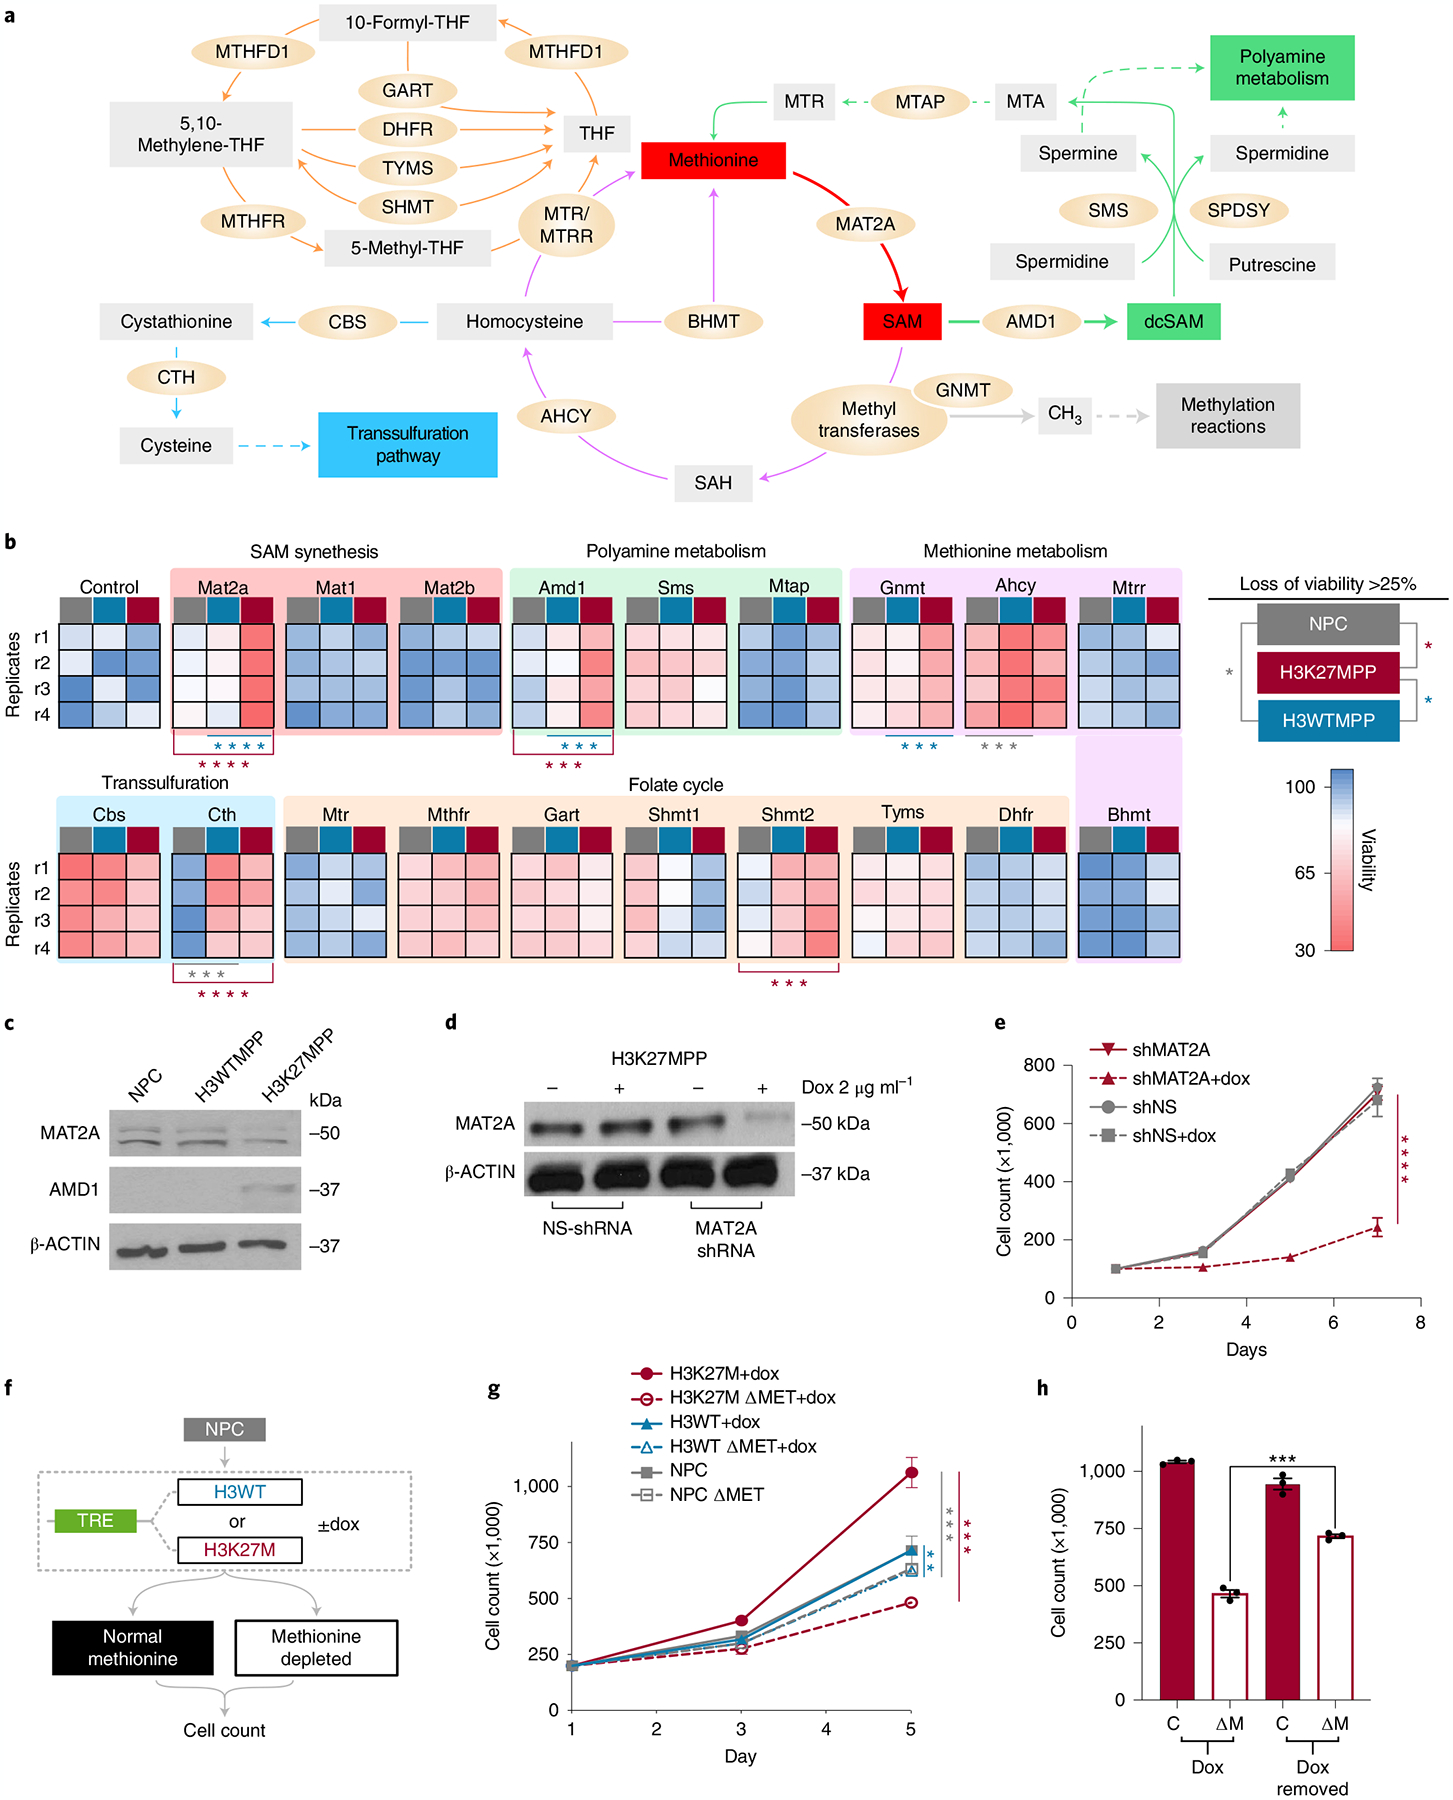
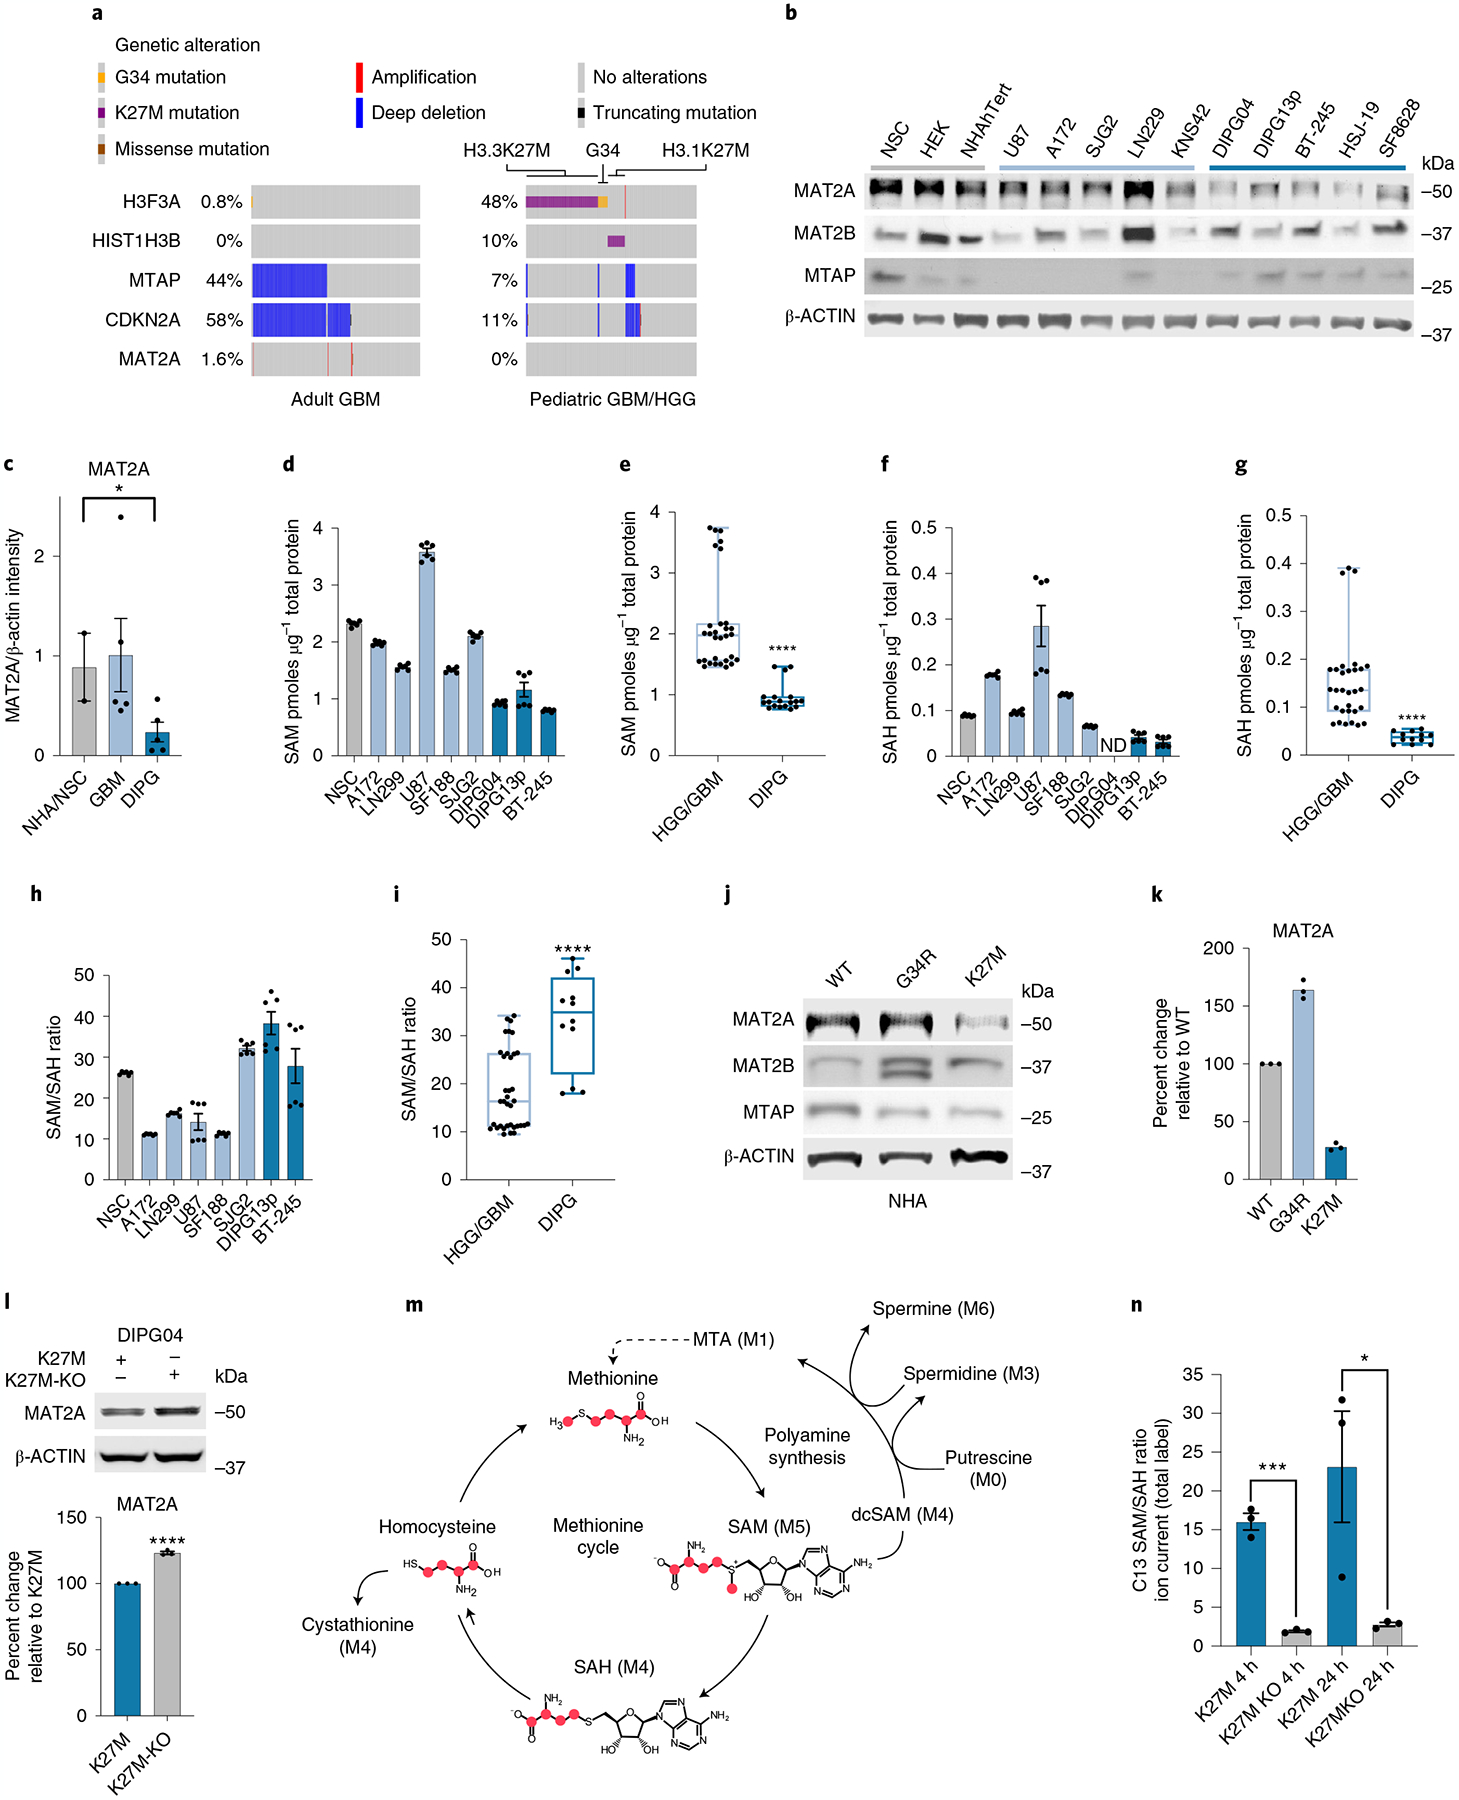
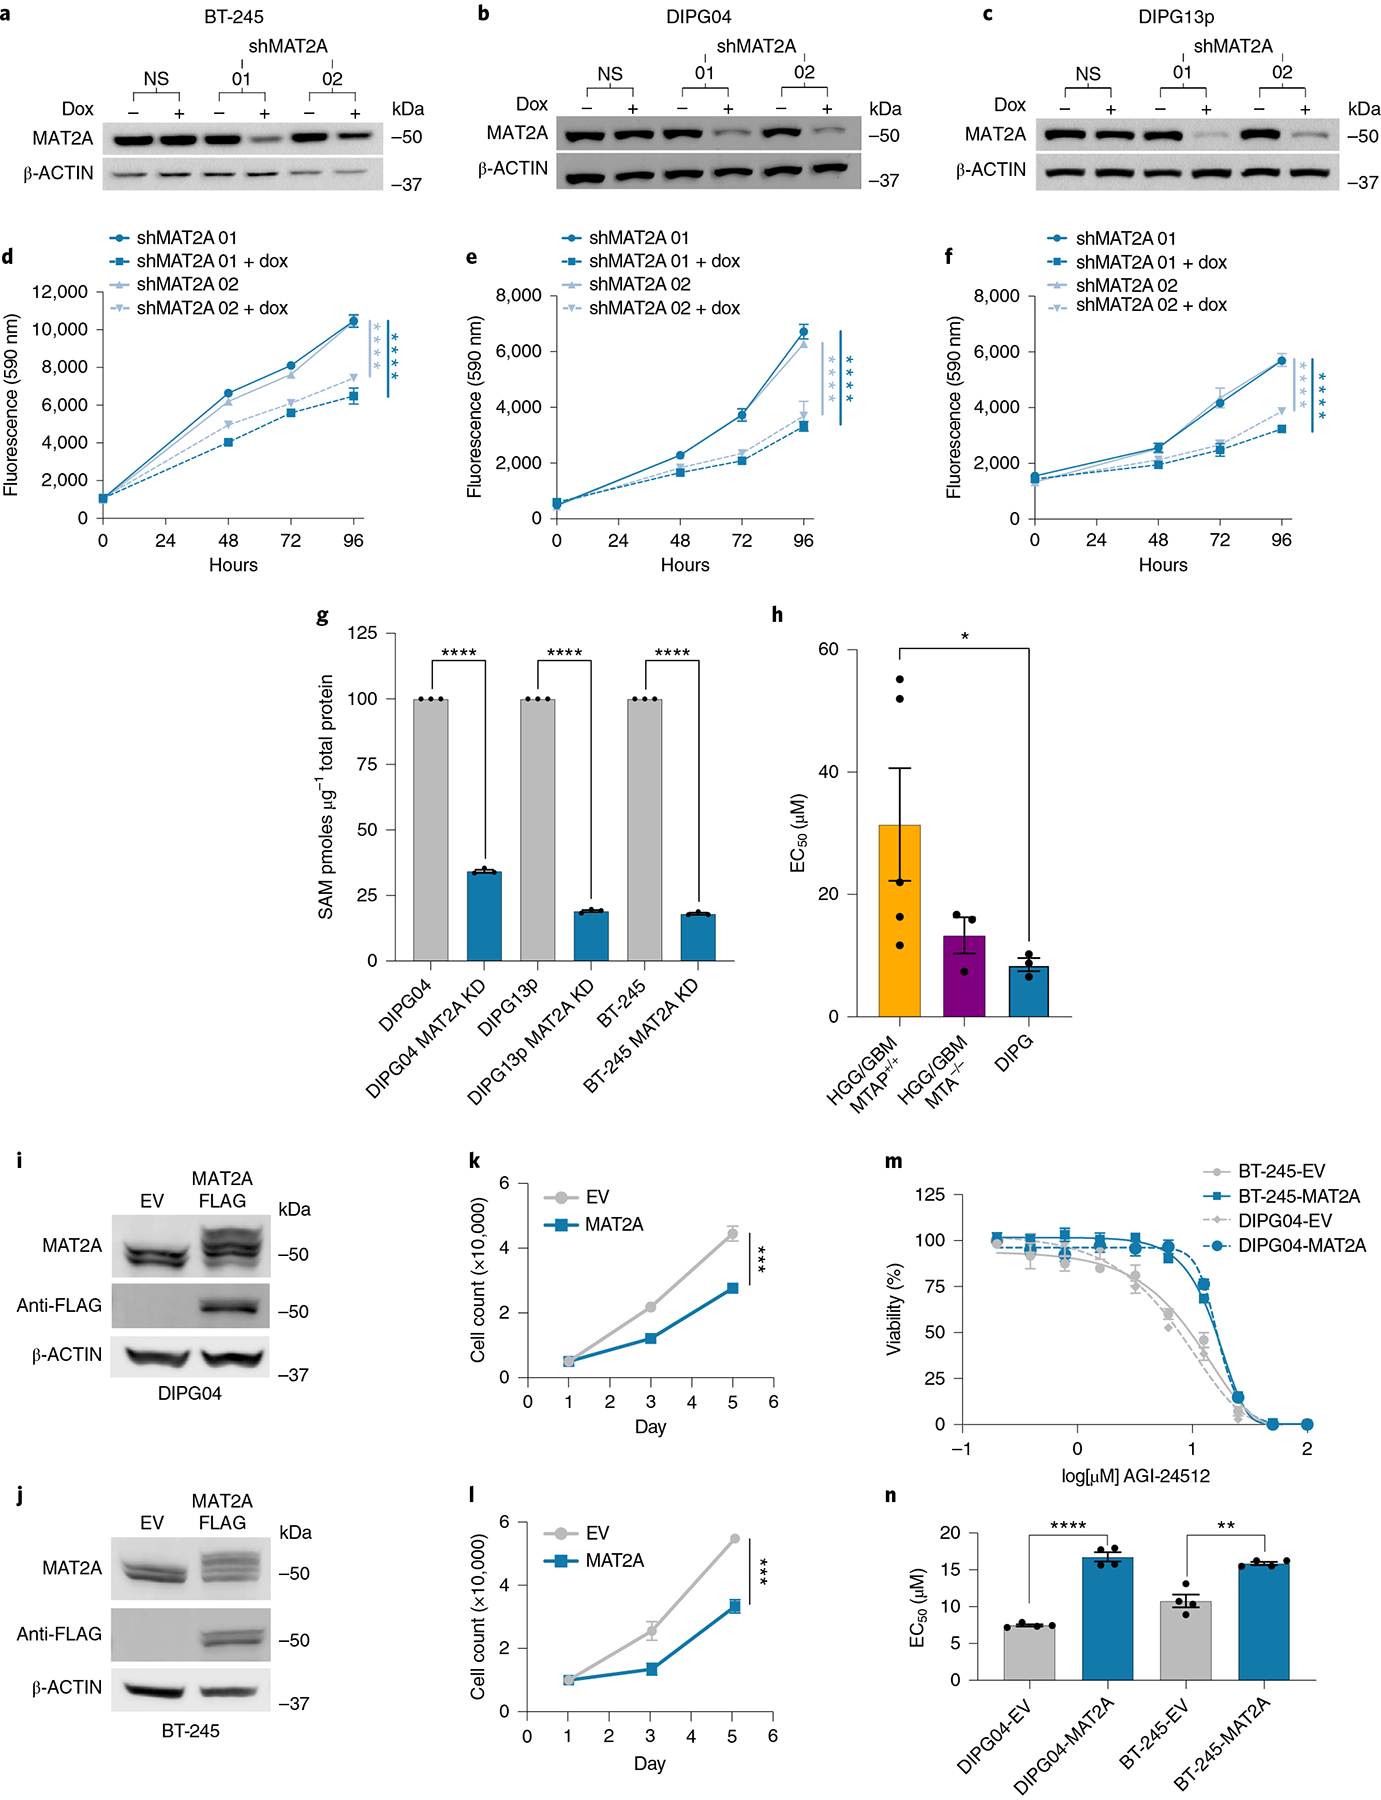
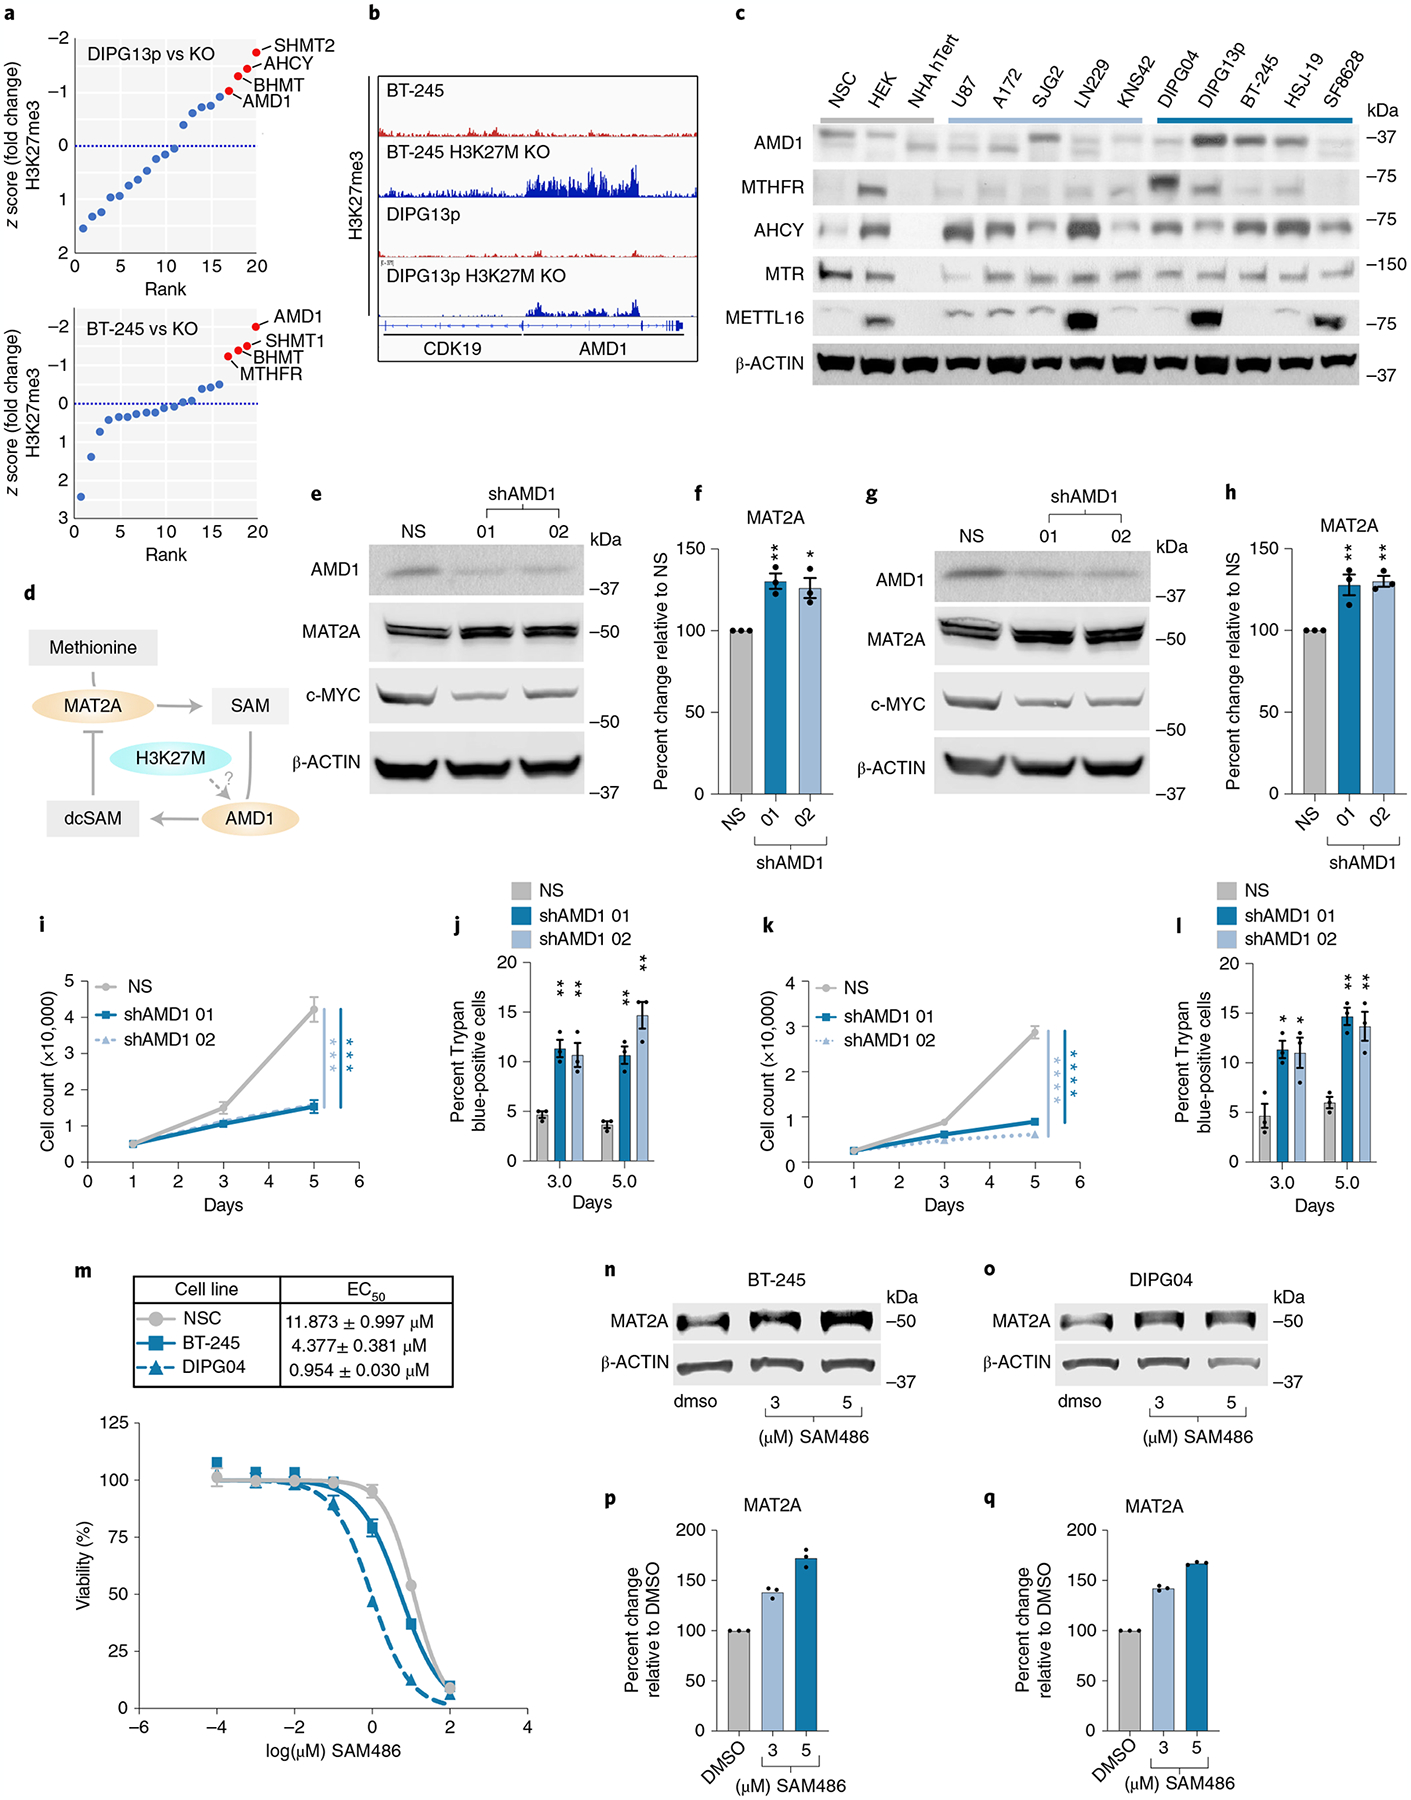
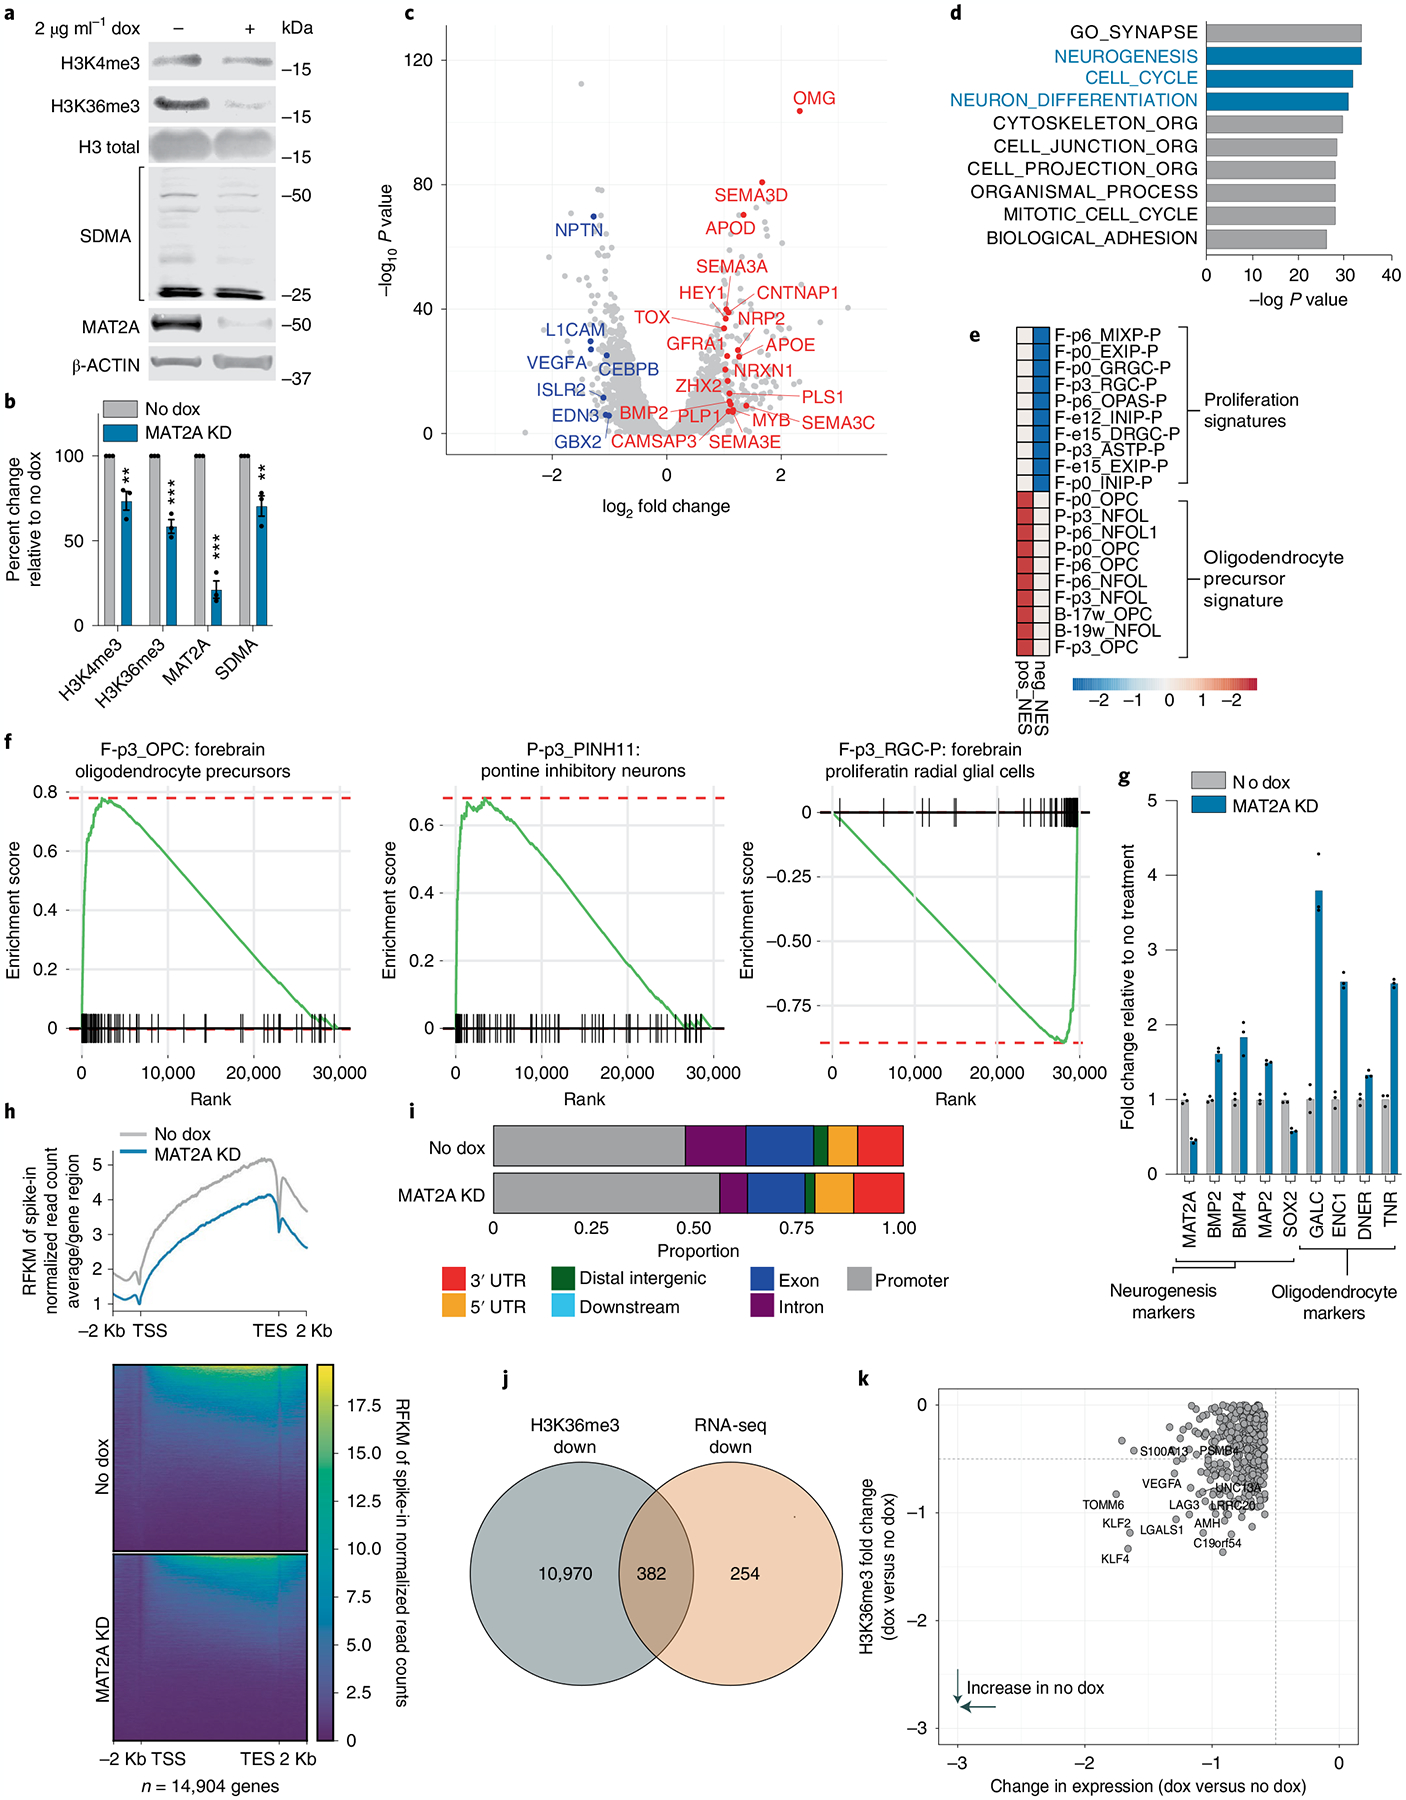
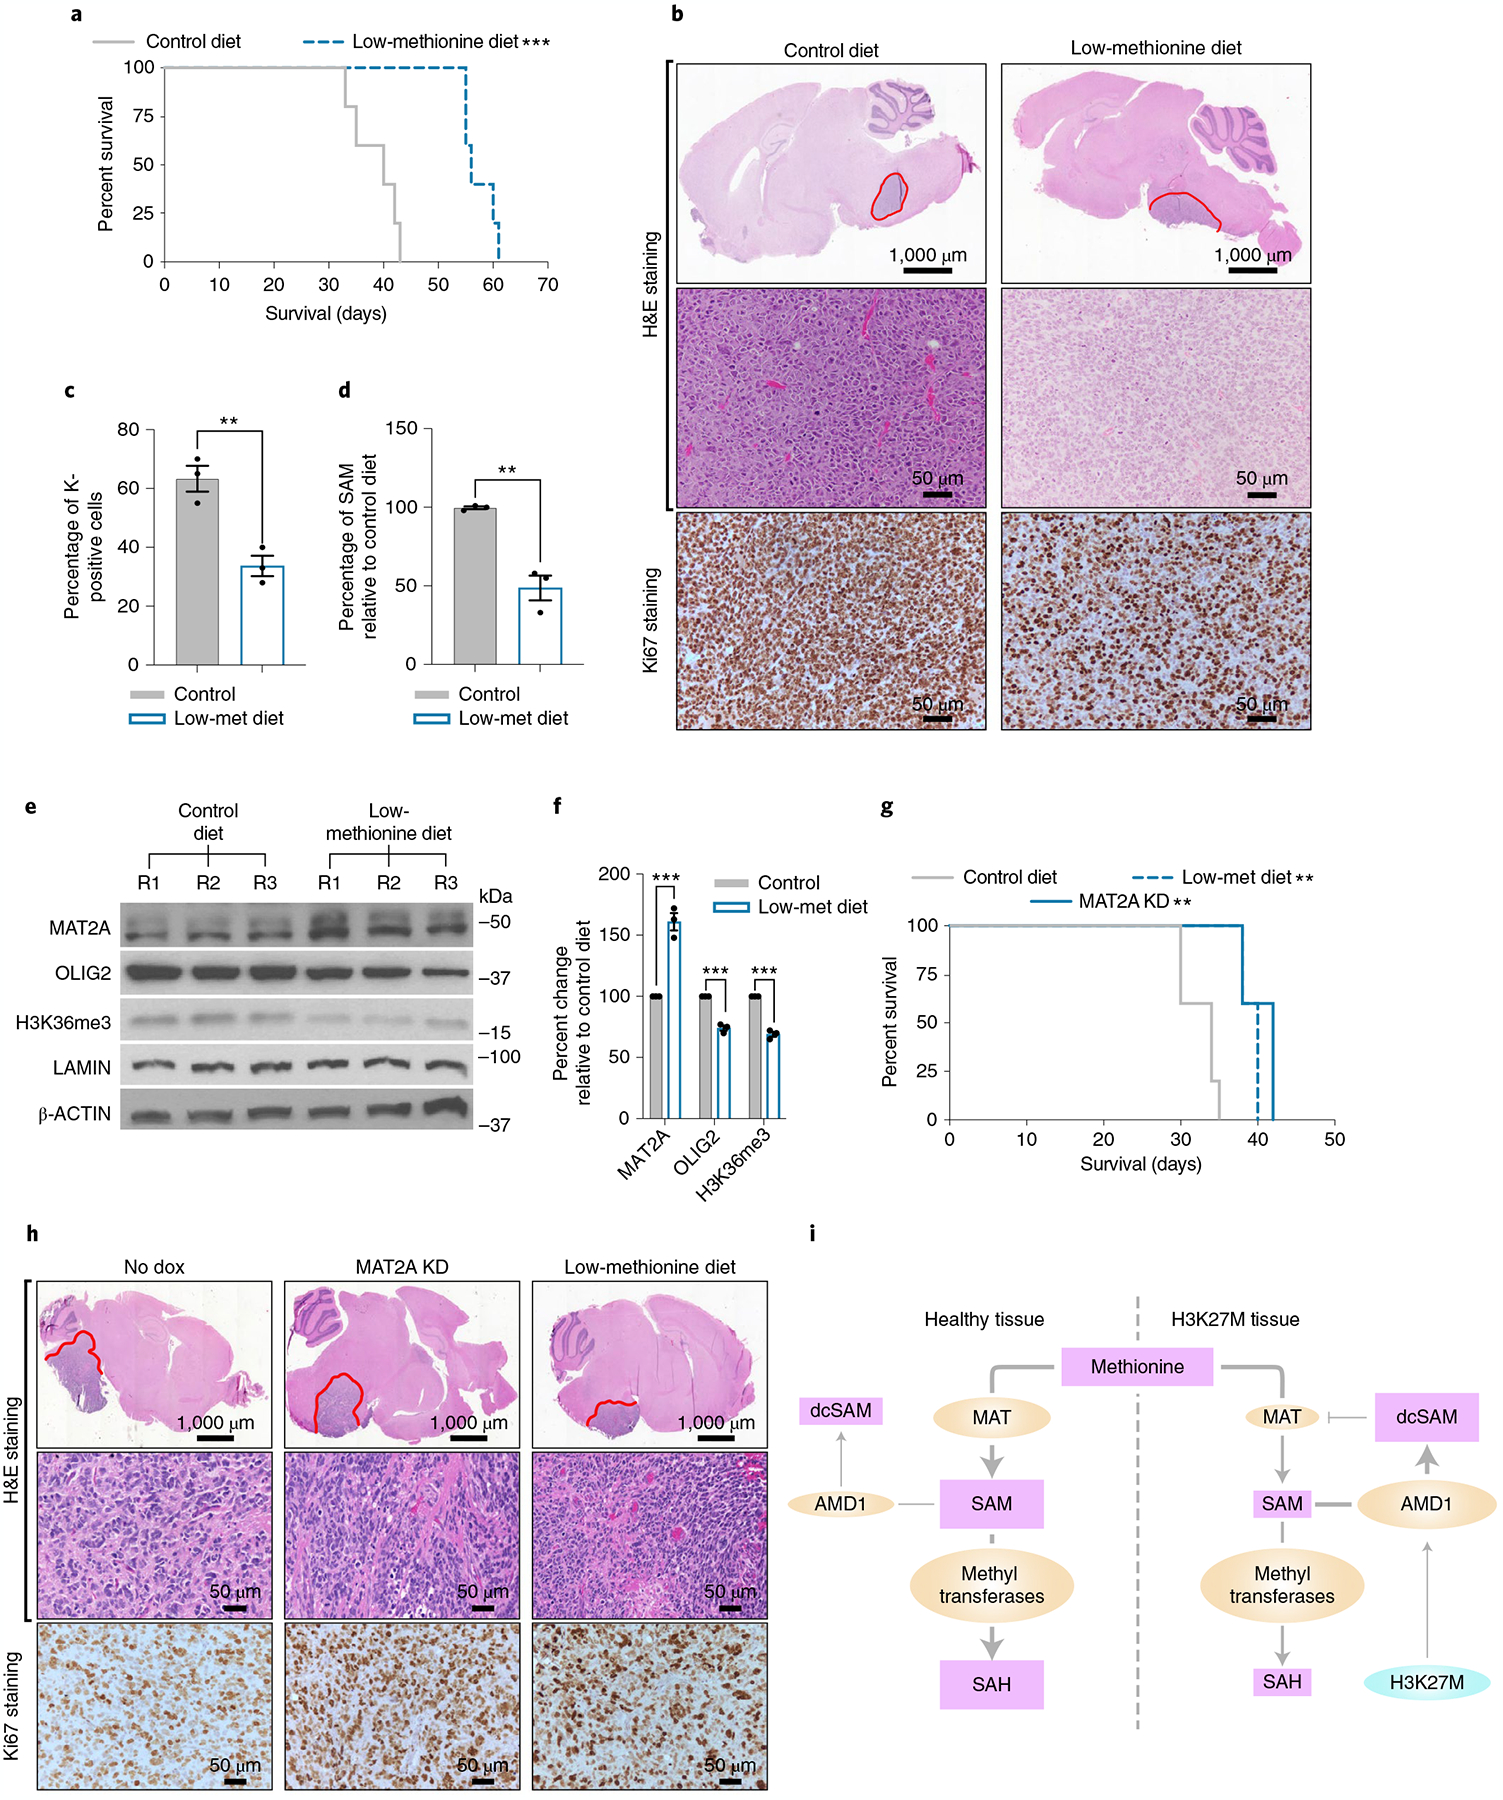
Diffuse midline gliomas (DMGs) bearing driver mutations of histone 3 lysine 27 (H3K27M) are incurable brain tumors with unique epigenomes. Here, we generated a syngeneic H3K27M mouse model to study the amino acid metabolic dependencies of these tumors. H3K27M mutant cells were highly dependent on methionine. Interrogating the methionine cycle dependency through a short-interfering RNA screen identified the enzyme methionine adenosyltransferase 2A (MAT2A) as a critical vulnerability in these tumors. This vulnerability was not mediated through the canonical mechanism of MTAP deletion; instead, DMG cells have lower levels of MAT2A protein, which is mediated by negative feedback induced by the metabolite decarboxylated S-adenosyl methionine. Depletion of residual MAT2A induces global depletion of H3K36me3, a chromatin mark of transcriptional elongation perturbing oncogenic and developmental transcriptional programs. Moreover, methionine-restricted diets extended survival in multiple models of DMG in vivo. Collectively, our results suggest that MAT2A presents an exploitable therapeutic vulnerability in H3K27M gliomas.


Conflict of interest statement

Competing interests

The authors declare no competing interests.

Figures

Extended Data Fig. 1 |
Extended Data Fig. 1 |. Generation of a Syngeneic Mouse Model of DIPG and RNA-seq profiling of NPC to H3WTMPP and H3K27MPP cells.
A. Western blot confirming epitope tagged transgene expression. B. Immunohistochemistry confirming transgene in negative in adjacent normal brain and cells are low for OLIG2 and positive for H3K27me3. Staining was confirmed in 3 independent mice. [AUs: Please include a scale bar]. C. Multidimensional scaling plot of RNA-seq data comparing control NPCs, H3WTPP and H3K27MPP cells. D-F. DESEQ2 Volcano plots comparing H3K27MPP cells to control NPCs (D), H3WTPP cells compared to control NPCs (E) and H3K27MPP cells to H3WTPP cells (F). Analysis was on RNA-sequencing performed on 3 biological replicates per condition. Statistical adjustments were made for multiple comparisons using iDEP.94 DESeq2 Statistical packages in R. Data displayed in blue or red represent genes with an FDR >0.05. G. Gene-set enrichment analysis (GSEA) using molecular terms, comparing H3WTPP and H3K27MPP from RNA-sequencing performed in biological triplicates for each condition.
Extended Data Fig. 2 |
Extended Data Fig. 2 |. SiRNA drop out screen reveals sensitivity to MAT2A and AMD1 loss.
A. Graphical representation of data in (Fig. 3B) plotted to percent difference in viability against −log10(adjusted P-value) generated from multiple T-tests unpaired, using Holm-Šídák method for multiple comparisons. (Left most graph comparing H3K27MPP vs H3WTPP, center H3K27MPP vs NSC, right H3WTPP vs NSC). siRNA in red Adjusted P-value<0.05 and percent loss of viability >25%. B. Cell count of NPC, H3WTPP, and H3K27MPP cells treated with 5 μM of MAT2A Inhibitor (AGI-24512) for 5 days. Experiments were performed in biological replicates (n=3). Statistical analysis performed as two-tailed, unpaired T-test. Data displayed as mean ± s.e.m. (NPC vs. NPC+MAT2Ai p=0.071), (H3WTPP vs. H3WTPP+MAT2Ai p=0.4486), and (H3K27MPP vs. H3K27MPP+MAT2Ai ***p<0.0001). C. Cell count of NPC, H3WTPP, and H3K27MPP cells treated with 5 μM of AMD1 inhibitor SAM426 for 5 days. Experiments were performed in biological replicates (n=3). Statistical analysis performed as two-tailed, unpaired T-test. Data displayed as mean ± s.e.m. (NPC vs. NPC+AMD1i p>0.9999), (H3WTPP vs. H3WTPP+AMD1i p=0.3248), and (H3K27MPP vs. H3K27MPP+AMD1i ***p<0.0001). D. Western blot comparing MAT2A and AMD1 expression in Histone H3 variant doxycycline inducible NPCs.
Extended Data Fig. 3 |
Extended Data Fig. 3 |. Effect of MAT2A inhibition in glioma lines. A-C.
Cell cycle analysis of control DMG cells compared to MAT2A knockdowns in (A) DIPG04, (B) BT-245 (C) DIPG13p. Experiments performed in biological triplicate. Statistical analysis as two-tailed, unpaired-T test. Data is displayed as mean± s.e.m. ((A) (DIPG04 NS No Dox vs. DIPG04 NS Dox %G2 *p=0.047), (DIPG04 MAT2A No Dox vs. Dox %G1 ****p=0.000004, %S ***p=0.000561, %G2 *p=0.014235). ((B) (BT-245 NS No Dox vs. Dox %S *p=0.041398), (BT-245 MAT2A No Dox vs. Dox %G1 ****p=0.000013, %S *p=0.017414, %G2 **p=0.004338). ((C) DIPG13p MAT2A No Dox vs. Dox %G1 ***p=0.000194, %S *p=0.011396). *p<0.05, **p<0.01, ***p<0.001, ****p<0.0001. p>0.05 not displayed. D. Summary of cell line features for MAT2A inhibitor viability response. E. Non-DMG/DIPG lines: Alamar blue viability response to varying doses of AG-24512. Experiments performed were in 5 biological replicates. Statistical analysis was performed using a one-way ANOVA followed by a Dunnett’s multiple comparison test. Data is displayed as mean± s.e.m. Adjusted P-values as follows: ((NHA) DMSO vs. 1 μM ****p<0.0001, DMSO vs. 10 μM *p=0.0107, DMSO vs. 100 μM ****p<0.0001), ((SF188) DMSO vs. 0.1 μM *p=0.0237, DMSO vs.10 μM *p=0.0297, DMSO vs. 100 μM ****p<0.0001), ((KNS42) DMSO vs. 1 μM *p=0.0269, DMSO vs. 10 μM **p=0.0086, DMSO vs. 100 μM ****p<0.0001), ((SJG2) DMSO vs. 1 μM ****p<0.0001, DMSO vs. 10 μM ****p<0.0001, DMSO vs. 100 μM ****p<0.0001). *p<0.05, **p<0.01, ***p<0.001, ****p<0.0001. p>0.05 not displayed. F. H3K27M mutant DIPG lines: Alamar blue viability in response to varying doses of AG-24512. Experiments performed were in 5 biological replicates. Statistical analysis was performed using a one-way ANOVA followed by a Dunnett’s multiple comparison test. Data is displayed as mean± s.e.m. Adjusted P-values as follows: ((DIPG04) DMSO 0.1 μM ***p=0.0004, DMSO vs. 10 μM ****p<0.0001, DMSO vs. 100 μM ****p<0.0001), ((BT-245) DMSO vs. 0.1, 1, 10, 100 μM ****p<0.0001), ((DIPG13p) DMSO vs. 10, 100 μM ****p<0.0001), ((NSC) DMSO vs. 100 μM ****p<0.0001). *p<0.05, **p<0.01, ***p<0.001, ****p<0.0001. p>0.05 not displayed.
Extended Data Fig. 4 |
Extended Data Fig. 4 |. MAT2A Overexpression reduces cell proliferation and increases EC50s to AG-24512.
A. Western blot of MAT2A-FLAG overexpression in H3K27MPP cells. B. Cell count of H3K27MPP cells comparing combinations of MAT2A over-expression, methionine deprivation, and MAT2A inhibitor. Experiments were performed in biological replicates (n=3). Data is displayed as mean± s.e.m. Statistical analysis performed as two-tailed, unpaired T-test. (H3K27MPP vs. H3K27MPP MAT2A OE *p=0.0285), (H3K27MPP+MR vs. H3K27MPP MAT2A OE+MR ***p=0.0004), and (H3K27MPP+MAT2Ai vs. H3K27MPP MAT2A OE+MAT2Ai **p=0.0013). *p<0.05, **p<0.01, ***p<0.001, ****p<0.0001. C. Quantification of SAM in H3K27MPP control and MAT2A over expressing (OE) cells compared with H3WTPP and NSC. Experiments were performed in biological replicates (n=4). Data is displayed as mean± s.e.m. Statistical analysis performed as two-tailed, unpaired T-test. (H3K27MPP vs. H3K27MPP MAT2A OE ****p<0.0001), (H3K27MPP vs. H3WTPP **p=0.0012), and (H3K27MPP vs. NPC **p=0.001). *p<0.05, **p<0.01, ***p<0.001, ****p<0.0001. D. Cell count of H3K27MPP cells comparing combinations of MAT2A Inhibitor (AGI-24512), AMD1 inhibitor (SAM426) and methionine deprivation conditions. Experiments were performed in biological replicates (n=3). Data is displayed as mean± s.e.m. Statistical analysis performed as two-tailed, unpaired T-test. (H3K27MPP+MR vs. H3K27MPP+MR+AMD1i **p=0.0016). E. Quantification of SAM in H3K27MPP cells comparing the combination of AMD1 inhibitor (SAM426) with methionine deprivation conditions. Experiments were performed in biological replicates (n=4) Data is displayed as mean± s.e.m. Statistical analysis performed as two-tailed, unpaired T-test. (H3K27MPP vs. AMD1i ***p=0.0003), (H3K27MPP vs. MR ***p=0.0002), and (H3K27MPP+MR vs. H3K27MPP+MR+AMD1i **p=0.0089). *p<0.05, **p<0.01, ***p<0.001, ****p<0.0001.
Extended Data Fig. 5 |
Extended Data Fig. 5 |. The effects of dcSAM on MAT2A intron retention and protein stability.
A. Fold change in total MAT2A transcript levels relative to DMSO control in DIPG04 cells incubated for 6 hours in the following: 0.1 μM AGI-24512, 500 μM SAM and 500 μM dcSAM. Experiment was performed once, and samples were repeatedly measured in triplicate for each condition. B. Percent Intron 8 retention in total MAT2A transcript in DIPG04 cells incubated for 6 hours in the following: 0.1 μM AGI-24512, 500 μM SAM and 500 μM dcSAM. Experiment was performed once, n=3 technical replicates for each condition. C. Quantitative western blotting of MAT2A protein and actin in DIPG04 cells incubated for 48 hours in the following: 0.1 μM AGI-24512, 500 μM SAM and 500 μM dcSAM. D. Quantification of westerns from C) using Li-Cor fluorescent system. Biological replicate of n=3. Biological samples were measured 3 times and the average intensity was plotted for each biological replicate. Adjusted P-values as follows: (DMSO vs. AGI 10 μM ***p=0.0009), (DMSO vs. SAM 500 μM *p=0.0439), and (DMSO vs. dcSAM 500 μM *p=0.0189). *p<0.05, **p<0.01, ***p<0.001, ****p<0.0001. E. Fold change in total MAT2A transcript levels relative to DMSO control in NSC-PT2 cells incubated for 6 hours in the following: 0.1 μM AGI-24512, 500 μM SAM and 500 μM dcSAM. Experiment was performed once, and samples were repeatedly measured in triplicate for each condition. F. Percent intron 8 retention in total MAT2A transcript in NSC-PT2 cells incubated for 6 hours in the following: 0.1 μM AGI-24512, 500 μM SAM and 500 μM dcSAM. Experiment was performed once, n=3 technical replicates for each condition. G. Quantitative Western blotting of MAT2A protein and actin in NSC-PT2 cells incubated for 48 hours in the following: 0.1 μM AGI-24512, 500 μM SAM and 500 μM dcSAM. H. Quantification of westerns from G) using Li-Cor fluorescent system. Biological replicate of n=3. Biological samples were measured 3 times and the average intensity was plotted for each biological replicate. Adjusted P-values as follows: (DMSO vs. AGI 10 μM *p=0.033), (DMSO vs. SAM 500 μM *p=0.0153), and (DMSO vs. dcSAM 500 μM *p=0.0116). ((D, H) Statistical analysis performed as a repeated measures one-way ANOVA followed by Dunnett’s multiple comparisons test. Data displayed as mean ± s.e.m.).
Extended Data Fig. 6 |
Extended Data Fig. 6 |. Functional characterization of MAT2A knockdown in human DMG patients.
A. Quantitative Western Blotting of histone modifications (H3K4me3 and H3K36me3), and SDMA in BT-245 cells comparing MAT2A knockdown to control cells. B. Quantification of histone modifications (H3K4me3 and H3K36me3), SDMA, and MAT2A using Li-Cor fluorescent system for BT-245 cells, MAT2A knockdown vs control cells. Experiments performed in biological replicate of n=3, samples were repeatedly measured 3 times. Statistical analysis performed as two-tailed, unpaired T-test. Data displayed as mean ± s.e.m. (No Dox vs. Dox H3K4me3 **p=0.004557, H3K36me3 **p=0.003499, MAT2A ****p=0.00004, SDMA ***p=0.000578). *p<0.05, **p<0.01, ***p<0.001, ****p<0.0001. C. Quantitative Western Blotting of histone modifications (H3K4me3, H3K36me3), and SDMA in DIPG04 cells comparing MAT2A knockdown to control cells. D. Quantification of histone modifications (H3K4me3 and H3K36me3), SDMA, and MAT2A using Li-Cor fluorescent system for DIPG04 cells, MAT2A knockdown vs. control cells. Experiments performed in biological replicate of n=3, samples were repeatedly measured 3 times. Statistical analysis performed as two-tailed, unpaired T-test. Data displayed as mean ± s.e.m. (No Dox vs. Dox H3K4me3 ***p=0.000861, H3K36me3 ***p=0.000296, MAT2A **p=0.003325, SDMA **p=0.002049). *p<0.05, **p<0.01, ***p<0.001, ****p<0.0001.
Extended Data Fig. 7 |
Extended Data Fig. 7 |. Silencing MAT2a alters the transcriptome and H3K36me3 deposition.
A. Volcano plot of differential gene expression comparing MAT2A knockdown to control DIPG04 cells. Canonical neuronal markers are highlighted in red (designating up-regulated genes) or blue (designating down-regulated genes). Statistical adjustments were made for multiple comparisons using iDEP.94 DESeq2 Statistical packages in R. B. Top 10 Gene sets, (Gene Ontology), derived from GSEA analysis of changes to the transcriptome in MAT2A knockdown. C. Heatmap of top 10 negative and positive enriching developmental cell signatures in MAT2A knockdown. D. Enrichment plots of selected developmental cell signatures from Extended Data Fig. 7C. E. Realtime PCR validation of selected canonical neurogenesis genes and markers of oligodendrocyte cells. Experiment was performed one time, n=3 technical triplicates for each gene. F. Heatmap of spike-in normalized H3K36me3 ChIP-Rx-seq reads centered at human genes in no doxycycline (top panel) vs. doxycycline (bottom panel) induction of MAT2A shRNA expression in DIPG04 cells. G. Bar plots of H3K36me3 ChIP-Rx-seq reads demonstrating alterations of H3K36me3 at different regions summarized across all human genes in DIPG04 cells. H. Venn diagram of overlapping genes between ChIP-Rx-seq and RNA-seq data. I. Plot of H3K36me3 (fold-change) vs. RNA seq (fold-change) with MAT2A KD, neurogenesis makers are indicated.
Extended Data Fig. 8 |
Extended Data Fig. 8 |. Leading edge analysis enriched developmental cell signatures in MAT2A KD.
A-C. Leading edge analysis of DIPG13pP Enrichment plots (Fig. 7F). D-F. Leading edge analysis of DIPG04 Enrichment plots (Extended Data Fig. 7D).
Extended Data Fig. 9 |
Extended Data Fig. 9 |. MAT2A knockdown decreases H3K36me3 globally in DMG cells.
A. Plot Showing a decrease in H3K36me3 signal with MAT2A KD in DIPG13p cells. Statistical analysis was performed on 1 Mb bins comparing a single DIPG13p sample with Mat2a KD vs control (no doxycycline) using a two-sided Wilcoxon test, **p=0.0013, the center line denotes the median and the lower and upper ends of the box denote the 25th and 75th percentiles respectively. The whiskers indicate the maximum and the minimum values of the data distribution. B. Plot Showing a decrease in H3K36me3 signal with MAT2A KD in DIPG04 cells. Statistical analysis was performed on 1 Mb bins comparing a single DIPG04 sample with Mat2a KD vs control (no doxycycline) using a two-sided Wilcoxon test, ****p<2.22e-16., the center line denotes the median and the lower and upper ends of the box denote the 25th and 75th percentiles respectively. The whiskers indicate the maximum and the minimum values of the data distribution. C, D. GSEA analysis using Cell Type Signature Datasets in DIPG13p (C) and DIPG04 (D) with genes which are significantly differential in both RNA-seq and ChIP datasets after MAT2A KD. E, F. GSEA analysis using GO Biological Processes Datasets in DIPG13p (E) and DIPG04 (F) with genes which are significantly differential in both RNA-seq and ChIP datasets after MAT2A KD.
Extended Data Fig. 10 |
Extended Data Fig. 10 |. Methionine Restriction induced viability defect and total H3K36me3 loss can be rescued with SAM repletion in DMG cells.
A. Percent viable cell count of BT-245 cells grown in media with 10% of normal methionine levels relative to control (100%) and supplemented with escalating concentrations of SAM. Adjusted P-values as follows: (10%Met 0 μMSAM vs. 10%Met 5 μM SAM **p=0.0042), and (10%Met 0 μMSAM vs. 10%Met 50 μM SAM ****p<0.0001). B. Quantitative western blotting of MAT2A, H3K36me3, and histone H3 in BT-245 cells comparing 10% methionine media with 100% supplemented with 500 μM of SAM. C, D. Quantification of MAT2A and H3K36me3 using Li-Cor fluorescent system for BT-245 cells comparing. 10% methionine media with 100% supplemented with 500uM of SAM. Biological replicate of n=3, samples were repeatedly measured 3 times. ((C) (100%Met vs. 100%+SAM p=0.7178), (100%Met vs. 10%Met *p=0.0394), and (100%Met vs. 10%Met+SAM p=0.3989). ((D) (100%Met vs. 100%+SAM ****p<0.0001), (100%Met vs. 10%Met ****p<0.0001), and (100%Met vs. 10%Met+SAM *p=0.0171). E. Percent viable cell count of DIPG04 cells grown in media with 10% of normal methionine levels relative to control (100%) and supplemented with escalating concentrations of SAM. Adjusted P-values as follows: (10%Met 0 μMSAM vs. 10%Met 5 μM SAM *p=0.0141), and (10%Met 0 μMSAM vs. 10%Met 50 μM SAM ****p<0.0001). F. Quantitative western blotting of MAT2A, H3K36me3, and histone H3 in DIPG04 cells comparing 10% methionine media with 100% supplemented with 500 μM of SAM. G, H. Quantification of MAT2A and H3K36me3 using Li-Cor fluorescent system for DIPG04 cells comparing. 10% methionine media with 100% supplemented with 500uM of SAM. ***p<0.0001 Biological replicate of n=2, samples were repeatedly measured 3 times. ((G) (100%Met vs. 100%+SAM *p=0.0135), (100%Met vs. 10%Met *p=0.0479), and (100%Met vs. 10%Met+SAM p=0.7667). ((H) (100%Met vs. 100%+SAM p=0.7451), (100%Met vs. 10%Met ***p=0.0004), and (100%Met vs. 10%Met+SAM p=0.7897). I. Percent viable cell count of DIPG13P cells grown in media with 10% of normal methionine levels relative to control (100%) and supplemented with escalating concentrations of SAM. Adjusted P-values as follows: (10%Met 0 μMSAM vs. 10%Met 5 μM SAM p=0.1167), and (10%Met 0 μMSAM vs. 10%Met 50 μM SAM ****p<0.0001). J. Quantitative western blotting of MAT2A, H3K36me3 and histone H3 in DIPG13p cells comparing 10% methionine media with 100% supplemented with 500 μM of SAM. K, L. Quantification of MAT2A and H3K36me3 using Li-Cor fluorescent system for DIPG13p cells comparing 10% methionine media with 100% supplemented with 500 μM of SAM. ***p<0.0001 Biological replicate of n=3, samples were repeatedly measured 3 times. ((K) (100%Met vs. 100%+SAM ***p=0.0008), (100%Met vs. 10%Met **p=0.0015), and (100%Met vs. 10%Met+SAM *p=0.0242). ((L) (100%Met vs. 100%+SAM p=0.8428), (100%Met vs. 10%Met **p=0.0057), and (100%Met vs. 10%Met+SAM p=0.6469). ((A, E, I) Experiments performed were in biological triplicates. Statistical analysis performed as a one-way ANOVA followed by Šídák’s multiple comparisons test. Data displayed as mean ± s.e.m.). ((C-D, G-H,K-L) Statistical analysis performed as a two-tailed, unpaired T-test. Data displayed as mean ± s.e.m.).
Fig. 1 |
Fig. 1 |. Generation of a syngeneic mouse model of DIPG.
a, Oncoprint of H3K27M mutant tumors with top alterations. In addition to H3K27M, we selected PDGFRA and TP53 to target in our model development. b, Schematic of strategy used to target OLIG2-positive NPCs using flip-excision (FLEx) cassette switches, whereby Olig2 promoter drives Cre expression and the target genes H3F3A, TP53 and PDGFRA are inverted. c, Western blot confirming regional isolation of NPCs. FOXG1 for forebrain and IRX2 for mid/hindbrain. All western blots were performed in biological triplicate. d, Kaplan–Meier survival curve of 2.5 × 10⁴ H3K27MPP cells or H3WTPP cell injected into the midbrain-pons of immunocompetent C57BL/6 mice. A log-rank Mantel–Cox test was performed between the groups with n = 12 mice per group (6 male and 6 female). ****P = 0.0005. e, MRI viewing the axial plane of mice 14 d after injection confirming tumor in H3K27MPP cells. f, Hematoxylin and eosin (H&E) staining confirming high-grade glioma histology from H3K27MPP-injected cells. g, Immunohistochemistry confirming transgene expression in vivo and loss of H3K27me3 in our model. All experiments were performed in biological triplicate.
Fig. 2 |
Fig. 2 |. Transcriptional profiling identifies alteration in methionine metabolism in DMG.
a, Hierarchical clustering (HCL) of 1,500 most variable genes among H3K27MPP cells, H3WTPP cells and OLIG2-positive NPCs. b, KEGG pathway analysis comparing NPC, H3WTPP, and H3K27MPP cells. The P values were corrected for multiple testing using FDR. c, GSEA plots of H3K27MPP and H3WTPP cells compared to NPC control cells for cysteine and methionine metabolism. d, Schematic of AA dropout screen, where AAs are grouped by their properties and essentiality. e, AA dropout screen in control OLIG2-positive NPCs, H3K27MPP cells and H3WTPP cells. The screen was performed in biological triplicate with technical replicates of n = 3. P values are provided for AAs that resulted in >25% loss of viability compared to control (H3K27MPP versus H3WTPP Met P = 0.000014, Trp P = 0.000185, Leu P = 0.000321, Val P = 0.00045, Gln P = 0.001304, AA P = 0.00207; H3K27MPP versus NSC Met P = 0.000001, Ile P = 0.000013, Gln P = 0.000108, Val P = 0.000141, Leu P = 0.000357, Thr P = 0.000915, AA P = 0.002651). f, Graphical representation of data in e plotted to percentage difference in viability against −log10(adjusted P value). Comparison of H3K27MPP versus H3WTPP (left), comparison of H3K27MPP versus NSC (right). g, Direct cell counts of control, H3WTPP and H3K27MPP cells in control and methionine-depleted medium. Experiments were performed in biological triplicate. Statistical analysis was performed on day 7 using an unpaired, two-tailed t-test. Data are represented as the mean ± s.e.m. (H3K27MPP versus H3K27MPP + MR P = 0.000003; H3WTPP versus H3WTPP + MR P = 0.000145; and NSC versus NSC + MR P = 0.000479). *P < 0.05, **P < 0.01, ***P < 0.001, ****P < 0.0001. Data in ac were analyzed from RNA-sequencing performed in biological triplicate for each condition. Statistical analysis was performed using multiple unpaired t-tests and the Holm–Šídák method was used for multiple comparisons (e,f).
Fig. 3 |
Fig. 3 |. H3K27M, PDGFRA and P53 R237H cooperate to alter metabolism.
a, Methionine metabolism containing the methionine cycle, folate cycle and methionine salvage/polyamine pathways. b, siRNA screen targeting several enzymes and proteins related to methionine metabolism. Data are represented as a heat map of the average of four independent biological replicates. Statistical analysis was performed using multiple unpaired t-tests; the Holm–Šídák method was used for multiple comparisons. P values provided for siRNA that resulted in >25% loss of viability compared to control. H3K27MPP versus NSC Mat2a (P < 0.000001), Cth (P = 0.000064), Amd1 (P = 0.000118) and Shmt2 (P = 0.000149). H3K27MPP versus H3WTPP Mat2a (P < 0.000001), Gnmt (P = 0.000138) and Amd1 (P = 0.00048). H3WTPP versus NSC Cth (P = 0.000326) and Ahcy (P = 0.00034). Graphical representation of all siRNA percentage change to significance is provided in Extended Data Fig. 2a. *P < 0.05, **P < 0.01, ***P < 0.001, ****P < 0.0001. P > 0.05 not shown. c, Western blot comparing MAT2A and AMD1 expression in H3WTPP, H3K27MPP and control OLIG2-positive NPCs. d, Western blot confirming MAT2A knockdown with non-targeting and MAT2A dox-inducible shRNA in H3K27MPP cells. e, Cell count of H3K27MPP cells over several time points with control or MAT2A knockdown. Experiments were performed in biological triplicate. Statistical analysis was performed on day 7 (shMat2a versus shMat2a + dox, ****P = 0.000037; P > 0.05 not shown). f, Schematic of dox-inducible H3K27M and H3WT constructs introduced into NPCs. g, Cell counts of control NPC, dox-inducible H3WT and H3K27M in methionine-depleted conditions (P < 0.05). Experiments performed were in biological triplicate. Statistical analysis was performed on day 5 (H3K27MPP + dox versus H3K27MPP + dox + MR P = 0.000132; H3WTPP + dox versus H3WTPP + dox + MR P = 0.001547; NPC + MR versus H3K27MPP + dox + MR P = 0.000378). *P < 0.05, **P < 0.01, ***P < 0.001, ****P < 0.0001. h, Cell count of H3K27MPP in methionine-depleted conditions comparing the cells incubated in dox and cells removed from dox conditions. Experiments were performed in biological triplicate. Statistical analysis was performed on day 5. (H3K27MPP dox removed + MR versus H3K27MPP + dox + MR ***P = 0.0002). Experiments were performed in biological triplicate (c,d). Statistical test was an unpaired, two-tailed t-test and data are represented as mean ± s.e.m. (e,g,h).
Fig. 4 |
Fig. 4 |. MAT2A expression is lower in DIPGs.
a, Oncoprint visualizing MTAP deletion in adult GBM (TCGA PanCancer Atlas) and PHGG dataset (ICR London). Data were generated using the PedcBioPortal,. b, Quantitative western blotting of proteins involved in methionine metabolism in DMG, PHGG, aGBM and control cells. This experiment was performed in biological duplicate. c, Quantification of western blots using LI-COR fluorescent secondary antibodies with the LI-COR Odyssey Clx Imaging System. Quantification was performed in the linear range through Image Studio Lite (v.5.2). Healthy brain n = 2, GBM n = 5 and DIPG n = 5. Biological samples were measured three times and the average intensity was plotted for each biological replicate. Healthy brain versus DIPG *P = 0.0447; P > 0.05 not shown. dg, MS-based quantification of SAM (d) and SAH (f) across DMG, HGG and control cells. DIPG04 SAH was below the detectable threshold and designated as not detected (ND). Comparison of mean quantifications of SAM (e) between three DMG and five HGG cell lines (n = 6 biological replicates/cell line) (****P ≤ 0.0001). Comparison of mean quantifications of SAH between DMG and HGG groups (g). Statistical analysis was performed on five GBM cell lines and two DIPG cell lines (n = 6 biological replicates per cell line; ****P < 0.0001). h,i, Ratio of SAM/SAH in DMG, HGG and control cells (h). Comparison of mean SAM/SAH ratio between five GBM cell lines and two DIPG cell lines (n = 6 biological replicates per cell line) (****P < 0.0001) (i). j,k, Quantitative western blot of NHAs expressing wild-type, H3.3 G34R (hemispheric pHGG histone mutation) or H3K27M mutations (j). Quantification of western blots using Li-Cor fluorescent system of j (k). Samples were repeatedly measured in technical triplicates. l, Western blot of MAT2A in CRISPR-corrected H3K27M KO DIPG04 versus K27M control. Quantification of western blots using LI-COR fluorescent system (bottom). n = 3 biological replicates. Biological samples were measured three times and the average intensity was plotted for each biological replicate (****P < 0.0001). m, C13 labeling of methionine with respective isotope derivatives. n, Ratio of SAM/SAH derived from C13 methionine labeling flux analysis of CRISPR-corrected DIPG04 versus DIPG04 control. n = 3 biological replicates for each cell line (K27M versus K27MKO at 4 h ***P = 0.0002; and K27M versus K27MKO 24 h *P = 0.0471). *P < 0.05, **P < 0.01, ***P < 0.001. Box and whiskers are defined by the center line denoting the median and the lower and upper ends of the box denote the 25th and 75th percentiles, respectively (e,g,i). The whiskers indicate the maximum and the minimum values of the data distribution. Statistical analysis was performed using an unpaired, two-tailed t-test (c,e,g,i,l,n). Data are displayed as mean ± s.e.m. (c,d,f,h,l,n).
Fig. 5 |
Fig. 5 |. Silencing MAT2a inhibits patient-derived DIPG lines.
ac, Western blot confirming knockdown of MAT2A using dox-inducible shRNA. BT-245 (a), DIPG04 (b) and DIPG13p (c) cells were treated with dox for 120 h. df, Alamar blue, cell viability assay of BT-245 (d), DIPG04 (e) and DIPG13p (f) cells treated with or without dox (MAT2A knockdown). Cell growth was evaluated over 4 d. Experiments were performed in four biological replicates. BT-245 (shMAT2A01 versus shMAT2A01 + dox ****P = 0.000014) and (shMAT2A02 versus shMAT2A02 + dox ****P < 0.000001) (d). DIPG04 (shMAT2A01 versus shMAT2A01 + dox ****P = 0.000067) and (shMAT2A02 versus shMAT2A02 + dox ****P < 0.000001) (e). DIPG13p (shMAT2A01 versus shMAT2A01 + dox ****P = 0.000032) and (shMAT2A02 versus shMAT2A02 + dox ****P < 0.000001) (f). g, MS-based quantification of SAM between control and MAT2A knockdown cells. n = 3 biological replicates for each condition (DIPG04 versus DIPG04 MAT2A knockdown ****P < 0.0001; DIPG13p versus DIPG13p MAT2A knockdown ****P < 0.0001; and BT-245 versus BT-245 MAT2A knockdown ****P < 0.0001). h, Comparison of mean EC50 values across DMG, HGG/GBM-MTAP-deleted and wild-type (WT) cell lines (n = 5 GBM-MTAP+/+, n = 3 GBM-MTAP−/−, n = 3 DIPG). Statistical analysis was performed using two-tailed Mann–Whitney U-test. Data are displayed as mean ± s.e.m. (HGG/GBM MTAP+/+ versus DIPG *P = 0.0357; P > 0.05 not displayed). i,j, Western blot of DMG cell lines expressing MAT2A–FLAG DIPG04 (i) and BT-245 (j). k,l, Cell count of DMG cell lines expressing MAT2A–FLAG DIPG04 (k) and BT-245 (l). Experiments performed were in biological triplicate. Statistical analysis was performed at day 5 (DIPG04–EV versus DIPG04–MAT2A–FLAG ***P = 0.000121 (k) and BT-245-EV versus BT-245–MAT2A–FLAG ***P = 0.000325 (l)). m, MAT2A inhibitor (AGI-24512) dose–response of DMG cell lines, DIPG04 and BT-245 expressing MAT2A–FLAG compared to control lines. Experiments were performed in biological sextuplicate. Data are displayed as mean ± s.e.m. n, Comparison of EC50 values of DMG cell lines, DIPG04 and BT-245 expressing MAT2A–FLAG compared to isogenic controls. Experiments were performed in biological quadruplicate (DIPG04–EV versus DIPG04–MAT2A–FLAG ****P < 0.0001; and BT-245–EV versus BT-245–MAT2A–FLAG **P = 0.0013). *P < 0.05, **P < 0.01, ***P < 0.001, ****P < 0.0001. Western blots were performed in biological triplicate (ac,i,j). Statistical analysis was performed using a two-tailed, unpaired t-test (dg,k,l,n). Data are displayed as mean ± s.e.m.
Fig. 6 |
Fig. 6 |. AMD1 Downregulates MAT2a.
a, Distribution of z-scored H3K27me3 fold change in DMG cell lines versus isogenic CRISPR-corrected H3K27MKO, DIPG13p and BT-245. b, Integrated genomics viewer output of H3K27me3 ChIP-seq data at the AMD1 locus in H3K27M lines and isogenic lines with H3K27M KO. c, Western blotting of several components of methionine metabolism in DMG, PHGG, aGBM and control cells. d, Proposed hypothesis of MAT2A-reduced protein expression via AMD1 and dcSAM. eh, Quantitative western blotting of MAT2A and C-MYC in AMD1 knockdown BT-245 (e) and DIPG04 (g). Quantification of MAT2A using Li-Cor fluorescent system in AMD1 knockdown (f) BT-245 and (h) DIPG04. n = 3 Biological replicates and samples were repeatedly measured three times. Statistical analysis was performed using a one-way analysis of variance (ANOVA) followed by a one-sided Tukey’s multiple comparison test. Data are displayed as mean ± s.e.m. (shAMD1_01 **Adjusted P = 0.0072, shAMD1_02 *Adjusted P = 0.0145) (f) and shAMD1_01 **Adjusted P = 0.0074, shAMD1_02 **Adjusted P = 0.0051 (h); adjusted P > 0.05 not displayed). i. Cell count in DMG lines BT-245 cells with AMD1 knockdown, days 1, 3 and 5. Experiments were performed in biological triplicate. Statistical analysis was performed on day 5 (NS versus shAMD1 01 ***P = 0.00028; and NS versus shAMD1 02 ***P = 0.000211). NS, non-silencing siRNA. j, Percentage of apoptotic cells in BT-245 cells lines with AMD1 knockdown, days 3 and 5. Experiments were performed in biological triplicate. Statistical analysis was performed at day 3 and 5 (shAMD1_01 day 3 **P = 0.002111, shAMD1_01 day 5 **P = 0.001757; and shAMD1_02 day 3 **P = 0.008581, shAMD1_02 day 5 **P = 0.001322). k, Cell count in DMG lines DIPG04 with AMD1 KD, days 3 and 5. Experiments were performed in biological triplicate. Statistical analysis was performed on day 5 (NS versus shAMD1 01 ****P = 0.000015; and NS versus shAMD1 02 ****P = 0.000009). l, Percentage of apoptotic cells in DIPG04 cells with AMD1 KD, days 3 and 5 (P < 0.001). Experiments were performed in biological triplicate. Statistical analysis was performed at day 3 and 5 (shAMD1_01 day 3 *P = 0.011056, day 5 **P = 0.001193; and shAMD1_02 day 3 *P = 0.031126, day 5 **P = 0.008023). *P < 0.05, **P < 0.01. m, Dose–response of DMG cells, BT-245, DIPG04 and NSC cells treated with AMD1 inhibitor. EC50 values in BT-245, DIPG04 and NSC (top). Experiments were performed in biological sextuplicate. Data are displayed as mean ± s.e.m. n,o, Quantitative western blotting of MAT2A with escalating doses of AMD1 inhibitor BT-245 (n) and DIPG04 (o). p,q, Quantification of MAT2A using Li-Cor fluorescent system in BT-245 (p) and DIPG04 (q) technical replicates of n = 3, samples were measured repeatedly three times. Statistical analysis was performed using a two-tailed, unpaired t-test (il). Data are displayed as mean ± s.e.m. DMSO, dimethylsulfoxide.
Fig. 7 |
Fig. 7 |. Silencing MAT2a alters the transcriptome and H3K36me3 deposition.
a, Quantitative western blotting of histone modifications (H3K4me3 and H3K36me3) and SDMA in DIPG13p cells comparing MAT2A knockdown to control cells. b, Quantification of histone modifications (H3K4me3 and H3K36me3), SDMA and MAT2A using Li-Cor fluorescent system for DIPG13p cells, MAT2A knockdown versus control cells. Experiments were performed in biological triplicate; samples were repeatedly measured three times. Statistical analysis was performed using a two-tailed, unpaired t-test. Data displayed as mean ± s.e.m. (no dox versus MAT2A knockdown H3K4me3 **P = 0.008283; H3K36me3 ***P = 0.000501; MAT2A ***P = 0.000103; and SDMA **P = 0.00792). c, Volcano plot of differential gene expression comparing MAT2A knockdown to control cells. Canonical neuronal markers are highlighted in red (upregulated) and blue (downregulated). Statistical adjustments were made for multiple comparisons using iDEP.94 DESeq2 Statistical packages in R. d, Top ten gene sets (GO), derived from GSEA analysis of changes to the transcriptome in MAT2A knockdown. e, Heat map of top ten negative and positive enriching developmental cell signatures in MAT2A knockdown. f, Enrichment plots of selected developmental cell signatures from e. g, Real-time PCR validation of selected canonical neurogenesis genes and markers of oligodendrocyte cells. n = 3 technical triplicates for each gene. h, Heat map of spike-in normalized H3K36me3 ChIP-Rx-seq reads centered at human genes in no dox (top) versus dox (bottom) induction of MAT2A shRNA expression in DIPG13p cells. TSS, (Transcription Start Site); TES, (Transcription End Site). i, Bar plots of H3K36me3 ChIP-Rx-seq reads demonstrating alterations of H3K36me3 at different regions summarized across all human genes in DIPG13p cells. j, Venn diagram of overlapping genes between ChIP-Rx-seq and RNA-seq data. k, Plot of H3K36me3 (fold change) versus RNA-seq (fold change), neurogenesis makers are indicated.
Fig. 8 |
Fig. 8 |. MAT2A depletion or MR impedes DIPG growth in vivo.
a, Kaplan–Meier survival curve showing that MR increases survival of the H3K27MPP DMG model. Kaplan–Meier survival curve of H3K27MPP cells injected into the midbrain-pons of immunocompetent C57BL/6 mice. A log-rank Mantel–Cox test was performed between the groups with n = 7 mice per group (4 male and 3 female). ***P = 0.0003. A post hoc power estimation based on the sample size with a two-sided α of 0.05 provided a >0.99 power. b, H&E and Ki67 staining confirming high-grade glioma histology from H3K27MPP-injected mice. c, Ki67 quantification confirming loss of Ki67-positive cells from H3K27MPP tumors on low-methionine diet compared to control chow. Ki67 indices were calculated from three animals per group with each index being an average of five high-magnification field of views (control versus low-methionine diet **P = 0.003). d, Quantification of SAM concentrations in H3K27MPP tumors on a low-methionine diet compared to control chow (n = 3 tumors per group; control versus low-methionine diet **P = 0.0062). e. Western blotting of MAT2A, OLIG2, H3K36me3 and LAMIN in H3K27MPP tumors from control and low-methionine diets. f, Quantification of MAT2A and OLIG2 normalized to β-actin and H3K36me3 normalized to LAMIN from e from three independent western blots comparing H3K27MPP tumors on control diet versus a low-methionine diet (control versus MR MAT2A ***P = 0.000955; OLIG2 ***P = 0.000236; and H3K36me3 ***P = 0.000118). g, In vivo orthotopic DIPG13p xenograft with control, MAT2A knockdown (+ dox) or DIPG13p xenografts put on a low-methionine data. A log-rank Mantel–Cox test was performed between the groups with n = 5 mice per group (5 female) (control versus MAT2A knockdown **P = 0.0019) and (control versus low-methionine diet **P = 0.0019). A post hoc power estimation based on the sample size with a two-sided α of 0.05 provided: control versus MAT2A knockdown 0.995 power and control versus low methionine, 0.991 power. h. H&E and MAT2A immunohistochemistry (IHC). I. Proposed model of compromised MAT2A function in DIPG compared to healthy cells. Statistical analysis was performed using a two-tailed, unpaired t-test (c,d,f). Data are displayed as mean ± s.e.m.

References

    1. Louis DN et al. The 2021 WHO classification of tumors of the central nervous system: a summary. Neuro-oncology 10.1093/neuonc/noab106 (2021). - DOI - PMC - PubMed
    1. Hoffman LM et al. Clinical, radiologic, pathologic, and molecular characteristics of long-term survivors of diffuse intrinsic pontine glioma (DIPG): a collaborative report from the International and European Society for Pediatric Oncology DIPG registries. J. Clin. Oncol 36, 1963–1972 (2018). - PMC - PubMed
    1. Warren KE Diffuse intrinsic pontine glioma: poised for progress. Front. Oncol 2, 205 (2012). - PMC - PubMed
    1. Sturm D et al. Hotspot mutations in H3F3A and IDH1 define distinct epigenetic and biological subgroups of glioblastoma. Cancer Cell 22, 425–437 (2012). - PubMed
    1. Ostrom QT et al. CBTRUS statistical report: primary brain and central nervous system tumors diagnosed in the United States in 2008–2012. Neuro-oncology 17, iv1–iv62 (2015). - PMC - PubMed

Publication types