. 2022 Apr 5:2022:5031806.
doi: 10.1155/2022/5031806. eCollection 2022.

Exploring the Effects of Prescribed Fire on Tick Spread and Propagation in a Spatial Setting

Affiliations

Exploring the Effects of Prescribed Fire on Tick Spread and Propagation in a Spatial Setting

Alexander Fulk et al. Comput Math Methods Med. .

Abstract

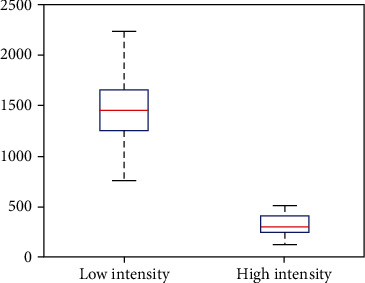
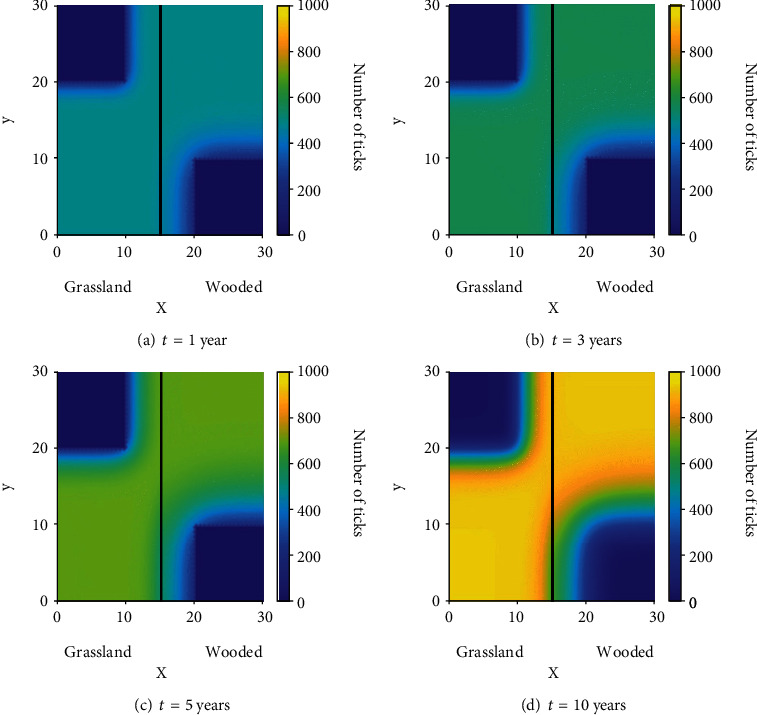
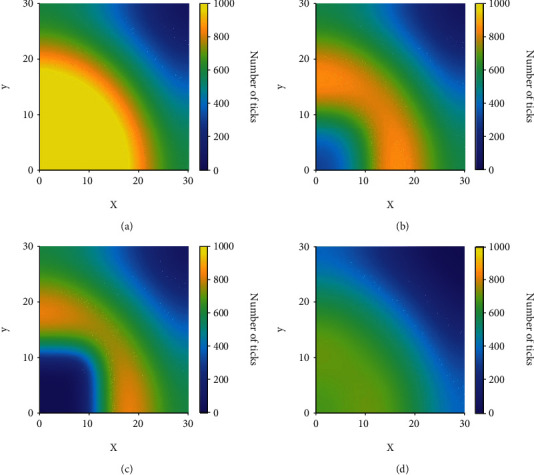
Lyme disease is one of the most prominent tick-borne diseases in the United States, and prevalence of the disease has been steadily increasing over the past several decades due to a number of factors, including climate change. Methods for control of the disease have been considered, one of which is prescribed burning. In this paper, the effects of prescribed burns on the abundance of ticks present in a spatial domain are assessed. A spatial stage-structured tick-host model with an impulsive differential equation system is developed to simulate the effect that controlled burning has on tick populations. Subsequently, a global sensitivity analysis is performed to evaluate the effect of various model parameters on the prevalence of infectious nymphs. Results indicate that while ticks can recover relatively quickly following a burn, yearly, high-intensity prescribed burns can reduce the prevalence of ticks in and around the area that is burned. The use of prescribed burns in preventing the establishment of ticks into new areas is also explored, and it is observed that frequent burning can slow establishment considerably.


Conflict of interest statement

The authors declare that there are no conflicts of interest.

Figures

Figure 1
Figure 1
The flow diagram for model (8).
Figure 2
Figure 2
The partial rank correlation coefficients for the parameters for (a) low-intensity burns and (b) high-intensity burns. Values significantly greater or less than zero indicate parameters that have the greatest impact on model outcome (number of infectious nymphs).
Figure 3
Figure 3
Distribution of the total number of infectious nymphs using the parameters created from the LHS. This graph displays the distribution of those totals via a boxplot. The median is shown as the red bar within the box. The upper and lower quartiles are the upper and lower portions of the box, respectively. Finally, the maximum and minimums for low and high intensity are displayed at the ends of the upper and lower dashed lines, respectively.
Figure 4
Figure 4
The distribution of infectious nymphs in a homogeneous domain at various times.
Figure 5
Figure 5
Simulation of model (8) for different numbers of burns and time between burns. (a) The number of burns performed yearly starting at t = 1 vs. the percentage of ticks that remain after a 10-year simulation. (b) The number of the years between burns vs. the percentage of ticks that remain after a 10-year simulation.
Figure 6
Figure 6
Scenario 1: the percentage of the number of infectious nymphs remaining in the burned area after 10 years of yearly, high-intensity burns is plotted against the patch size.
Figure 7
Figure 7
The distribution of infectious nymphs in a heterogeneous domain at various times.
Figure 8
Figure 8
The distribution of infectious nymphs for Scenario 3 without prescribed fire at various times.
Figure 9
Figure 9
The distributions of infectious nymphs at t = 20 years for Scenario 3 with different burning patterns. (a) No burns. (b) Burning implemented every 5 years. (c) 10 years of no burning followed by yearly burning for the remaining decade. (d) Yearly burning implemented for the first 10 years and no burns later.

References

    1. Rosenberg R., Lindsey N., Fischer M., et al. Vital signs: trends in reported vectorborne disease cases-United States and territories, 2004–2016. Morbidity and Mortality Weekly Report (MMWR) . 2018;67(17):496–501. doi: 10.15585/mmwr.mm6717e1. - DOI - PMC - PubMed
    1. Stone B. L., Tourand Y., Brissette C. A. Brave new worlds: the expanding universe of Lyme disease. Vector-Borne and Zoonotic Diseases . 2017;17(9):619–629. doi: 10.1089/vbz.2017.2127. - DOI - PMC - PubMed
    1. CDC. Signs and Symptoms of Untreated Lyme Disease . https://www.cdc.gov/lyme/signs_symptoms/index.html .
    1. Vuong H. B., Canham C. D., Fonseca D. M., et al. Occurrence and transmission efficiencies of _Borrelia burgdorferi ospC_ types in avian and mammalian wildlife. Infection, Genetics and Evolution . 2014;27:594–600. doi: 10.1016/j.meegid.2013.12.011. - DOI - PMC - PubMed
    1. Hotaling T. Prevalence of Tick-Borne Pathogens in Small Mammals and White-Tailed Deer in Southeast Nebraska . the University of Nebraska; 2015.