. 2021 Feb 1;11(10):5491-5505.
doi: 10.1039/d0ra00343c. eCollection 2021 Jan 28.

Identification of key lipid metabolites during metabolic dysregulation in the diabetic retinopathy disease mouse model and efficacy of Keluoxin capsule using an UHPLC-MS-based non-targeted lipidomics approach

Affiliations

Identification of key lipid metabolites during metabolic dysregulation in the diabetic retinopathy disease mouse model and efficacy of Keluoxin capsule using an UHPLC-MS-based non-targeted lipidomics approach

Nan Ge et al. RSC Adv. .

Abstract

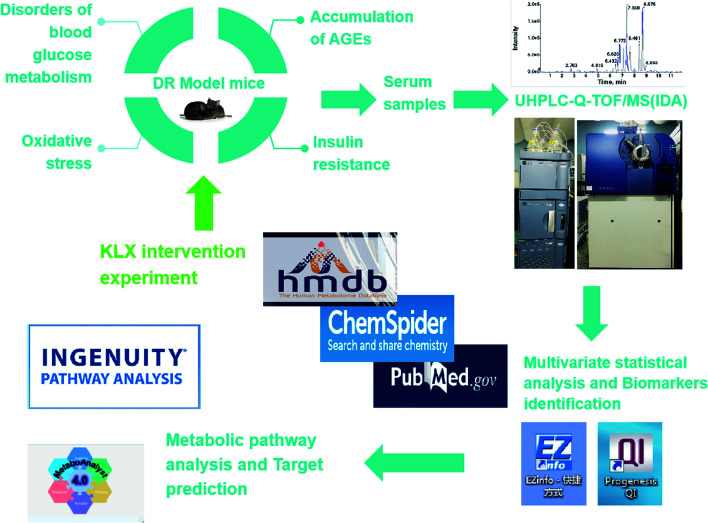
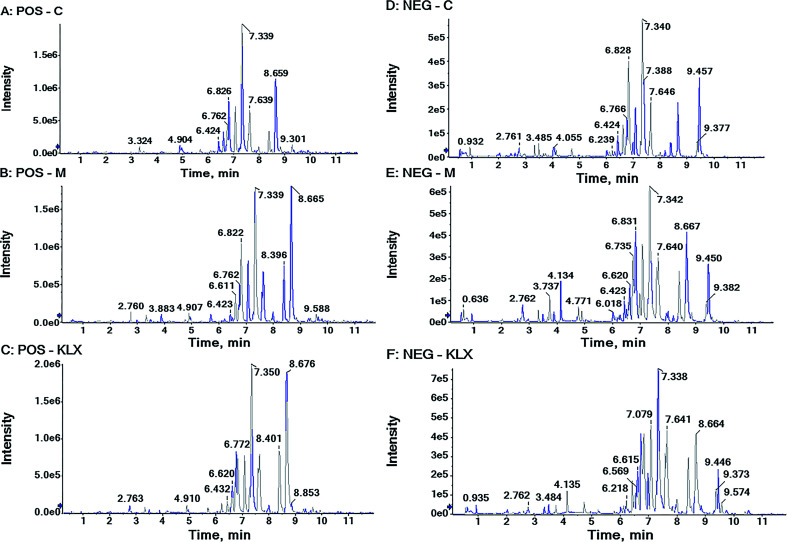
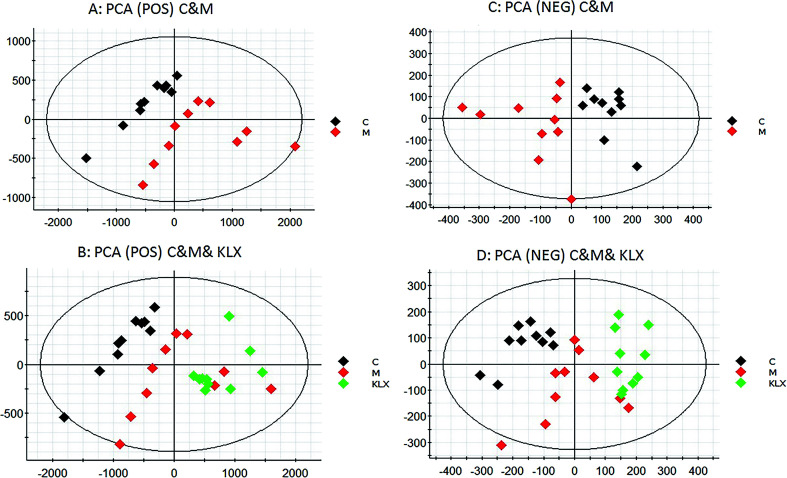
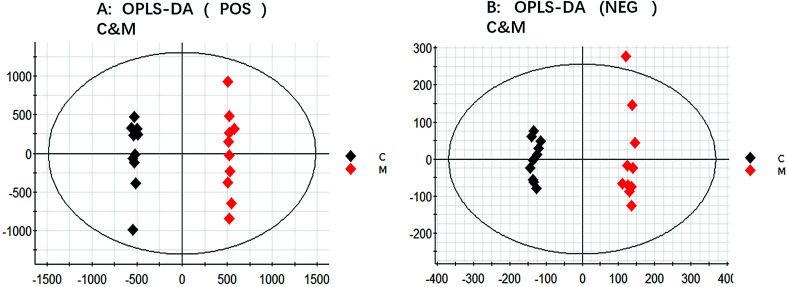
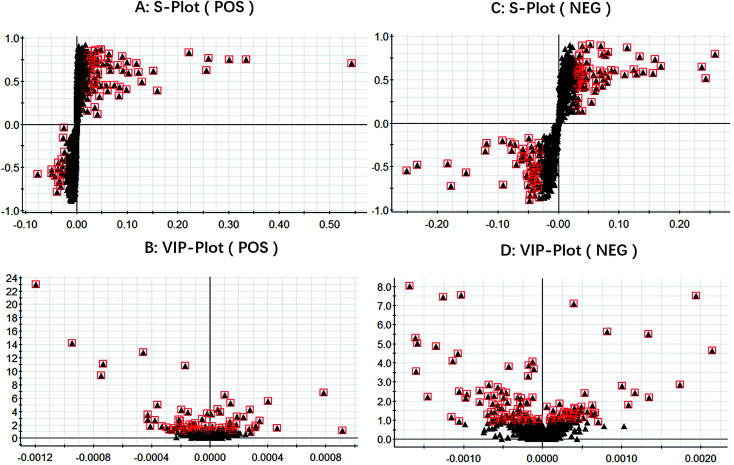
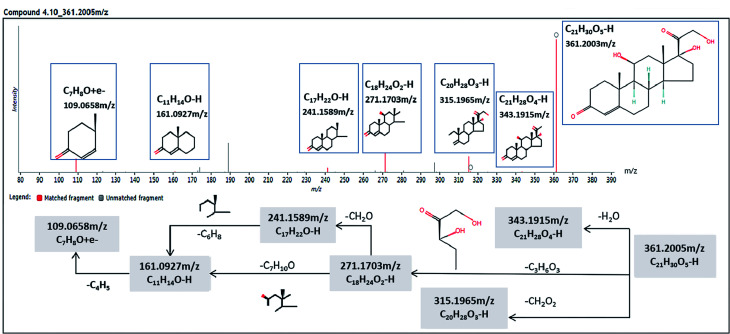
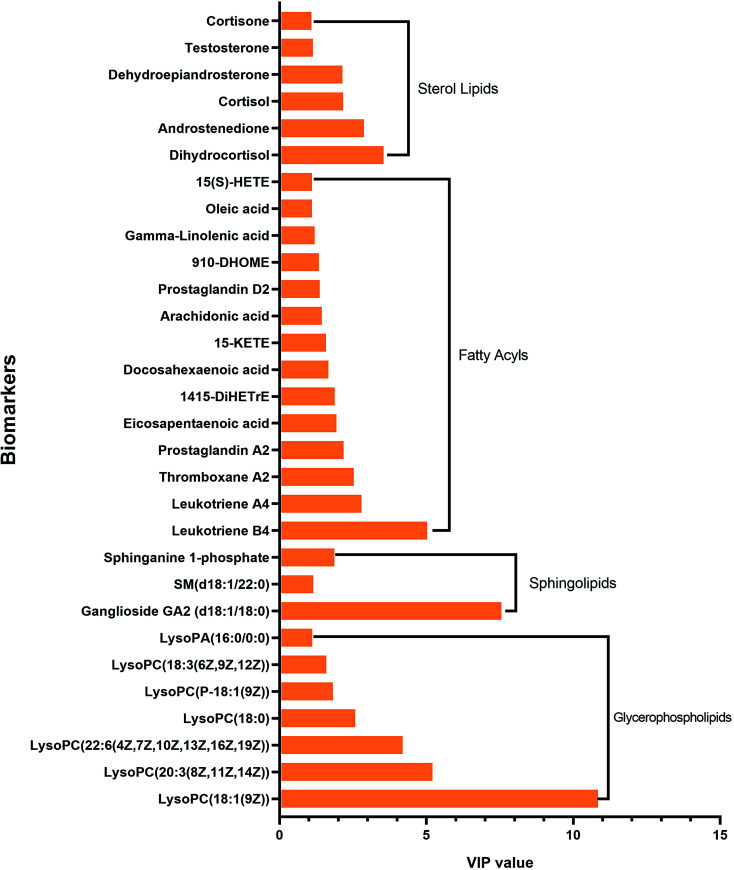
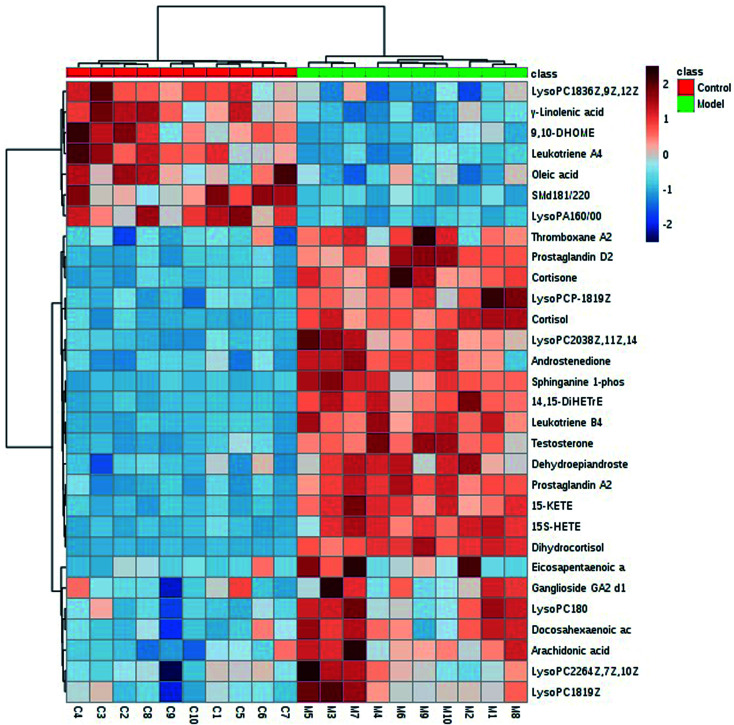
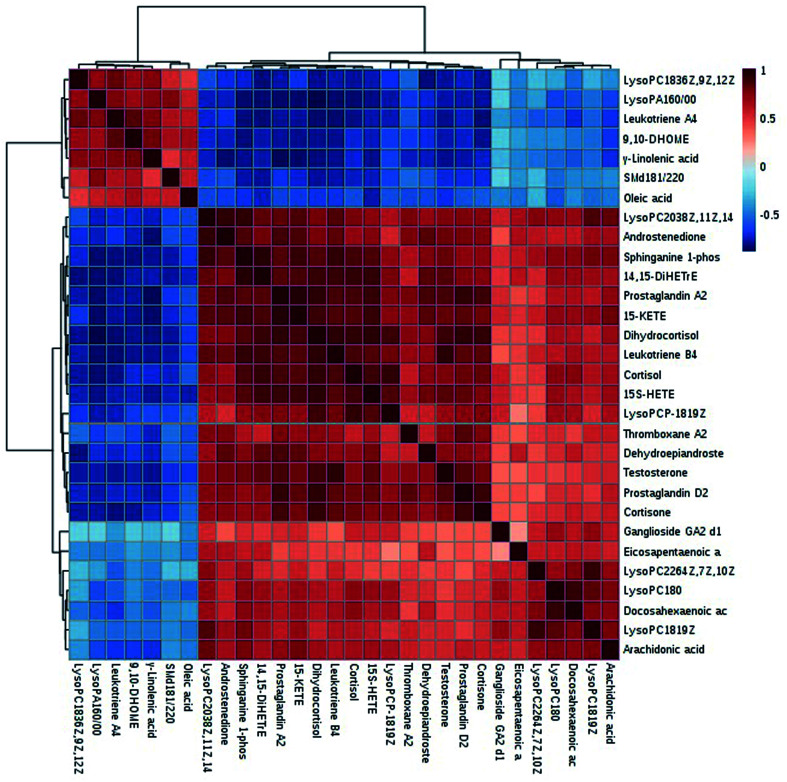
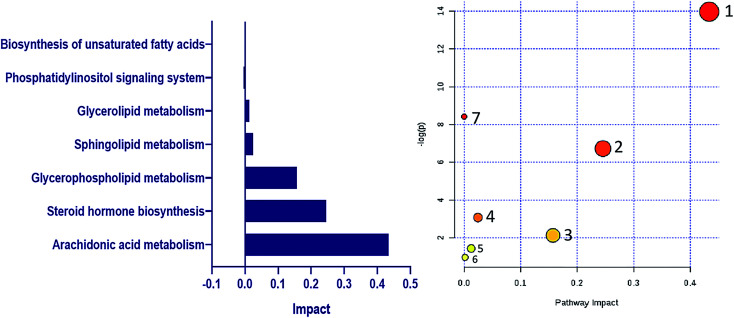
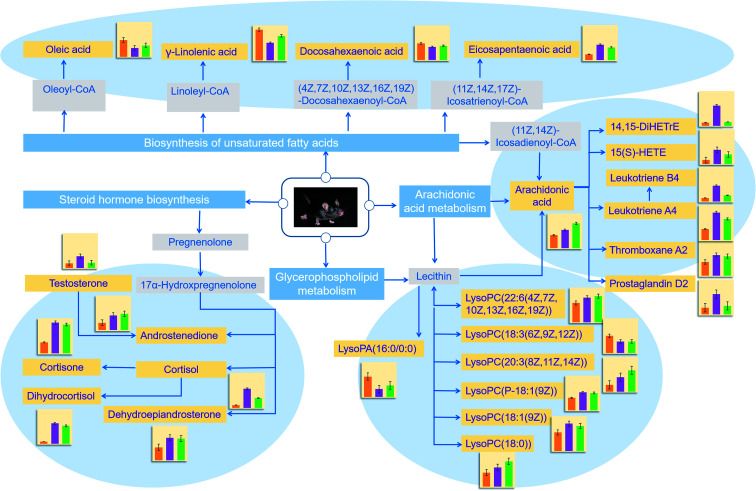
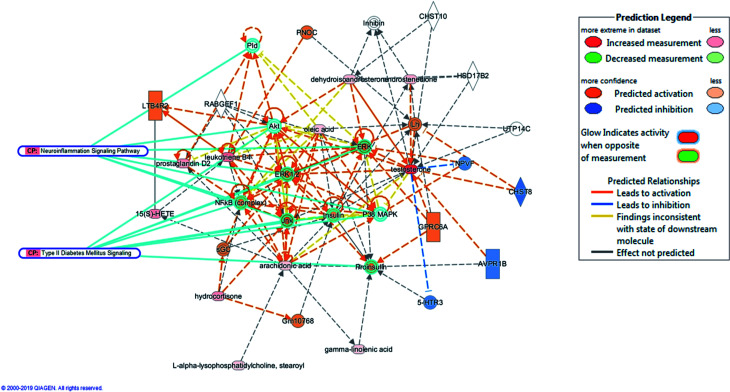
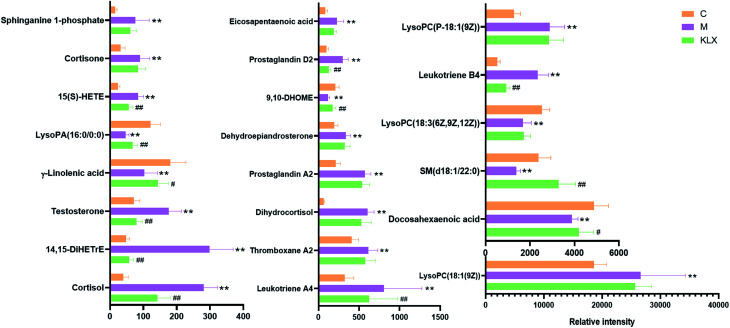
Diabetic retinopathy (DR) is an important complication of diabetes, and is currently the main cause of blindness among young adults in the world. Previous studies have shown that Keluoxin (KLX) capsules have a significant effect on DR in C57BL/KsJ/db-/- mice (db/db mice), however the unclear mechanism limits its further clinical application and actual value. Further research is urgently needed for the treatment of DR disease. Discovery of key lipid biomarkers and metabolic pathways can reveal and explore the molecular mechanisms related to DR development and discover the effect of Keluoxin (KLX) capsule against DR in db/db mice. Lipidomics has been used for characterizing the pathological conditions via identification of key lipid metabolites and the metabolic pathway. In this study, the high-throughput lipidomics using UHPLC-Q-TOF/MS combined with multivariate statistical analysis, querying multiple network databases and employing ingenuity pathway analysis (IPA) method for molecular target prediction. A total of 30 lipid biomarkers were identified and 7 metabolic pathways including arachidonic acid metabolism and steroid hormone biosynthesis were found. The preventive effect of KLX intervention can regulate 22 biomarkers such as LysoPA(16:0/0:0), prostaglandin D2, cortisol and γ-linolenic acid, etc. IPA platform has predicted that PI3K/MAPK pathway are closely related to DR development. It also showed that high-throughput lipidomics combined with multivariate statistical analysis could deep excavate of the biological significance of the big data, and can provide molecular targets information about the disease treatment.


Conflict of interest statement

There are no conflicts to declare.

Figures

Fig. 1
Fig. 1. An overview of the experimental methods in this study.
Fig. 2
Fig. 2. The BPI chromatograms of plasma samples from control group (C), model group (M) and KLX intervention group (KLX), acquired by UHPLC-Q-TOF/MS (IDA) in positive and negative ion mode.
Fig. 3
Fig. 3. The principal component analysis (PCA) of control group (C), model group (M) in both positive and negative ion modes (A and C). The principal component analysis (PCA) of control group (C), model group (M) and KLX intervention group (KLX) in both positive and negative ion modes (B and D).
Fig. 4
Fig. 4. The orthogonal partial least squares discriminant analysis (OPLS-DA) of control group (C), model group (M) in both positive and negative ion modes (A and B).
Fig. 5
Fig. 5. The S-plot in both positive and negative ion modes (A and C). The VIP-plot in both positive and negative ion modes (B and D). Each black triangle represents a substance, and the substances circled in the red squares represent a large contribution to distinguishing different groups.
Fig. 6
Fig. 6. Chemical structure and the mass fragment information of cortisol (compound 4.10_361.2005 m/z), identified as the DR biomarker in negative ion mode. The precise molecular mass and the fragments were detected by a mass spectrometer (UHPLC-Q-TOF/MS(IDA)) and determined within a reasonable degree of measurement error (<5 ppm).
Fig. 7
Fig. 7. Classification of biomarkers and VIP (Variable Importance for the Projection-plot) values output by EZinfo 3.0 software through statistical analysis.
Fig. 8
Fig. 8. A heat map of the relative intensity of the biomarkers in the control group (C) and the model group (M).
Fig. 9
Fig. 9. A heat map of the correlation analysis among the 30 identified biomarkers related to DR.
Fig. 10
Fig. 10. DR-related lipid metabolic pathway information. (A) Impact value of DR-related lipid metabolism pathways. (B) DR-related lipid metabolic pathway information derived from MetaboAnalyst: 1. arachidonic acid metabolism; 2. steroid hormone biosynthesis; 3. glycerophospholipid metabolism; 4. sphingolipid metabolism; 5. glycerolipid metabolism; 6. phosphatidylinositol signaling system; 7. biosynthesis of unsaturated fatty acids.
Fig. 11
Fig. 11. Map of lipid metabolism pathways mainly related to DR. The blue box is the name of the main pathway; the orange box is the biomarker we identified; and the gray box is the important upstream substance associated with the identified biomarker in the pathway; the changes in the intensity of biomarkers in the control group (yellow) and model group (purple) in the KLX intervention group (green) are indicated next to the histogram; the blue arrows indicate the mutual relationship between the substances.
Fig. 12
Fig. 12. Results of analysis of biomarkers by IPA (Ingenuity Pathway Analysis) software.
Fig. 13
Fig. 13. The relative intensity of biomarkers called back by KLX intervened. *Stands for significant difference compared by control group (C) and model group (p < 0.05). ** Stands for very significant difference compared by control group (C) and model group (M) (p < 0.01). # Stands for significant difference compared by model group (M) and KLX intervention group (KLX) (p < 0.05). ## Stands for very significant difference compared by model group (M) and KLX intervention group(KLX) (p < 0.01).

Similar articles

Cited by

References

    1. Cui Y. Zhu Y. Wang J. C. et al. Imaging Artifacts and Segmentation Errors With Wide-Field Swept-Source Optical Coherence Tomography Angiography in Diabetic Retinopathy. Transl. Vis. Sci. 2019;8(6):18. doi: 10.1167/tvst.8.6.18. - DOI - PMC - PubMed
    1. Newsholme P. Cruzat V. F. Keane K. N. et al. Molecular mechanisms of ROS production and oxidative stress in diabetes. Biochem. J. 2016;473(24):4527–4550. doi: 10.1042/BCJ20160503C. - DOI - PubMed
    1. Panigrahy S. K. Bhatt R. Kumar A. Reactive oxygen species: sources, consequences and targeted therapy in type 2 diabetes. J. Drug Targeting. 2017;25(2):93–101. doi: 10.1080/1061186X.2016.1207650. - DOI - PubMed
    1. Assar M. E. Angulo J. Rodríguez-Mañas L. Diabetes and ageing-induced vascular inflammation. J. Physiol. 2016;594(8):2125–2146. doi: 10.1113/JP270841. - DOI - PMC - PubMed
    1. Sheela D. L. Nazeem P. A. Narayanankutty A. et al. Coconut phytocompounds inhibits polyol pathway enzymes: Implication in prevention of microvascular diabetic complications. Prostaglandins Leukot. Essent. Fatty Acids. 2017;127:20–24. doi: 10.1016/j.plefa.2017.10.004. - DOI - PubMed