. 2021 Feb 15;11(13):7575-7586.
doi: 10.1039/d1ra00272d. eCollection 2021 Feb 10.

Fullerene translocation through peroxidized lipid membranes

Affiliations

Fullerene translocation through peroxidized lipid membranes

Gulsah Gul et al. RSC Adv. .

Abstract

Recent cytotoxicity research suggests that fullerenes can enter the cell and cross the blood-brain barrier. However, the underlying toxicity mechanism behind the penetration of fullerenes through biological membranes is still not well understood. Here we perform coarse-grained molecular dynamics simulations to investigate the interactions of fullerenes and their polar derivatives (Janus) with model regular and peroxidized bilayers. We show that the translocation of fullerenes and their residence time in bulk water vary depending on the bilayer's peroxidation degree and fullerene polarity. The distribution of fullerenes inside the bilayer is mainly determined by the peroxidation degree and the saturation level of lipid acyl chains. The transport of pristine fullerenes through bilayers occurs at nano timescale while the complete diffusion may not be achieved for Janus fullerenes in micro timescale. As for the toxic response of fullerenes in terms of membrane damage, no mechanical disruption of model bilayers is observed throughout the studied simulation times.


Conflict of interest statement

The authors declare no competing financial interest.

Figures

Fig. 1
Fig. 1. MARTINI representation of (a) POPC, DOPC and their oxidized analogs POBU and DOBU, (b) fullerene molecules.
Fig. 2
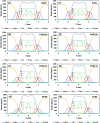
Fig. 2. Density distribution profiles of lipid head (NC3 & PO4 beads), linker (GL1 & GL2 beads), and tail groups together with water, ion and pristine fullerenes (enlarged in insets), (a–d) for DOPC and its oxidized forms, (e–h) for POPC and its oxidized forms at fullerene to lipid ratio of F/L = 10/512.
Fig. 3
Fig. 3. Density distribution profiles of lipid head (NC3 & PO4 beads), linker (GL1 & GL2 beads), and tail groups together with water, ion and Janus fullerenes (enlarged in insets), (a–d) for DOPC and its oxidized forms, (e–h) for POPC and its oxidized forms at fullerene to lipid ratio of F/L = 10/512.
Fig. 4
Fig. 4. PMF for systems with a single pristine fullerene and model bilayers as a function of the distance between their centers of mass.
Fig. 5
Fig. 5. The absolute center-of-mass distance of pristine fullerene NP from (a) DOPC, (b) DOBU, (c) POPC and (d) POBU bilayers, respectively. The two dashed lines in blue denote the bilayer thickness in terms of the distance of PO4 beads between upper and lower leaflet in the corresponding bilayer. The center dashed line in black shows the center of the corresponding bilayer. The times on the upper right of the graphs represent the time fullerene spends in bulk water before entering the corresponding bilayer. The circular pictures demonstrate the average position of fullerene after entering the bilayer (taken from trajectories at 175 ns, 53 ns, 95 ns, and 44 ns for DOPC, DOBU, POPC and POBU bilayers).
Fig. 6
Fig. 6. The absolute center-of-mass distance of Janus fullerene NP from (a) DOPC, (b) DOBU, (c) POPC and (d) POBU bilayers, respectively. The two dashed lines in blue denote the bilayer thickness in terms of the distance of PO4 beads between upper and lower leaflet in the corresponding bilayer. The center dashed line in black shows the center of the corresponding bilayer. The times on the upper right of the graphs represent the time fullerene spends in bulk water before entering the corresponding bilayer. The circular pictures demonstrate the average position of fullerene after entering the bilayer (taken from trajectories at 353 ns, 22 ns, 200 ns, and 105 ns for DOPC, DOBU, POPC and POBU bilayers).
Fig. 7
Fig. 7. Membrane–fullerene COM radial distribution functions for (a, b) pristine fullerenes, (c, d) Janus fullerenes at fullerene-to-lipid ratio of F/L = 10/512.
Fig. 8
Fig. 8. Fullerene–fullerene COM radial distribution functions for (a, b) pristine fullerenes, (c, d) Janus fullerenes (enlarged between 1.45–1.90 nm in insets) at fullerene-to-lipid ratio of F/L = 10/512.
Fig. 9
Fig. 9. The aggregate of (a) pristine fullerene molecules interact with DOBU30 bilayer at 358 ns and 370 ns, (b) Janus fullerene molecules interact with POPC bilayer at 3.53 μs and 3.56 μs from side view.

References

    1. Kroto H. W. Allaf A. W. Balm S. P. Chem. Rev. 1991;91:1213–1235. doi: 10.1021/cr00006a005. - DOI
    1. Collavini S. Delgado J. L. Sustainable Energy Fuels. 2018;2:2480–2493. doi: 10.1039/C8SE00254A. - DOI
    1. Zhang J. Terrones M. Park C. R. Mukherjee R. Monthioux M. Koratkar N. Kim Y. S. Hurt R. Frackowiak E. Enoki T. Chen Y. Chen Y. Bianco A. Carbon. 2016;98:708–732. doi: 10.1016/j.carbon.2015.11.060. - DOI
    1. Gust D. Moore T. A. Moore A. L. Acc. Chem. Res. 2001;34:40–48. doi: 10.1021/ar9801301. - DOI - PubMed
    1. Panwar N. Soehartono A. M. Chan K. K. Zeng S. Xu G. Qu J. Coquet P. Yong K. T. Chen X. Chem. Rev. 2019;119:9559–9656. doi: 10.1021/acs.chemrev.9b00099. - DOI - PubMed