. 2021 Feb 17;11(13):7527-7537.
doi: 10.1039/d0ra09844b. eCollection 2021 Feb 10.

Discovery of fragments inducing conformational effects in dynamic proteins using a second-harmonic generation biosensor

Affiliations

Discovery of fragments inducing conformational effects in dynamic proteins using a second-harmonic generation biosensor

Edward A FitzGerald et al. RSC Adv. .

Abstract

Biophysical screening of compound libraries for the identification of ligands that interact with a protein is efficient, but does typically not reveal if (or how) ligands may interfere with its functional properties. For this a biochemical/functional assay is required. But for proteins whose function is dependent on a conformational change, such assays are typically complex or have low throughput. Here we have explored a high-throughput second-harmonic generation (SHG) biosensor to detect fragments that induce conformational changes upon binding to a protein in real time and identify dynamic regions. Multiwell plate format SHG assays were developed for wild-type and six engineered single-cysteine mutants of acetyl choline binding protein (AChBP), a homologue to ligand gated ion channels (LGICs). They were conjugated with second harmonic-active labels via amine or maleimide coupling. To validate the assay, it was confirmed that the conformational changes induced in AChBP by nicotinic acetyl choline receptor (nAChR) agonists and antagonists were qualitatively different. A 1056 fragment library was subsequently screened against all variants and conformational modulators of AChBP were successfully identified, with hit rates from 9-22%, depending on the AChBP variant. A subset of four hits was selected for orthogonal validation and structural analysis. A time-resolved grating-coupled interferometry-based biosensor assay confirmed the interaction to be a reversible 1-step 1 : 1 interaction, and provided estimates of affinities and interaction kinetic rate constants (K D = 0.28-63 μM, k a = 0.1-6 μM-1 s-1, k d = 1 s-1). X-ray crystallography of two of the fragments confirmed their binding at a previously described conformationally dynamic site, corresponding to the regulatory site of LGICs. These results reveal that SHG has the sensitivity to identify fragments that induce conformational changes in a protein. A selection of fragment hits with a response profile different to known LGIC regulators was characterized and confirmed to bind to dynamic regions of the protein.


Conflict of interest statement

M. B. & T. Y. were employees of Biodesy, Inc.

Figures

Fig. 1
Fig. 1. Principle for mass independent detection of structural changes in biomolecules by SHG. (a) Affinity-tagged biomolecules are conjugated with an SH-active dye (blue) and tethered onto a lipid bilayer (orange) through either His-tag:Ni/NTA or biotinylated Avi-tag:avidin interactions. Incoming light at 800 nm (red arrow) is directed at the dye, which transforms two photons of this light into one photon of light with twice the energy (400 nm), the second-harmonic light (blue light). The intensity of this second harmonic light is highly dependent on the orientation of the dye with respect to the surface normal (Z-axis). Ligand-induced structural changes in the biomolecule alter the net dye orientation changing the SHG intensity, which is detected by the instrument (b) SHG signal change upon movement as depicted in (a) is reported as ΔSHG (%). A ligand can cause an increase (Ligand 1) or a decrease in signal (Ligand 2). (c) The signal change is reported as either an end point reading (shown here, e.g. 6 minutes after ligand injection) or as a time course.
Fig. 2
Fig. 2. Development and validation of an SHG assay for AChBP. (a) Schematic overview of assay workflow; (1) AChBP was labelled with an SH-active probe, (2) the labelled AChBP was tethered to an analysis plate and the baseline intensity was recorded (SHGB), (3) the ligand was injected, and the final intensity measurements recorded (SHGF). (b) Structure of wildtype AChBP in complex with lobeline (cyan) and labelled with SHG1-SE probe on K158 (red). Lobeline from PDB 5AFH was inserted into AChBP from PDB 1UW6, after alignment of the binding sites. (c) concentration response curves for a set of agonists (varenicline, epibatidine), a partial agonist (lobeline) and an antagonist (tubocurarine) of nAChR injected in a concentration series over an AChBP conjugate labelled on K158, demonstrating differences in the induced conformational changes. KD values were determined from the 8-point concentration series data by non-linear regression analysis and an equation specific to SHG-derived CRCs.
Fig. 3
Fig. 3. Engineered single cysteine mutants of AChBP. Visualisation of the mutated residues with (a) surface representation of complete pentamer shown in grey, (b) 90° degree rotation, (c) cartoon representation of (a), and (d) monomer of AChBP. The mutation sites are coloured as follows: C1 K98C (Blue), C2 K138C (yellow), C3 K178C (magenta), C4 K203C (cyan), C5 S206C (orange), C6 K33C (red). Note that each mutation gives rise to a total of five substitutions per pentamer. (AChBP structure from PDB 1UW6).
Fig. 4
Fig. 4. Screening of 1056-membered fragment library against AChBP variants. (a) Screening data for complete library and AChBP variants. The dotted lines around the x-axis represent the average ±3 SD for the WT negative control, compounds outside these lines are considered hits. Dashed lines show where there is a break in the y-axis, which uses two scales. Inset: screen control responses from varenicline, agonist (blue), tubocurarine, antagonist (cyan), and negative control (grey). (b) AChBP-WT screening data shown as ΔSHG for primary screen at 250 μM vs. secondary screen at 250 μM (left), and for secondary screen at 250 μM vs. 125 μM (right). (c) AChBP-C5 screening data shown as ΔSHG for primary screen at 250 μM vs. secondary screen at 250 μM (left), and for secondary screen at 250 μM vs. 125 μM (right). (d) Venn diagram illustrating hit rate and overlap across screened variants. (e) Summary of number of hits and hit rates (% of original library) for each AChBP variant.
Fig. 5
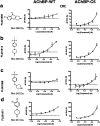
Fig. 5. Hit confirmation by follow-up with concentration response curves (CRCs). Fragments which overlapped between WT and C5 assays showing a clear dose dependency with time courses reaching steady state (ESI Fig. S2†) were selected for orthogonal validation compounds shown at a highest concentration of 250 μM in a two-fold concentration series in rows; (a) FL001856 (b) FL001913 (c) FL001888 (d) FL001971.
Fig. 6
Fig. 6. Validation of AChBP fragment hits from SHG assay using GCI biosensor-based interaction kinetic analysis. (a) FL001856, (b) FL001913, (c) FL001858, and (d) FL001971. (e) Kinetic parameters (ka, kd, and KD) were determined from the interaction kinetic curves for 10-point concentration series (up to125 μM) by global fitting using a 1 : 1 interaction kinetic model (a–d, blue lines). A steady state analysis was also performed and KD values estimated (see ESI, Fig. S5†).
Fig. 7
Fig. 7. Structures of complexes between fragment hits and AChBP. (a and b) Structure of the AChBP homopentamer (top and side views), and close up view of fragment binding at the orthosteric C-loop site at the interface of each monomer: (c) FL001856 (PDB: 7NDV), (d) FL001888 (PDB: 7NDP).

References

    1. Monod J. Wyman J. Changeux J. On the Nature of Allosteric Transitions. J. Mol. Biol. 1965;12:88–118. doi: 10.1016/S0022-2836(65)80285-6. - DOI - PubMed
    1. Hansen S. B. et al., Structures of Aplysia AChBP complexes with nicotinic agonists and antagonists reveal distinctive binding interfaces and conformations. EMBO J. 2005;24:3635–3646. doi: 10.1038/sj.emboj.7600828. - DOI - PMC - PubMed
    1. Purohit P. Auerbach A. Loop C and the mechanism of acetylcholine receptor-channel gating. J. Gen. Physiol. 2013;141:467–478. doi: 10.1085/jgp.201210946. - DOI - PMC - PubMed
    1. Verheij M. H. P. et al., Design, synthesis, and structure-activity relationships of highly potent 5-HT receptor ligands. J. Med. Chem. 2012;55:8603–8614. doi: 10.1021/jm300801u. - DOI - PMC - PubMed
    1. Ulens C. et al., Use of acetylcholine binding protein in the search for novel alpha7 nicotinic receptor ligands. In silico docking, pharmacological screening, and X-ray analysis. J. Med. Chem. 2009;52:2372–2383. doi: 10.1021/jm801400g. - DOI - PubMed