Review
. 2022 Feb 16;12(10):5891-5909.
doi: 10.1039/d1ra08401a.

Identifying surface degradation, mechanical failure, and thermal instability phenomena of high energy density Ni-rich NCM cathode materials for lithium-ion batteries: a review

Affiliations
Review

Identifying surface degradation, mechanical failure, and thermal instability phenomena of high energy density Ni-rich NCM cathode materials for lithium-ion batteries: a review

Fikadu Takele Geldasa et al. RSC Adv. .

Abstract

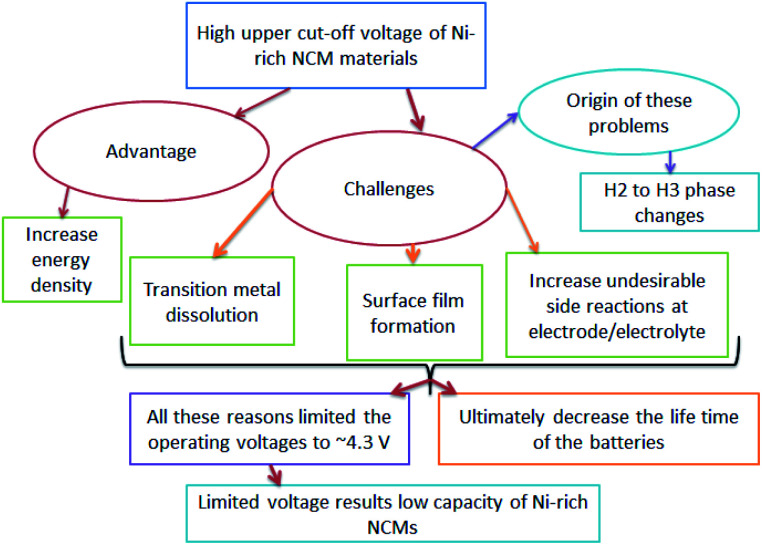
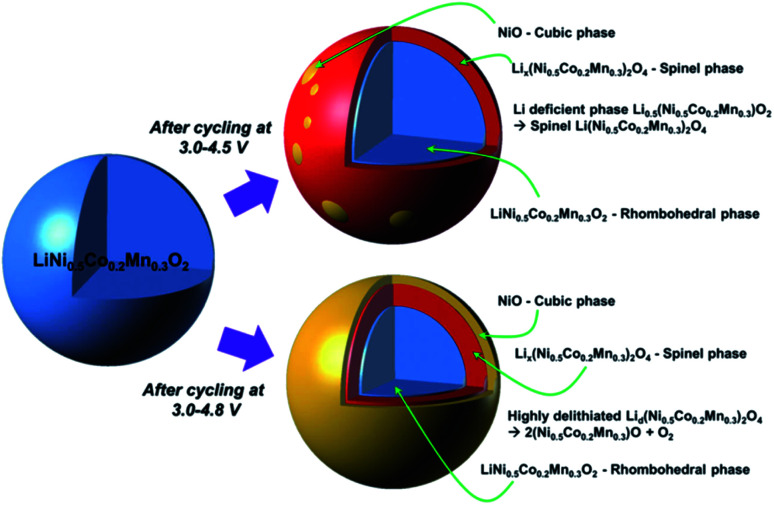
Among the existing commercial cathodes, Ni-rich NCM are the most promising candidates for next-generation LIBs because of their high energy density, relatively good rate capability, and reasonable cycling performance. However, the surface degradation, mechanical failure and thermal instability of these materials are the major causes of cell performance decay and rapid capacity fading. This is a huge challenge to commercializing these materials widely for use in LIBs. In particular, the thermal instability of Ni-rich NCM cathode active materials is the main issue of LIBs safety hazards. Hence, this review will recapitulate the current progress in this research direction by including widely recognized research outputs and recent findings. Moreover, with an extensive collection of detailed mechanisms on atomic, molecular and micrometer scales, this review work can complement the previous failure, degradation and thermal instability studies of Ni-rich NMC. Finally, this review will summarize recent research focus and recommend future research directions for nickel-rich NCM cathodes.


Conflict of interest statement

There are no interest conflicts.

Figures

Fig. 1
Fig. 1. (a) Diagram comparing the rechargeable battery technologies as a function of volumetric and specific energy densities. The arrows indicate the direction of development to reduce battery size and weight. (b) Schematic diagram of the charge/discharge principle of a LIB cell.
Fig. 2
Fig. 2. (a) Li-ion battery cathodes: important formulae, structures, and potential profiles during discharge (b) chart showing the weight fraction occupied by the components of a commercial lithium-ion battery cell. (c) A map of relationship between discharge capacity, and thermal stability and capacity retention of Li/Li[NixCoyMnz]O2 (x = 1/3, 0.5, 0.6, 0.7, 0.8 and 0.85). (d) Comparison of the capacity retention after 100 cycles achieved by tailoring Umax.
Fig. 3
Fig. 3. The flow of the advantages, challenges and origin of increasing upper cut-off voltage in Ni-rich NCM cathodes.
Fig. 4
Fig. 4. Degradation mechanisms of LiNi0.5Co0.2Mn0.3O2 and phase transformation after cycle tests under high-voltage conditions.
Fig. 5
Fig. 5. Differential capacity vs. cell voltage of NCM-graphite cells recorded at a 0.1 C-rate (3rd cycle). The vertical dotted lines mark the upper cutoff voltages. The peaks are assigned to their corresponding phase transitions with H1, H2 and H3 representing the three hexagonal phases and M the monoclinic one. C6 → LiCx indicates the lithiation of graphite.
Fig. 6
Fig. 6. [Illustration of the ordered and disordered phase in layered lithium metal oxides and their structural transformation. (a) Well-ordered Rm structure; (b) the cation disorder or cation mixing phase with Fmm structure; (c) Rm structure with Li vacancies in highly charged state; (d) partially cation mixed phase with TM-ions in Li slab. Li atoms yellow, transition metals red, coordinated oxygen atoms dark blue]. (e) The relative stability between spinel and layered structure of LiyNi12xCoxMnxO2 (x = 0, 1/8, and 1/4) as a function of Li concentration. (f) XRD patterns of S-NCM90 and P-NCM90.
Fig. 7
Fig. 7. Pictorial illustration of the phase transition occurring at distinct cycling rates. (a) The starting layered structure. (b) The delithiated state under the high cycling rate, creating limited amount of Li vacancies. (c) The structure evolution toward the spinel structure. (d) The delithiated state under the low cycling rate, generating significant amount of Li vacancies. (e) Formation of disordered rock salt structure.
Fig. 8
Fig. 8. Top view and cross-sectional SEM images of the NCM851005 cathode in discharged state (a and b) before cycling and (c and d) after 100 and (e and f) 500 cycles at 1C and 45 °C.
Fig. 9
Fig. 9. The HOMO and LUMO of electrolyte and Ni-rich cathode forming oxidation of electrolyte and CEI.
Fig. 10
Fig. 10. (a) Surface change of LiNi0.7Mn0.3O2 materials after exposure in air and effect of the residual lithium on the surface of LiNi0.7Mn0.3O2. (b) The amounts of residual lithium compounds on the LiNi0.8Co0.1Mn0.1O2 surface measured from titration. (c) XRD patterns of LiNi0.8Co0.1Mn0.1O2 with Li excesses (i) 20%, (ii) 10%, and (iii) 0%, where some of the minor peaks are residual lithium compound impurities.
Fig. 11
Fig. 11. Schematic illustration of phase transition and the possible TM cation migration path in the charged NMC cathode materials: (a) charged LiMO2 (M = Ni, Co, Mn), (b) M cation migration (mostly Ni), (c) 8a tetrahedral site: mostly Li, (d) 8a tetrahedral site: mostly Co or Mn.
Fig. 12
Fig. 12. The thermal runaway mechanism of the LIB modules in EV-ARC tests: (a) sample cell before test, (b) stage I, (c) SEI film decomposition, (d) separate melting, (e) separate break up, (f) sample test after test.
None
Fikadu Takele Geldasa
None
Mesfin Abayneh Kebede
None
Megersa Wodajo Shura
None
Fekadu Gashaw Hone

References

    1. Zhang S. S. Front. Energy Res. 2013;1:1–6.
    1. Younesi R. Front. Energy Res. 2014;2:2013–2014. doi: 10.3389/fenrg.2014.00014. - DOI
    1. Kåberger T. Global Energy Interconnection. 2018;1:48–52.
    1. Scrosat B. Garche J. J. Power Sources. 2010;195:2419–2430. doi: 10.1016/j.jpowsour.2009.11.048. - DOI
    1. Tarascon J. M. Armand M. Nature. 2001;414:359–367. doi: 10.1038/35104644. - DOI - PubMed