

Ag nanoparticles on ZnO nanoplates as a hybrid SERS-active substrate for trace detection of methylene blue
- PMID: 35424719
- PMCID: PMC8982176
- DOI: 10.1039/d2ra00620k
Ag nanoparticles on ZnO nanoplates as a hybrid SERS-active substrate for trace detection of methylene blue
Abstract
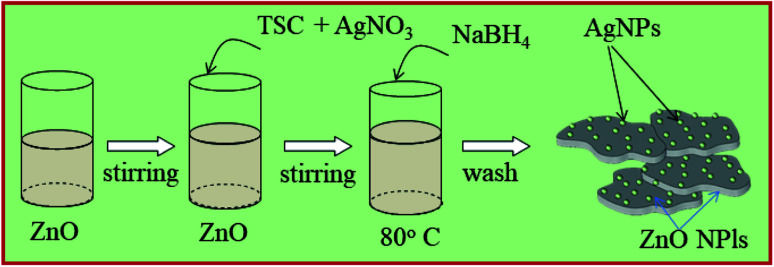
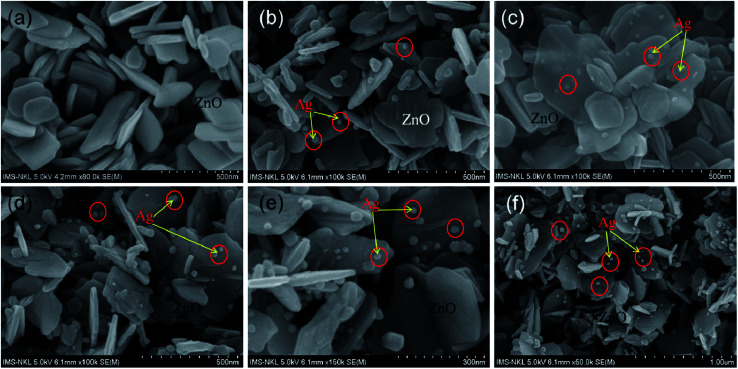
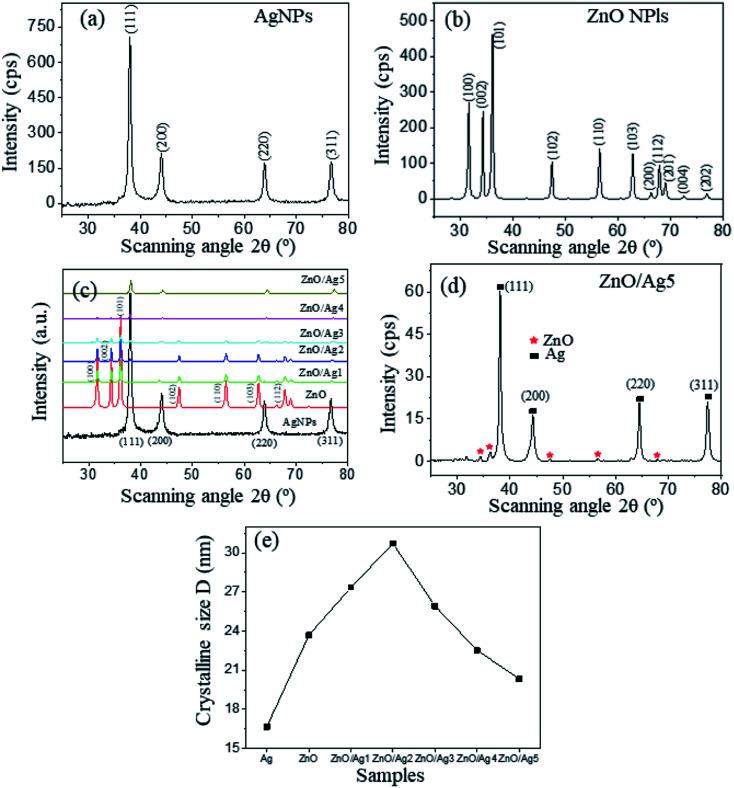
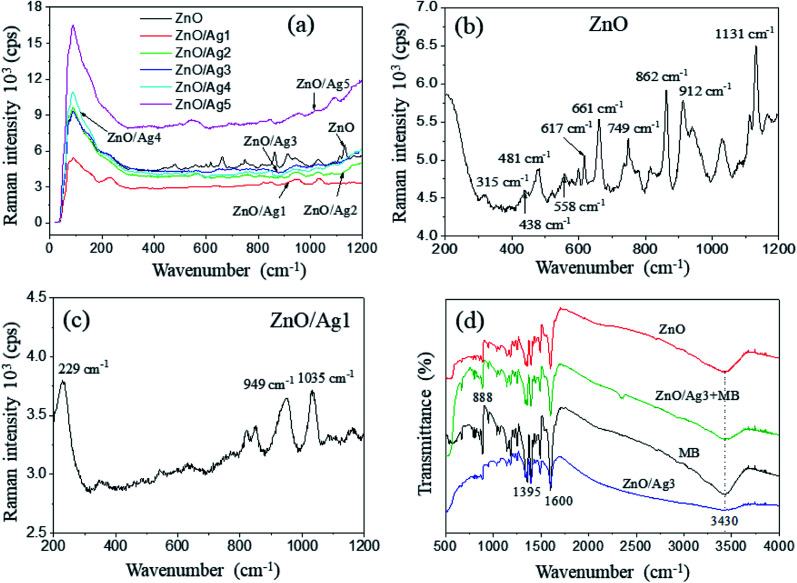
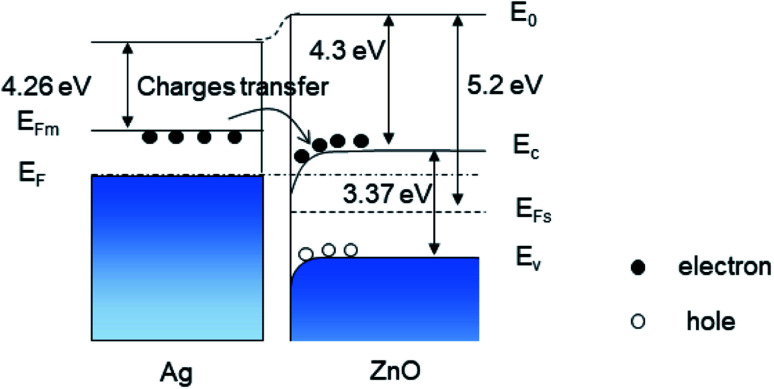
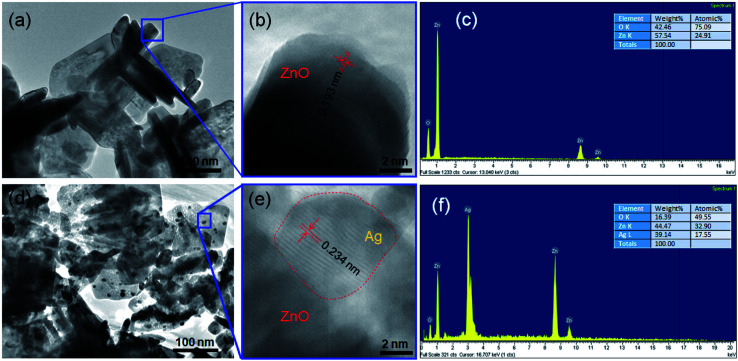
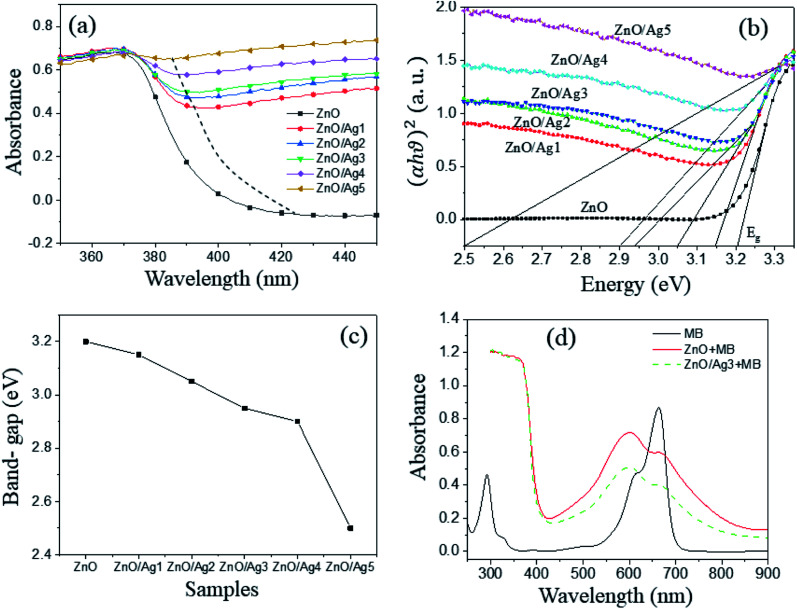
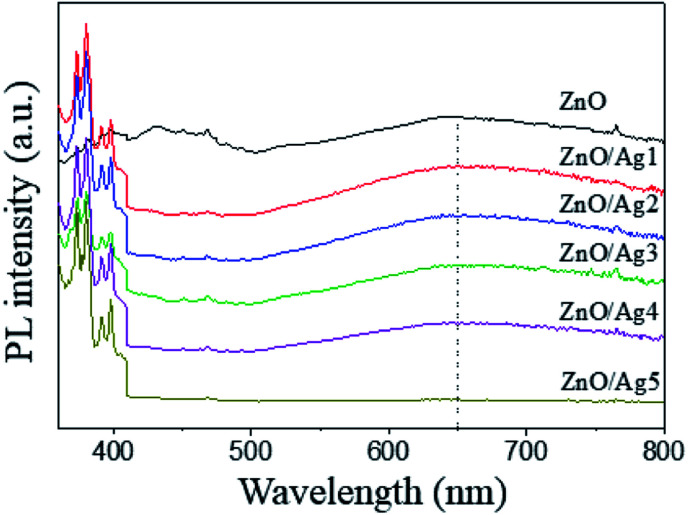
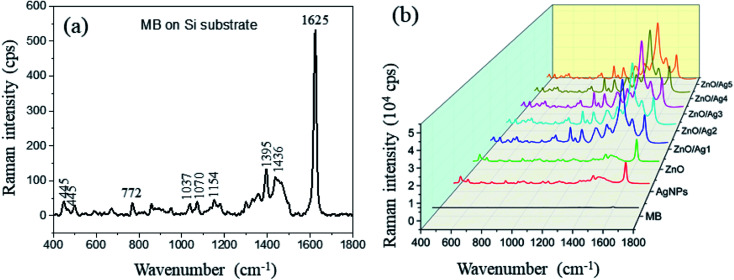
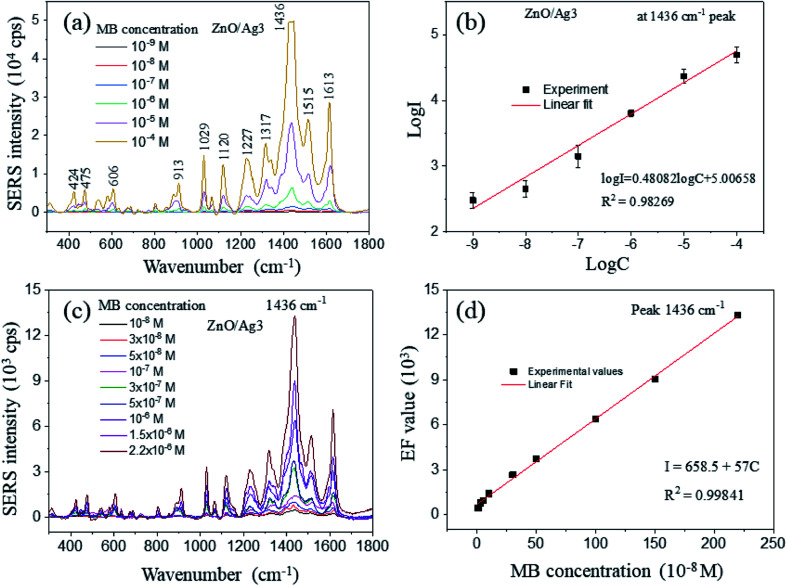
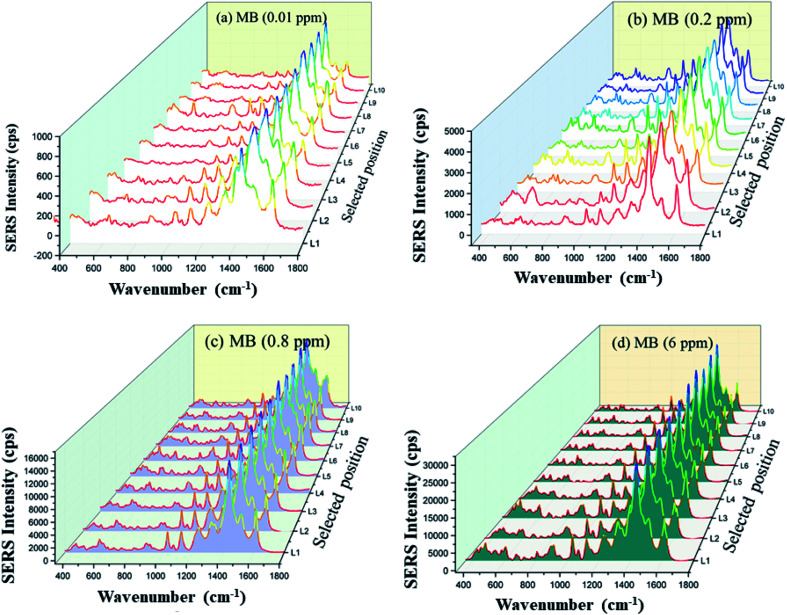
Decorating two-dimensional (2D) nanomaterials with nanoparticles provides an effective method to integrate their physicochemical properties. In this work, we present the hydrothermal growth process of 2D zinc oxide nanoplates (ZnO NPls), then silver nanoparticles (AgNPs) were uniformly distributed on the surface of ZnO NPls through the reduction procedure of silver nitrate with sodium borohydride to create a metal-semiconductor hybrid. The amount of AgNPs on the ZnO NPls' surface was carefully controlled by varying the volume of silver nitrate (AgNO3) solution. Moreover, the effect of AgNPs on the surface-enhanced Raman scattering (SERS) property of ZnO NPls was thoroughly investigated by using methylene blue (MB) as the target molecule. After calculation, the maximum enhancement factor value for 10-4 M of MB reached 6.2 × 10⁶ for the peak at 1436 cm-1 and the limit of detection was 10-9 M. In addition, the hybrid nanosystem could distinguish MB with good reproducibility over a wide range of concentrations, from 10-9 to 10-4 M. The SERS mechanism is well elucidated based on the chemical and electromagnetic mechanisms related to the synergism of ZnO and Ag in the enhancement of Raman signal. Abundant hot spots located at the gap between adjacent separate Ag nanoparticles and ZnO nanoplates which formed a strong local electromagnetic field and electron transfer between ZnO and Ag are considered to be the key factors affecting the SERS performance of our prepared ZnO/Ag substrates. In this research, we found high sensitivity of ZnO nanoplates/Ag nanoparticles in detecting MB molecules. This unique metal-semiconductor hybrid nanosystem is advantageous for the formation of Raman signals and is thus suitable for the trace detection of methylene blue.
This journal is © The Royal Society of Chemistry.
Conflict of interest statement
There are no conflicts of interest to declare.
Figures
References
-
- Nagaraju G. Udayabhanu S. Prashanth S. A. Shastri M. Yathish K. V. Anupama C. Rangappa D. Mater. Res. Bull. 2017;94:54–63. doi: 10.1016/j.materresbull.2017.05.043. - DOI
-
- Kaneti Y. V. Zakaria Q. M. D. Zhang Z. Chen C. Yue J. Liu M. Jiang X. Yu A. J. Mater. Chem. A. 2014;2:13283–13292. doi: 10.1039/C4TA01837K. - DOI
-
- Roy S. D. Ghosh M. Chowdhury J. J. Raman Spectrosc. 2015;46:451–461. doi: 10.1002/jrs.4675. - DOI
LinkOut - more resources
Full Text Sources
Miscellaneous