

Molecular dynamics simulations of the initial oxidation process on ferritic Fe-Cr alloy surfaces
- PMID: 35424942
- PMCID: PMC8985143
- DOI: 10.1039/d1ra09329k
Molecular dynamics simulations of the initial oxidation process on ferritic Fe-Cr alloy surfaces
Abstract
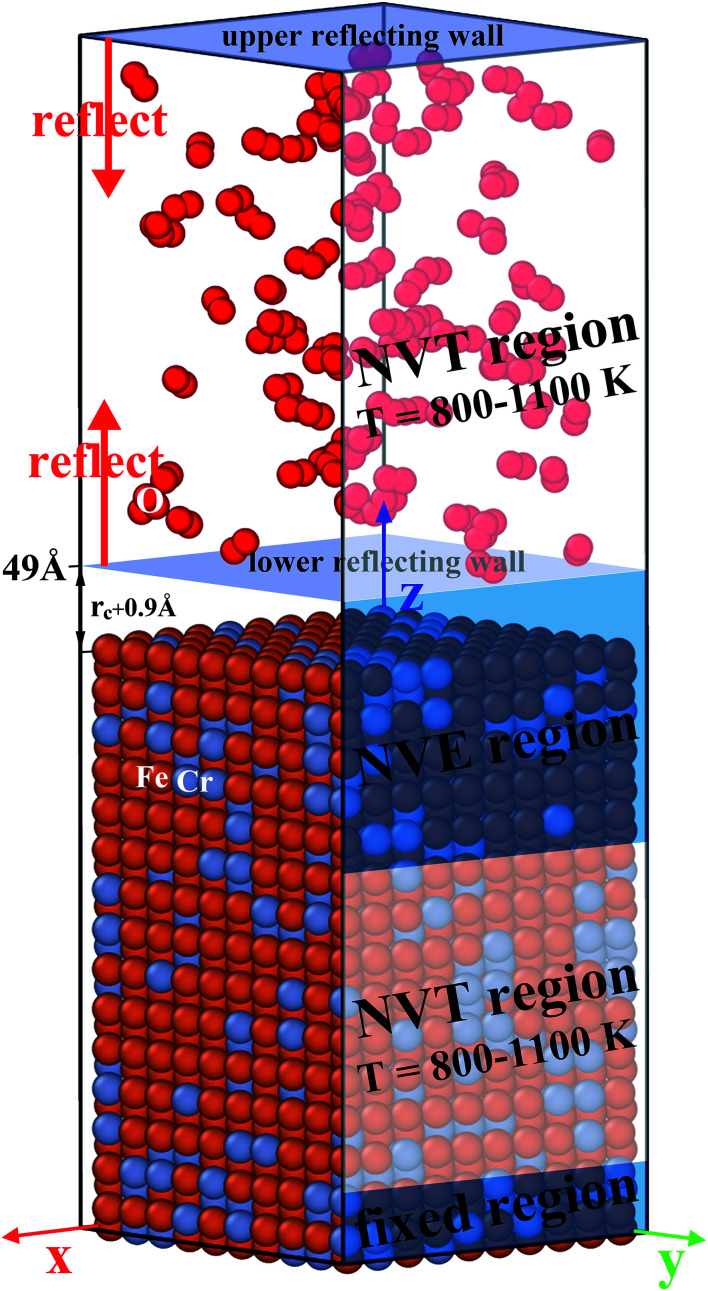
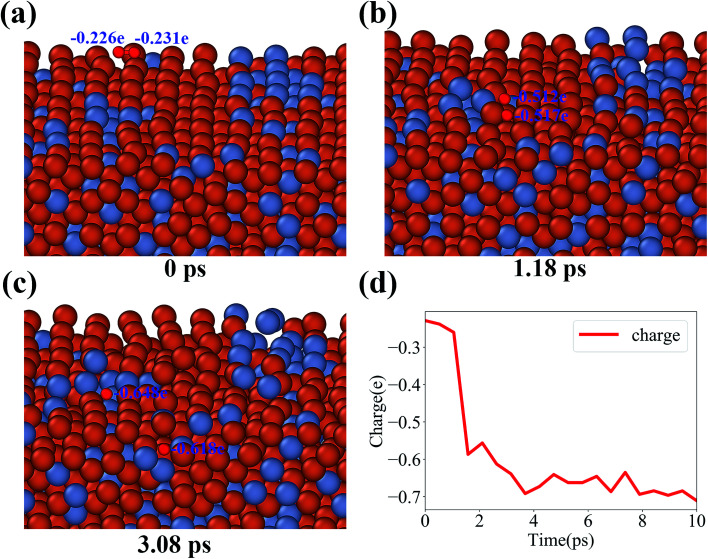
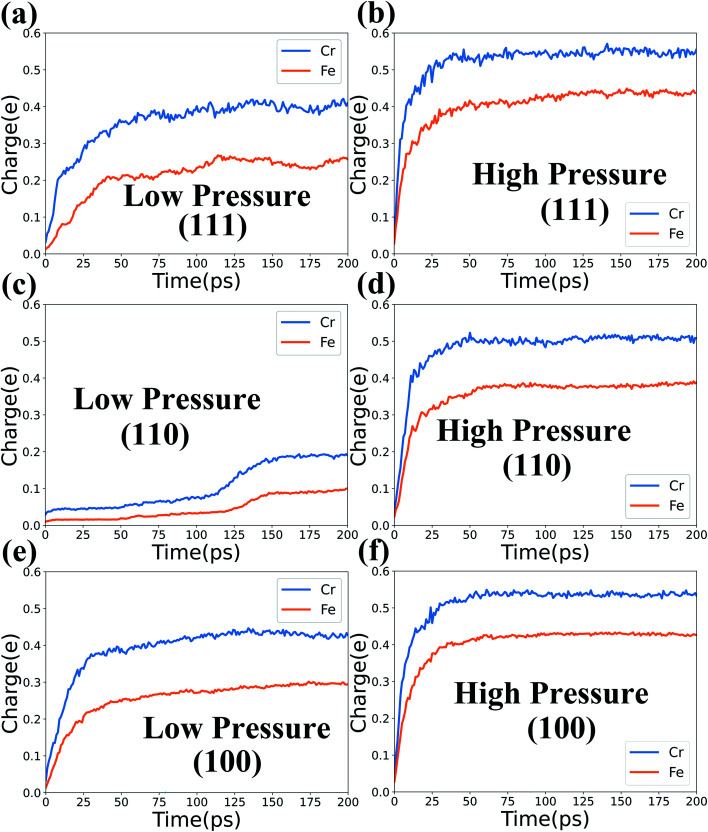
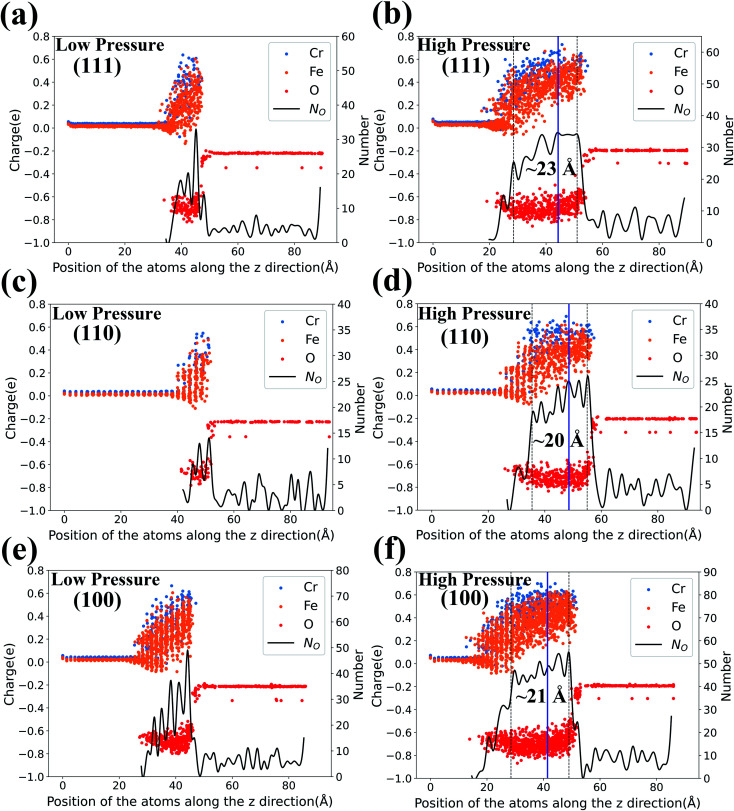
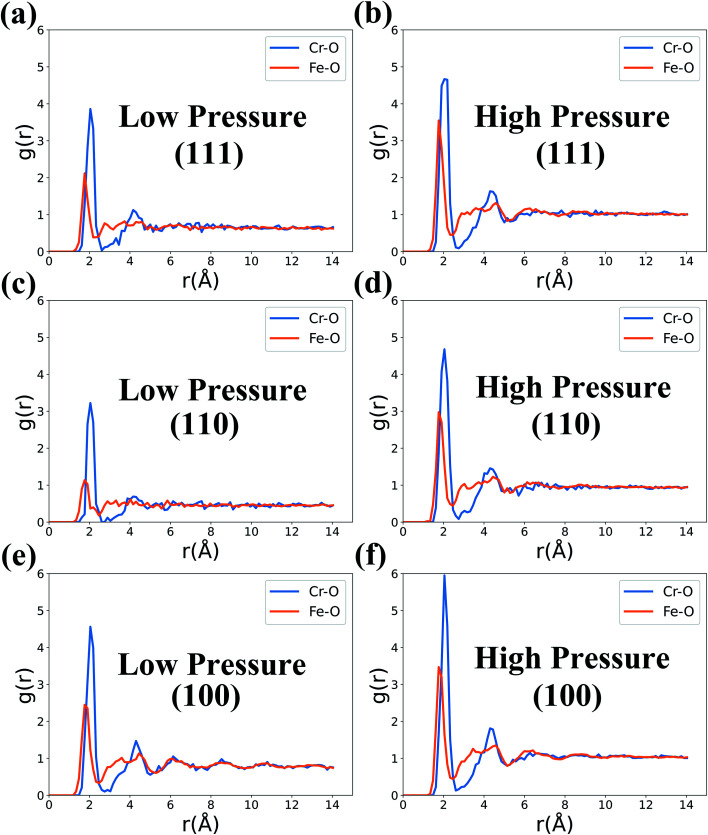
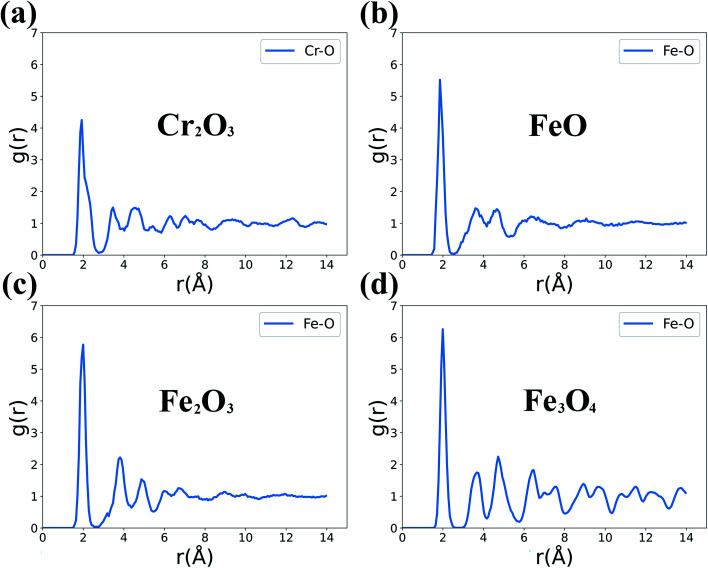
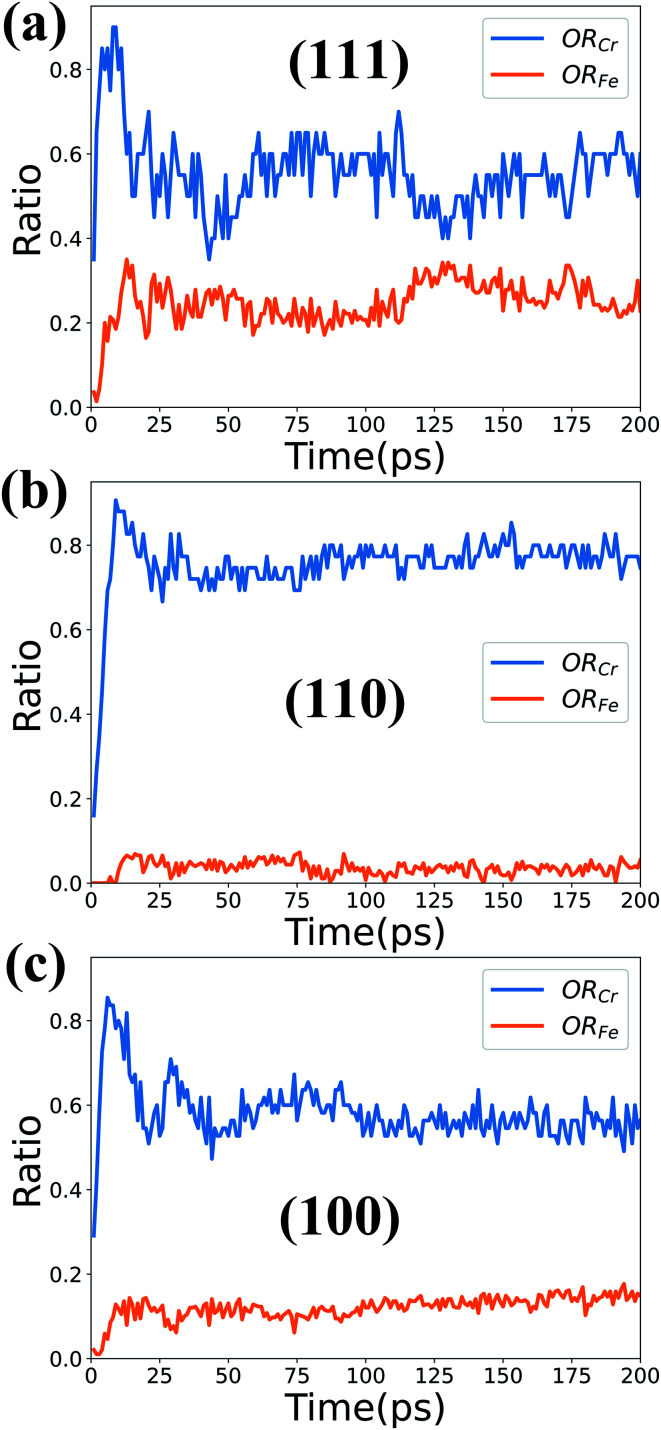
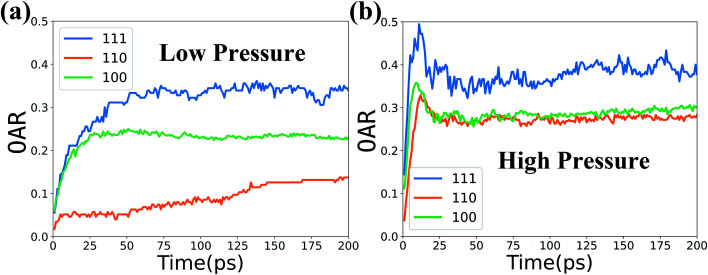
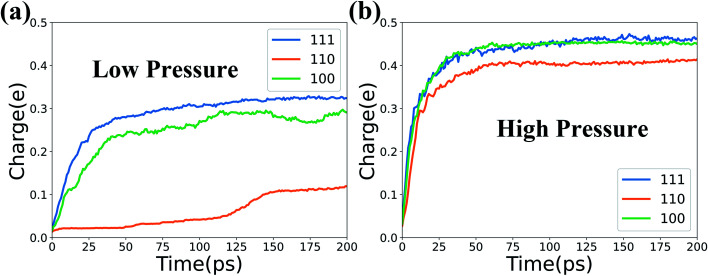
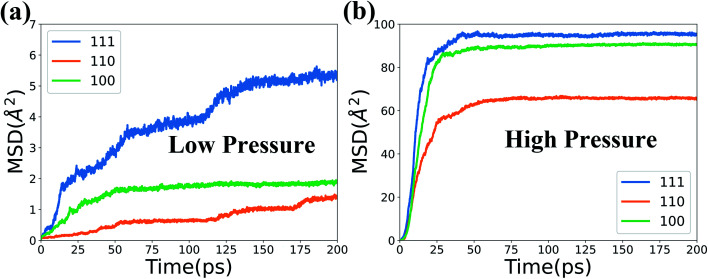
Oxidation processes of metallic interconnects are crucial to the operation of solid oxide fuel cells (SOFCs), and ferritic Fe-Cr alloy is one of the most important metallic interconnect materials. Based on the ReaxFF reactive potential, the interaction of O2 molecules with three types of surfaces (100, 110, 111) of ferritic Fe-Cr alloy has been studied by classical molecular dynamics at constant O2 concentrations and temperatures. The initial oxidation process is systematically studied according to the analysis of O2 absorption rate, charge variations, charge distributions, mean squared distributions, and oxidation rate. The results reveal that it is easier and faster for the Cr atoms to lose electrons than for the Fe atoms during the oxidation process. The obtained oxidation rate of Cr atoms is larger and the formation of Cr2O3 takes precedence over that of FeO. And the thickness of oxidation layers of different surfaces could be determined quantitatively. We also find that the high O2 concentration accelerates the oxidation process and obviously increases the thickness of oxidation layers, while the temperature has a weaker effect on the oxidation process than the O2 concentration. Moreover, the (110) surface presents the best oxidation resistance compared to the other two surfaces. And the (110) surface is efficient in preventing Fe atoms from being oxidized. Here we explore the initial oxidation process of Fe-Cr alloy and the corresponding results could provide theoretical guides to the related experiments and applications as metallic interconnects.
This journal is © The Royal Society of Chemistry.
Conflict of interest statement
There are no conflicts to declare.
Figures
References
-
- Steele B. C. and Heinzel A., Materials for sustainable energy: a collection of peer-reviewed research and review articles from nature publishing group, World Scientific, 2011, pp. 224–231
-
- Sharaf O. Z. Orhan M. F. Renew. Sustain. Energy Rev. 2014;32:810–853. doi: 10.1016/j.rser.2014.01.012. - DOI
-
- Cao T. Huang K. Shi Y. Cai N. Energy Environ. Sci. 2017;10:460–490. doi: 10.1039/C6EE03462D. - DOI
-
- Yang Z. Int. Mater. Rev. 2008;53:39–54. doi: 10.1179/174328007X212526. - DOI
LinkOut - more resources
Full Text Sources