Review
. 2022 Feb 8;12(8):4714-4759.
doi: 10.1039/d1ra08452f. eCollection 2022 Feb 3.

A review on advancements in carbon quantum dots and their application in photovoltaics

Affiliations
Review

A review on advancements in carbon quantum dots and their application in photovoltaics

Pawan Kumar et al. RSC Adv. .

Erratum in

Abstract

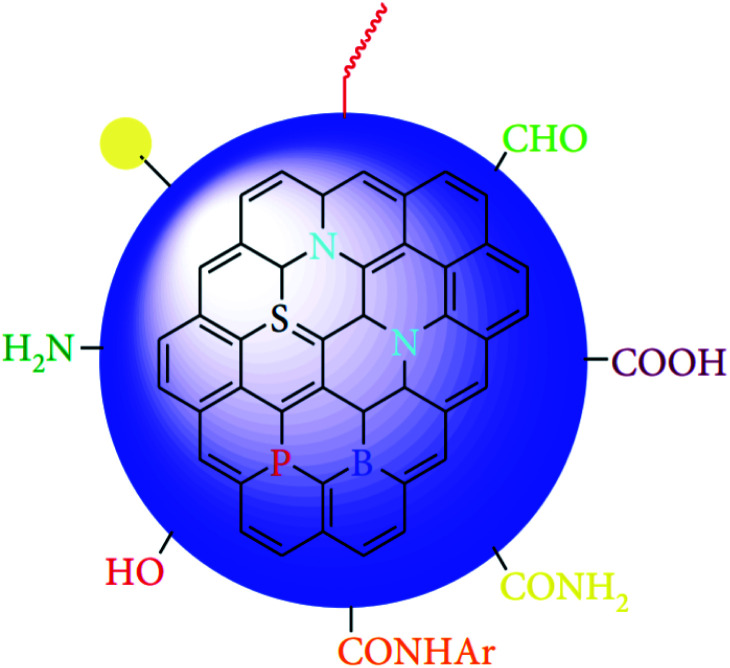
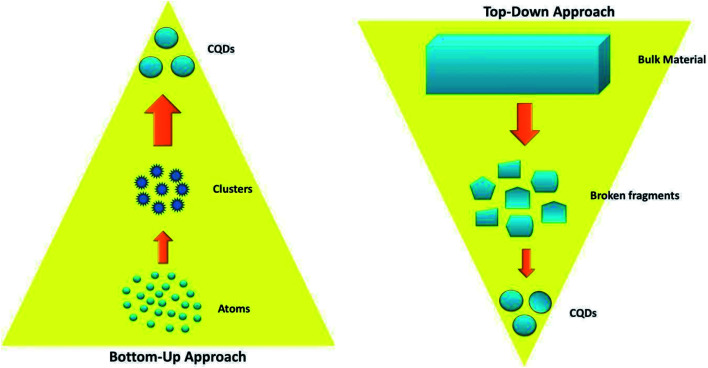
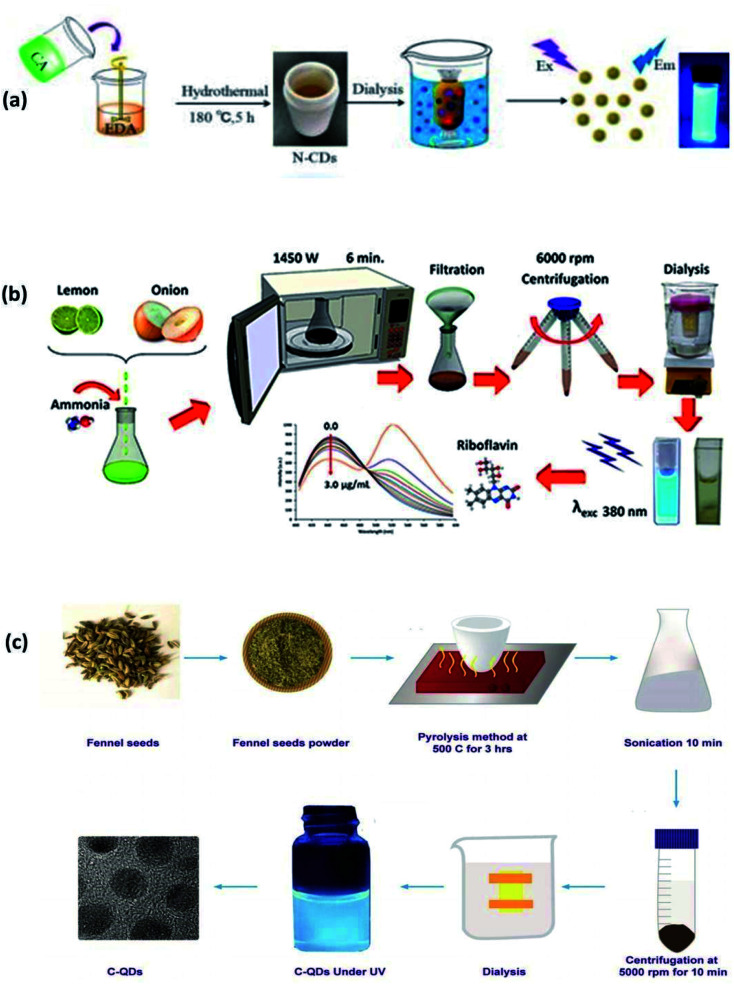
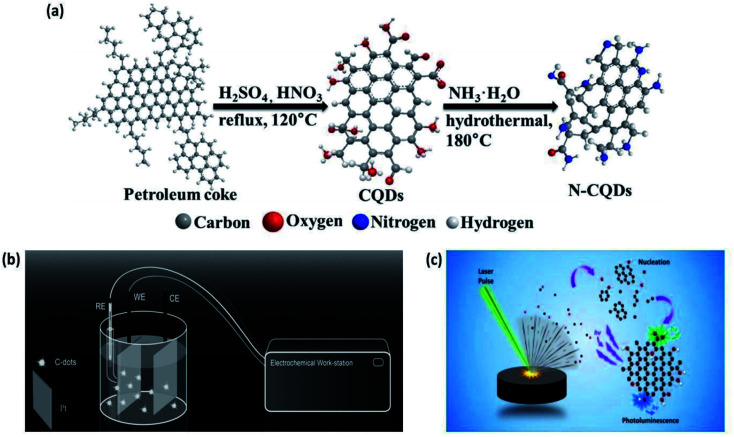
Carbon quantum dots are a new frontier in the field of fluorescent nanomaterials, and they exhibit fascinating properties such as biocompatibility, low toxicity, eco-friendliness, good water solubility and photostability. In addition, the synthesis of these nanoparticles is facile, rapid, and satisfies green chemistry principles. CQDs have easily tunable optical properties and have found applications in bioimaging, nanomedicine, drug delivery, solar cells, light-emitting diodes, photocatalysis, electrocatalysis and other related areas. This article systematically reviews carbon quantum dot structure, their synthesis techniques, recent advancements, the effects of doping and surface engineering on their optical properties, and related photoluminescence models in detail. The challenges associated with these nanomaterials and their prospects are discussed, and special emphasis has been placed on the application of carbon quantum dots in enhancing the performance of photovoltaics and white light-emitting diodes.


Conflict of interest statement

We declare that we have no conflicts of interest to this review article. We declare that we do not have any commercial or associative interest that represents a conflict of interest in connection with the review article.

Figures

Fig. 1
Fig. 1. General structure of CQDs (This figure has been adapted/reproduced from ref. with permission from Hindawi, Copyright 2019).
Fig. 2
Fig. 2. Schematic illustration of the synthesis approaches of CQDs.
Fig. 3
Fig. 3. (a) Synthesis of CQDs from citric acid and EDA through a hydrothermal method (this figure has been adapted/reproduced from ref. with permission from World Scientific, Copyright 2018). (b) Synthesis of CQDs from lemon juice, onion juice and ammonia through the microwave method (this figure has been adapted/reproduced from ref. with permission from Elsevier, Copyright 2019). (c) Synthesis of CQDs from fennel seeds via the pyrolysis method (this figure has been adapted/reproduced from ref. with permission from Nature, Copyright 2019).
Fig. 4
Fig. 4. (a) Preparation of CQDs and N-CQDs from petroleum coke through the chemical ablation method (this figure has been adapted/reproduced from ref. with permission from Elsevier, Copyright 2014). (b) Electrochemical synthesis of CQDs from simple organics. In simple conditions, one Pt sheet was used as the anode, the other one as the cathode and the simple organics as the carbon source. Under a suitable DC control, the organics were broken into CQDs (this figure has been adapted/reproduced from ref. with permission from Wiley-VCH, Copyright 2014). (c) Synthesis of CQDs through the laser ablation method (this figure has been adapted/reproduced from ref. with permission from Elsevier, Copyright 2018).
Fig. 5
Fig. 5. Types of CQDs reported by various research groups for different synthesis methods.
Fig. 6
Fig. 6. Different bands of the absorption spectrum of CQDs (this figure has been adapted/reproduced from ref. with permission from the American Chemical Society, Copyright 2017).
Fig. 7
Fig. 7. Schematic illustration of the surface modification of CQDs (this figure has been adapted/reproduced from ref. with permission from the Royal Society of Chemistry, Copyright 2019).
Fig. 8
Fig. 8. Changes in the fluorescence properties of CQDs after p-doping (this figure has been adapted/reproduced from ref. with permission from the Royal Society of Chemistry, Copyright 2014).
Fig. 9
Fig. 9. (a) Synthesis of F-CQDs (yellow) and un-doped CQDs (green) by a hydrothermal process. (b) Comparison of excitation/emission in both F-CQDs and un-doped CQDs (this figure has been adapted/reproduced from ref. with permission from the American Chemical Society, Copyright 2017).
Fig. 10
Fig. 10. (a) Fluorescence images of CQDs synthesized by (i) a hydrothermal method (1 : 1), (ii) microwave method (1 : 1), (iii) microwave method (1 : 2) under UV radiation (excitation 365 nm); (b) the absorption and emission spectra of CQDs in (i), (ii) and (iii) (this figure has been adapted/reproduced from ref. with permission from the Royal Society of Chemistry, Copyright 2018).
Fig. 11
Fig. 11. (a) Synthesis of MCBF-CQDs via hydrothermal synthesis from CA and DAN under different synthetic conditions. (b) The synthesized MCBF-CQDs under daylight (left) and UV light (right). (c) Normalized fluorescence of blue, green, yellow, orange and red CQDs. (d) Variation of the HOMO and LUMO energy levels with the size of MCBF-CQDs (this figure has been adapted/reproduced from ref. with permission from Wiley-VCH, Copyright 2017).
Fig. 12
Fig. 12. (a) Synthesis of CQDs from urea and phenylenediamine. (b) Fluorescence of the CQDs under excitation at 365 nm. (c) The emission spectrum of the synthesized CQDs, and (d) the variation in the bandgap of the CQDs (no change in size) with the degree of surface oxidation (this figure has been adapted/reproduced from ref. with permission from the American Chemical Society, Copyright 2015).
Fig. 13
Fig. 13. (a) Synthesis of CQDs using different precursors, (b) the proposed structures of different CQDs, (c) the proposed energy levels of surface states of CQDs, and (d) nitrogen percentages in different CQDs (this figure has been adapted/reproduced from ref. with permission from the Royal Society of Chemistry, Copyright 2018).
Fig. 14
Fig. 14. Energy band structure and possible PL processes for CQDs (this figure has been adapted/reproduced from ref. with permission from MDPI, Copyright 2018).
Fig. 15
Fig. 15. (a) Reaction of citric acid and ethylenediamine, resulting in e-CQDs and the fluorophore IPCA. (b) Reaction of citric acid with hexamethylenetetramine, producing h-CQDs and citrazinic acid and/or 3,5 derivatives (marked by –X) due to the decomposition of hexamethylenetetramine to ammonia and formaldehyde at temperatures exceeding 96 °C. (c) Reaction of citric acid and triethanolamine, resulting in t-CQDs and no derivatives of citrazinic acid since the tertiary amine prohibits their formation. (a–c) Images of the purified reaction products under ambient light and the corresponding diluted solutions under UV light excitation (this figure has been adapted/reproduced from ref. with permission from the American Chemical Society, Copyright 2016).
Fig. 16
Fig. 16. PL peak position (●) and normalized PL intensity (▲) as a function of the excitation wavelength for citrazinic acid (a) and the three CQD species (b–d). Emission pathways are illustrated in the simplified Jablonski diagrams: the arrow colors represent the shift in the emission wavelengths from blue to green (high to low energies), and arrow thickness indicates the relative intensities of different transitions. Schematic structures for each CQD species are drawn on the right. The attachment of molecular fluorophores is depicted by the hexagons for both e- and h-CQDs (this figure has been adapted/reproduced from ref. with permission from the American Chemical Society, Copyright 2016).
Fig. 17
Fig. 17. Minimum and maximum QYs for different synthesis techniques.
Fig. 18
Fig. 18. (a) The external quantum efficiency (EQE) test shows an enhancement mainly in the UV region by the incorporation of CQDs. (b) IV curve of DSSC at different numbers of coatings (CQD X; X is the number of N-CQDs solution coatings) (this figure has been adapted/reproduced from ref. with permission from Elsevier, Copyright 2019).
Fig. 19
Fig. 19. (a) IV characteristics of solar cells (with and without CQDs) exhibiting an increase in ISC in the presence of CQDs. (b) Enhanced EQE of solar cells in the presence of CQDs in the UV region (this figure has been adapted/reproduced from ref. with permission from Elsevier, Copyright 2022).
Fig. 20
Fig. 20. (a) Conversion processes from chitosan powders to carbon quantum dots (CQDs) by a hydrothermal method and images of nitrogen-doped carbon quantum dot (N-CQD) aqueous solutions synthesized at different heating times under UV light irradiation. (b) The energy level of N-CQDs with different heating times. (c) Energy level distribution and charge transfer processes at the interface. (d) Characteristic photocurrent density–voltage (JV) curves for N-CQDs sensitized solar cells under simulated sunlight (AM1.5, 100 mW cm−2) (this figure has been adapted/reproduced from ref. with permission from MDPI, Copyright 2020).
Fig. 21
Fig. 21. (a) Organic solar cell device structure with CQDs (C in C-CQDs indicates the carbon vapour deposition method). (b) Energy level diagram of the solar cells with CQDs as ETLs and P3HT:PC61BM, PTB7:PC61BM or PTB7-Th:PC71BM as the active layer (This figure has been adapted/reproduced from ref. with permission from Elsevier, Copyright 2016).
Fig. 22
Fig. 22. (a) Energy level diagram of PTB7-Th:PC71BM solar cells. The work-functions of ITO, ITO with PEI, and ITO with CQD-doped PEI were measured by Kelvin probe force microscopy. (b) A diagram of the summarized concept; CQD-doped PEI induced a stronger internal field due to the lower work-function. This strengthened internal field induced better exciton dissociation efficiency. (c) The JV characteristics of PTB7-Th:PC71BM solar cells with pristine PEI and CQD-doped PEI with various doping ratios. (d) EQE curves of PTB7-Th:PC71BM solar cells with pristine PEI and CQD-doped PEI with various doping ratios (this figure has been adapted/reproduced from ref. with permission from Elsevier, Copyright 2021).
Fig. 23
Fig. 23. OPV device performance and characterization. (a) Energy band diagram of the OPV device. (b) Current vs. potential (JV) curves (inset: OPV device with the structure ITO/PEDOT:PSS/active layer/TiOx/Al). (c) Photovoltaic response, and (d) EQE spectra of OPV devices (this figure has been adapted/reproduced from ref. with permission from Elsevier, Copyright 2021).
Fig. 24
Fig. 24. (a) Potential energy scan for each pair of N-CQD/PEDOT and O-CQD/PEDOT; (b) π–π stacking of PEDOT with N-CQDs and electrostatic interactions of PSS with N-CQDs (this figure has been adapted/reproduced from ref. with permission from Elsevier, Copyright 2021).
Fig. 25
Fig. 25. (a) PL spectra of P3HT (10 mg ml−1), C-CQDs (1 mg ml−1) and P3HT:C-CQDs (P3HT: 10 mg ml−1, C-CQDs content: 0, 2.5, 5, and 10 wt% vs. P3HT) composite films at an excitation of 450 nm. (b) UV-Vis absorption spectra of P3HT and P3HT:C-CQDs (1 : 5%) in the solid state (this figure has been adapted/reproduced from ref. with permission from Elsevier, Copyright 2018).
Fig. 26
Fig. 26. (a) FETEM image of P3HT:C-CQDs composite films (1 : 5%). (b) FETEM image of P3HT:H-CQDs composite films (1 : 5%) (this figure has been adapted/reproduced from ref. with permission from Elsevier, copyright 2018).
Fig. 27
Fig. 27. (a) Images of blue, green, and red CQD phosphors under sunlight and UV light. (b) Emission spectra of the mentioned CQDs. (c) Schematic diagram of warm WLEDs consisting of blue, green and red CQDs films. (d) Photograph of the operating warm WLED with brilliant warm white emission (this figure has been adapted/reproduced from ref. with permission from Wiley-VCH, Copyright 2017).
None
Pawan Kumar
None
Shweta Dua
None
Ravinder Kaur
None
Mahesh Kumar
None
Geeta Bhatt

References

    1. Patel K. D. Singh R. K. Kim H. W. Carbon-based nanomaterials as an emerging platform for theranostics. Mater. Horiz. 2019;6:434–469. doi: 10.1039/C8MH00966J. - DOI
    1. Wang X. Feng Y. Dong P. Huang J. A Mini Review on Carbon Quantum Dots: Preparation, Properties, and Electrocatalytic Application. Front. Chem. 2019;7:671. doi: 10.3389/fchem.2019.00671. - DOI - PMC - PubMed
    1. Zuo J. Jiang T. Zhao X. Xiong X. Xiao S. Zhu Z. Preparation and Application of Fluorescent Carbon Dots. J. Nanomater. 2015;2015:787862.
    1. Xu X. Ray R. Gu Y. Ploehn H. J. Gearheart L. Raker K. Scrivens W. A. Electrophoretic Analysis and Purification of Fluorescent Single–Walled Carbon Nanotube Fragments. J. Am. Chem. Soc. 2004;126:12736–12737. doi: 10.1021/ja040082h. - DOI - PubMed
    1. Sun Y. P. Zhou B. Lin Y. Wang W. Fernando K. A. S. Pathak P. Meziani M. J. Harruff B. A. Wang X. Wang H. Lu P. G. Yang H. Kose M. E. Chen B. Veca L. M. Xie S. Y. Quantum-Sized Carbon Dots for Bright and Colorful Photoluminescence. J. Am. Chem. Soc. 2006;128:7756–7757. doi: 10.1021/ja062677d. - DOI - PubMed