. 2022 Feb;7(2):177-185.
doi: 10.1038/s41560-021-00970-y. Epub 2022 Jan 27.

Exposure to Unconventional Oil and Gas Development and All-cause Mortality in Medicare Beneficiaries

Affiliations

Exposure to Unconventional Oil and Gas Development and All-cause Mortality in Medicare Beneficiaries

Longxiang Li et al. Nat Energy. 2022 Feb.

Abstract

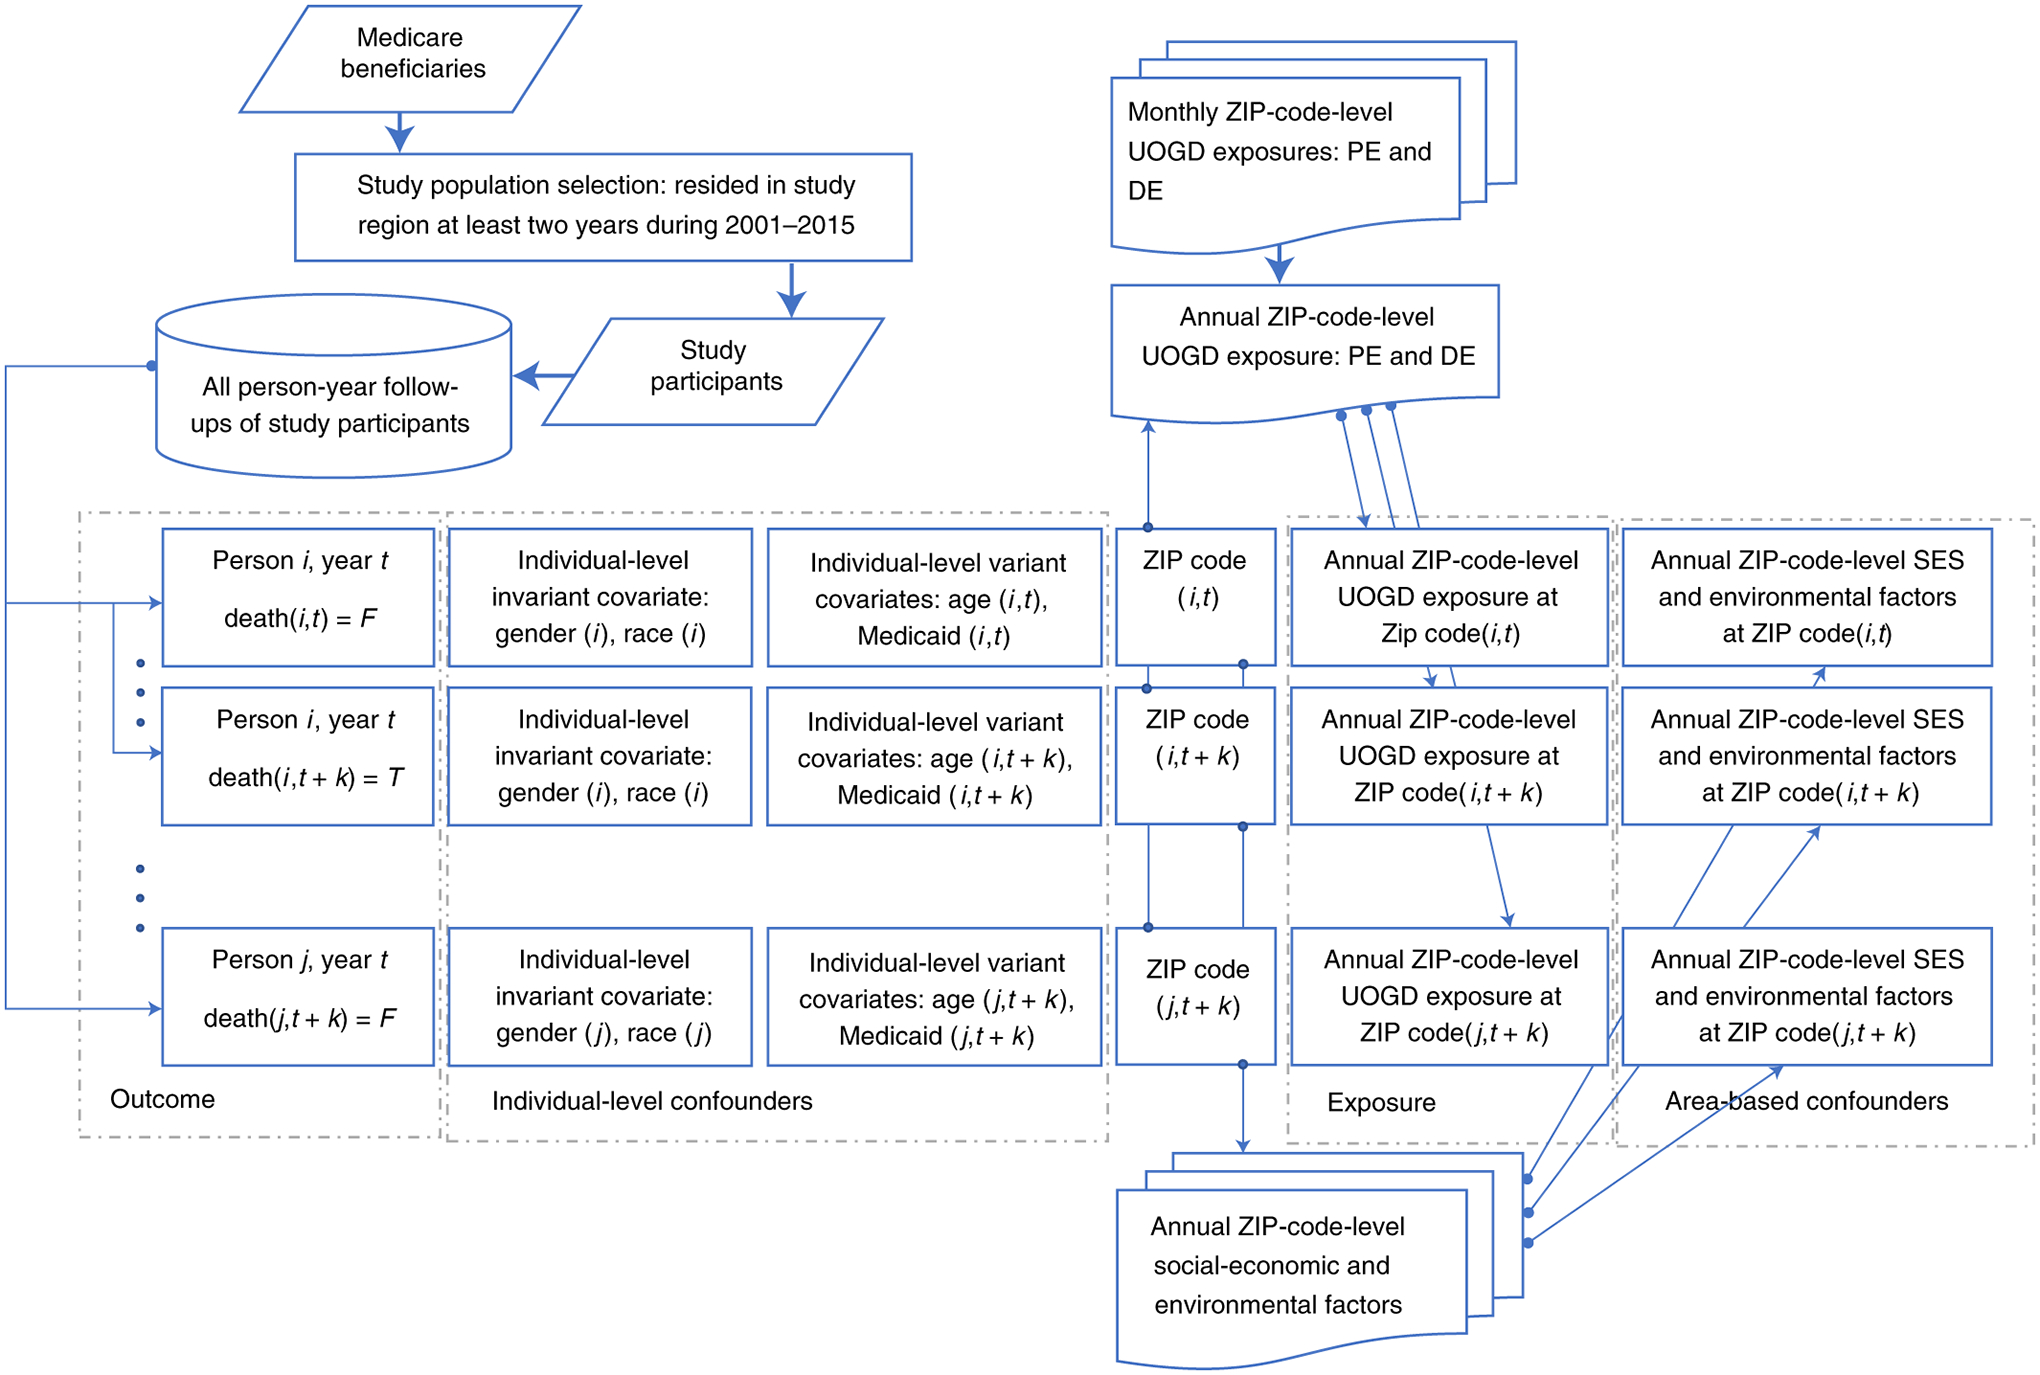
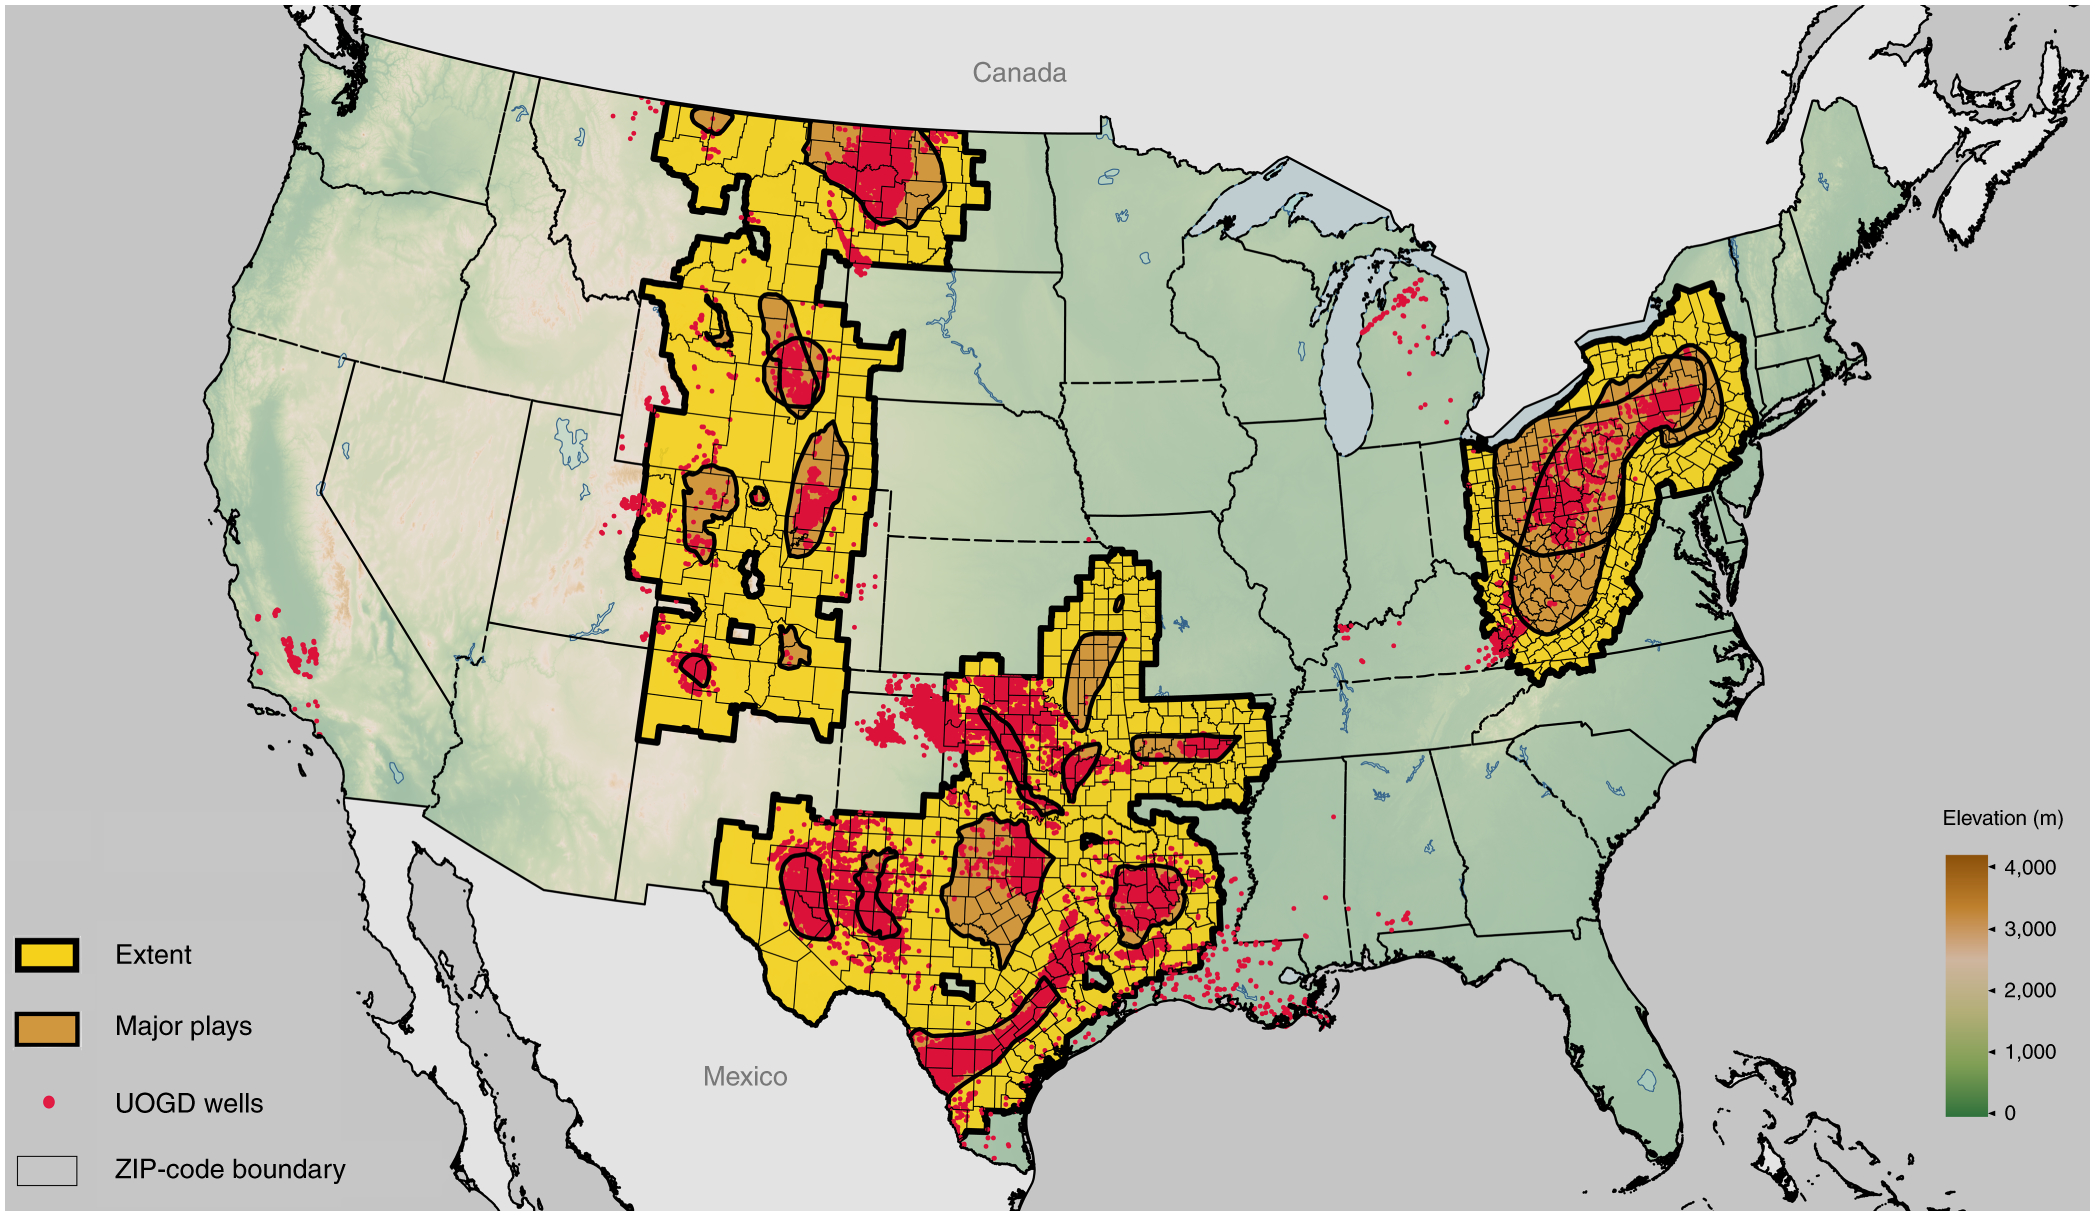
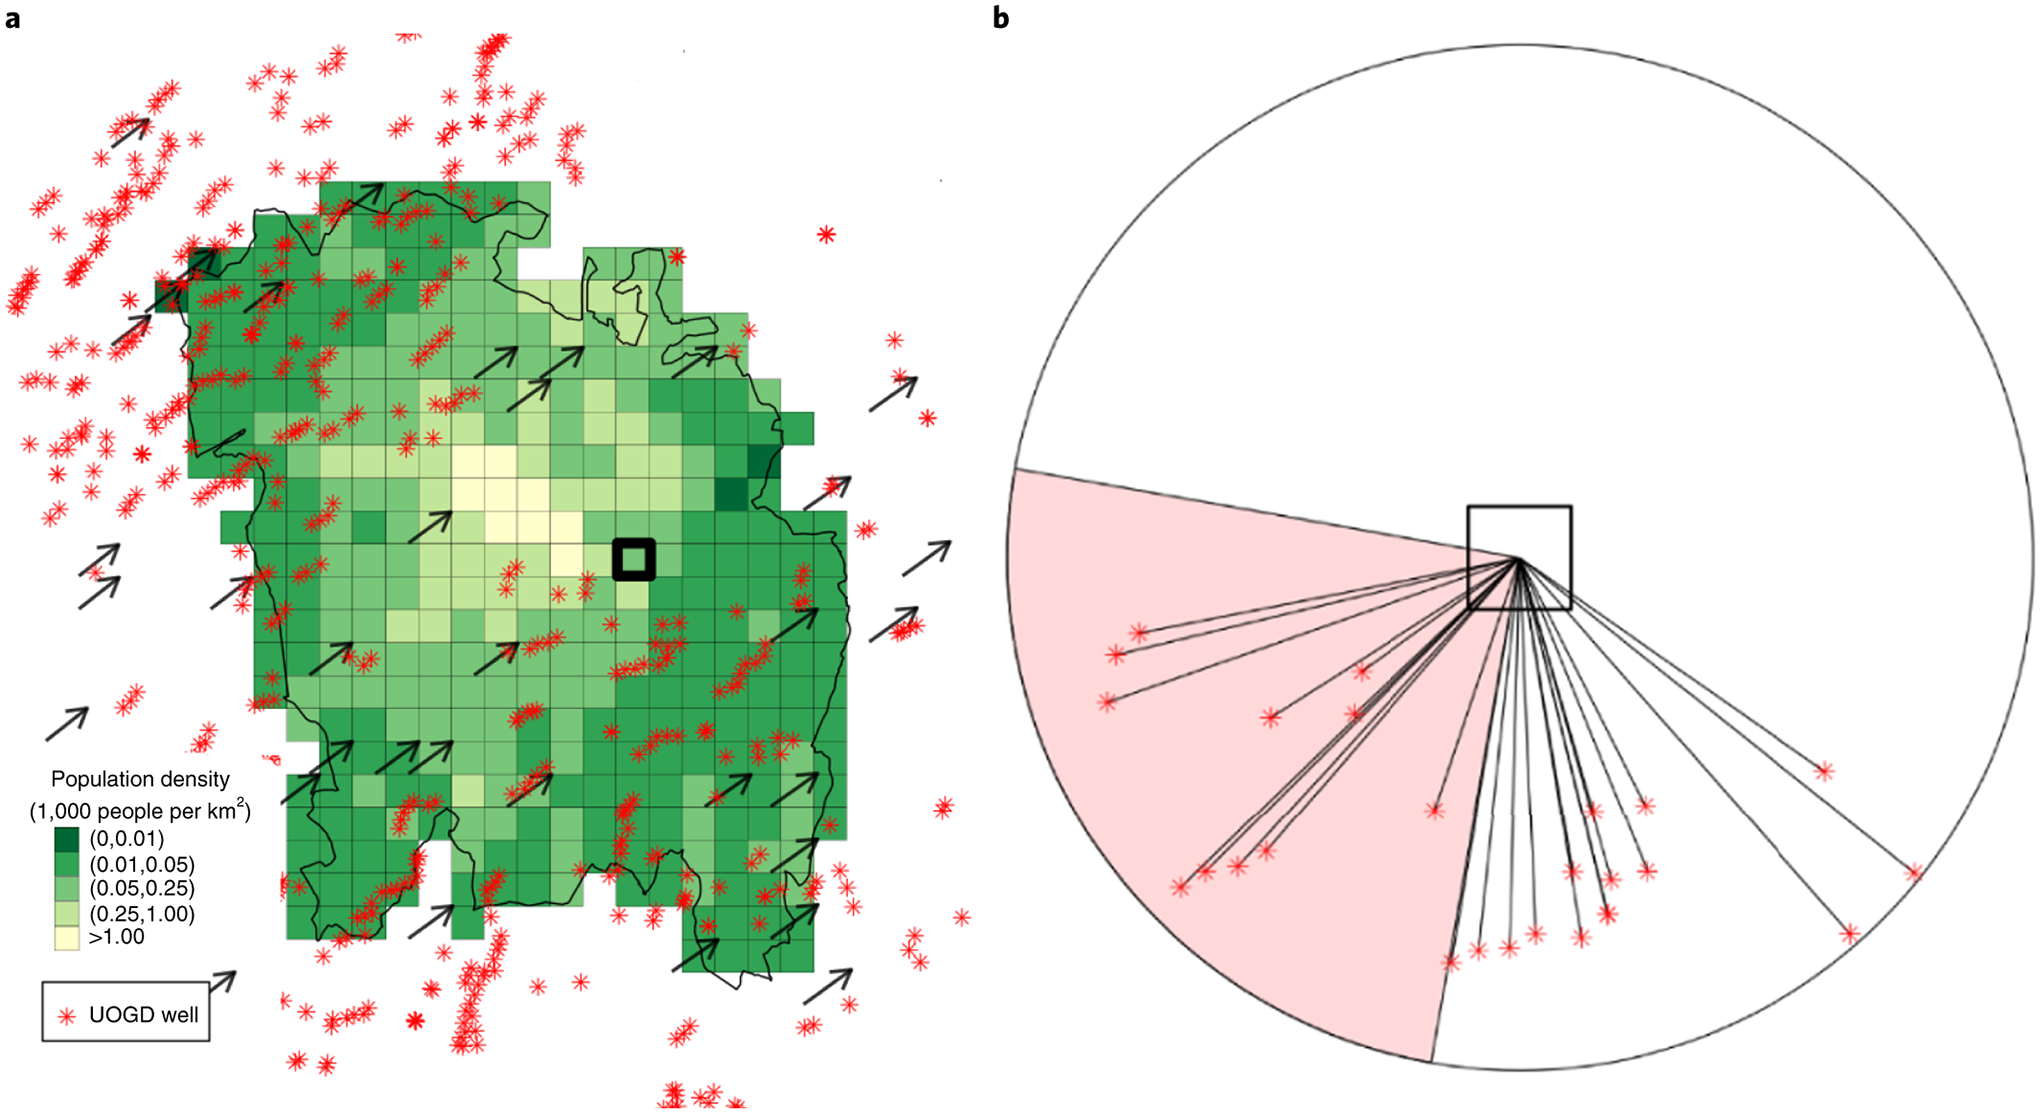
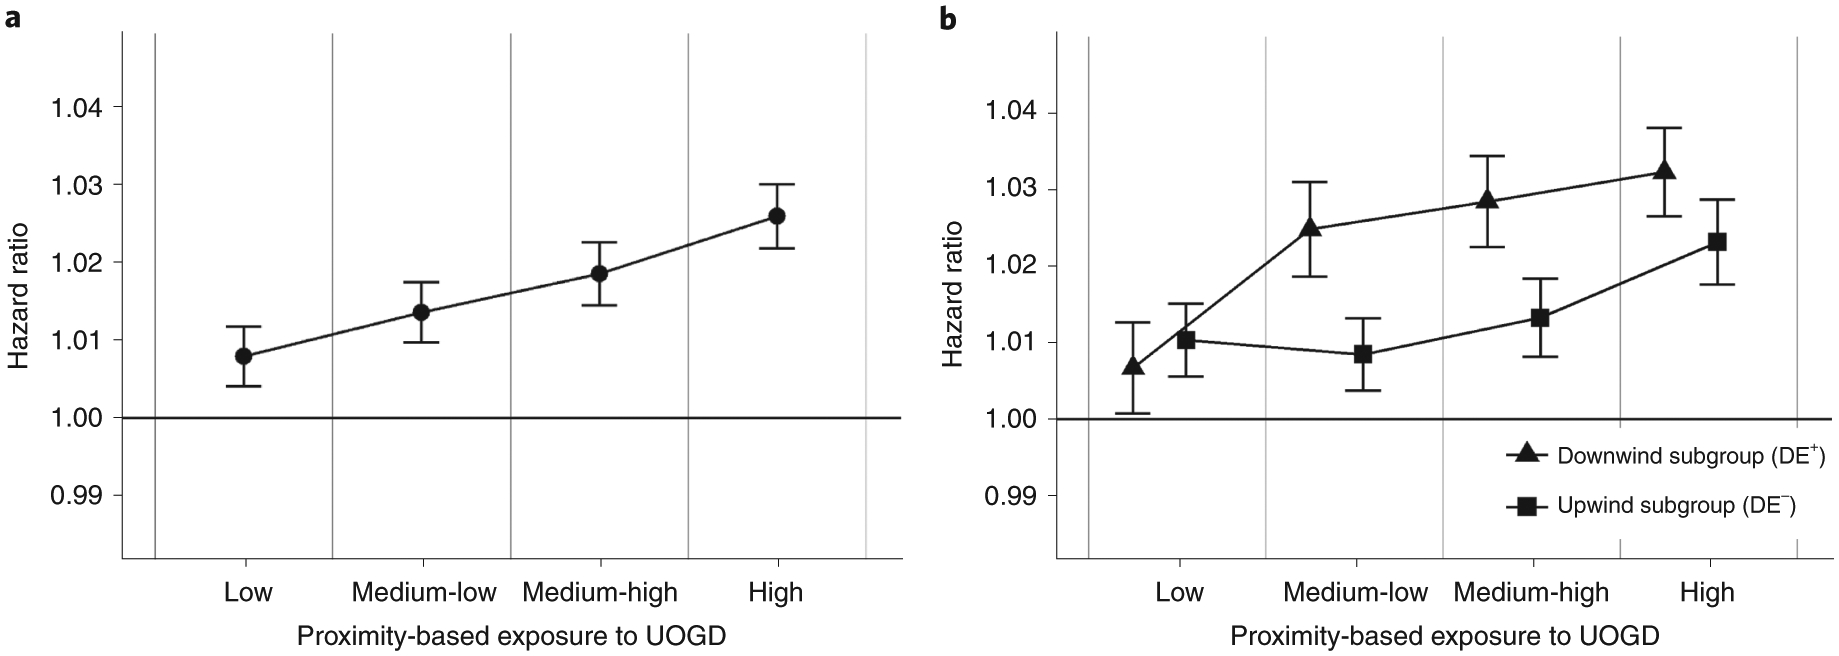
Little is known about whether exposure to unconventional oil and gas development is associated with higher mortality risks in the elderly and whether related air pollutants are exposure pathways. We studied a cohort of 15,198,496 Medicare beneficiaries (136,215,059 person-years) in all major U.S. unconventional exploration regions from 2001 to 2015. We gathered data from records of more than 2.5 million oil and gas wells. For each beneficiary's ZIP code of residence and year in the cohort, we calculated a proximity-based and a downwind-based pollutant exposure. We analyzed the data using two methods: Cox proportional hazards model and Difference-in-Differences. We found evidence of statistically significant higher mortality risk associated with living in proximity to and downwind of unconventional oil and gas wells. Our results suggest that primary air pollutants sourced from unconventional oil and gas exploration can be a major exposure pathway with adverse health effects in the elderly.


Conflict of interest statement

Competing interests. Dr. Francesca Dominici has served on the HEI Research Committee. The remaining authors declare no competing interests

Figures

Figure 1.
Figure 1.
Process diagram of our study design. We obtained mortality information of all Medicare enrollees and then selected those residing in the study region. For each person-year of follow-up, we extracted data on the occurrence of death, individual-level covariates, and the ZIP code of residence. The ZIP code of residence may have changed if the participant moved out of the original ZIP code. We calculated monthly UOGD exposures (PE and DE) based on Enverus database and monthly prevailing wind direction data. These monthly exposures were aggregated by year. Using the ZIP code for each person-year, the area of UOGD exposures (PE and DE) could be linked to individual records. Other area-based potential confounders such as socioeconomic factors and air pollutant levels could also be linked to the records.
Figure 2.
Figure 2.
Map of the study area, which contains more than 120,000 active UOGD wells located in 9,244 ZIP codes as of December 2015. The study area was grouped into three subregions for subregional analysis. The northern subregion covers the Bakken and Niobrara formations. The eastern subregion covers the Marcellus and Utica formations. The southern subregion covers the Permian, Barnett, Eagle Ford, Haynesville, Woodford, and Fayetteville formations.
Figure 3.
Figure 3.
UOGD exposure assessment in an example ZIP code and month (Washington, Pennsylvania, 15301, August 2015). Panel A shows the locations of active UOGD wells, the 1×1 km grid population density, and prevailing monthly wind direction. Panel B illustrates the calculation of PE and DE for an example grid in the ZIP code, which is bolded in Panel A. Proximity-based UOGD exposure (PE= IDWall) was calculated as the IDW of wells in all directions within a circular buffer* and was used in Model I. The UOGD exposure contributed by upwind wells (IDWup) was calculated using the IDW of all wells that fall within the windward circular quadrant. The ratio between IDWup and IDWall was defined as downwind exposure (DE+) and was used in Model II. * The radius of the circular buffer is 5 km for illustration purposes.
Figure 4.
Figure 4.
The results of Model I and Model II in Analysis Set I. Estimated relative risk of mortality, which is represented by the point estimate of the hazard ratio (HR, center point) and its 95% confidence interval (bar) associated with each level of proximity-based exposure to UOGD (PE) and subgroups of up- or downwind exposure to UOGD (DE) within each PE level. Each PE level of exposure (low, medium-low, medium-high, and high) and each subgroup of DE exposure (DE+ or DE−) was compared to the unexposed level. The unexposed level was defined as person-years for individuals whose residential addresses are distant from UOGD and COGD. Panel A shows the result from the Model I analysis, which investigated the relative risk of mortality associated with each PE level when compared to the unexposed level. Panel B shows the result from the Model II analysis, which investigated the association between PE and all-cause mortality in the DE+ and DE− subgroups. We then compared the relative risks associated with the DE+ subgroup and DE− subgroup within each PE level using a t-test.
Figure 5.
Figure 5.
Trends in all-cause mortality rate in the treatment group and comparison group pre- and post-drilling.
Figure 6.
Figure 6.
The results of a pre-test of the assumption of parallel trends in the mortality rate between the treatment and comparison groups (DiD in Analysis Set II). Negative values on the x-axis (length of exposure) indicate lead terms and positive values indicate lag terms with respect to drilling time. The point estimates of the lead and lag terms are presented; 95% confidence intervals for each estimate are shown as error bars.

References

    1. U.S. Energy Information Administration (EIA). No Title. https://www.eia.gov/petroleum/wells/.
    1. Czolowski ED, Santoro RL, Srebotnjak T & Shonkoff SBC Toward Consistent Methodology to Quantify Populations in Proximity to Oil and Gas Development: A National Spatial Analysis and Review. Environ. Health Perspect 125, 086004 (2017). - PMC - PubMed
    1. United States Environmental Protection Agency. Hydraulic Fracturing For Oil And Gas: Impacts From The Hydraulic Fracturing Water Cycle On Drinking Water Resources In The United States (Final Report) (2016).
    1. Health Effects Institute-Energy (HEI-Engergy) Research Committee. Human Exposure To Unconventionl Oil and Gas Development: A Literature Survery For Research Planning (Draft For Public Comment) (2019).
    1. Adgate JL, Goldstein BD & McKenzie LM Potential Public Health Hazards, Exposures and Health Effects from Unconventional Natural Gas Development. Environ. Sci. Technol 48, 8307–8320 (2014). - PubMed