

Typical and disrupted brain circuitry for conscious awareness in full-term and preterm infants
- PMID: 35425900
- PMCID: PMC9006044
- DOI: 10.1093/braincomms/fcac071
Typical and disrupted brain circuitry for conscious awareness in full-term and preterm infants
Abstract
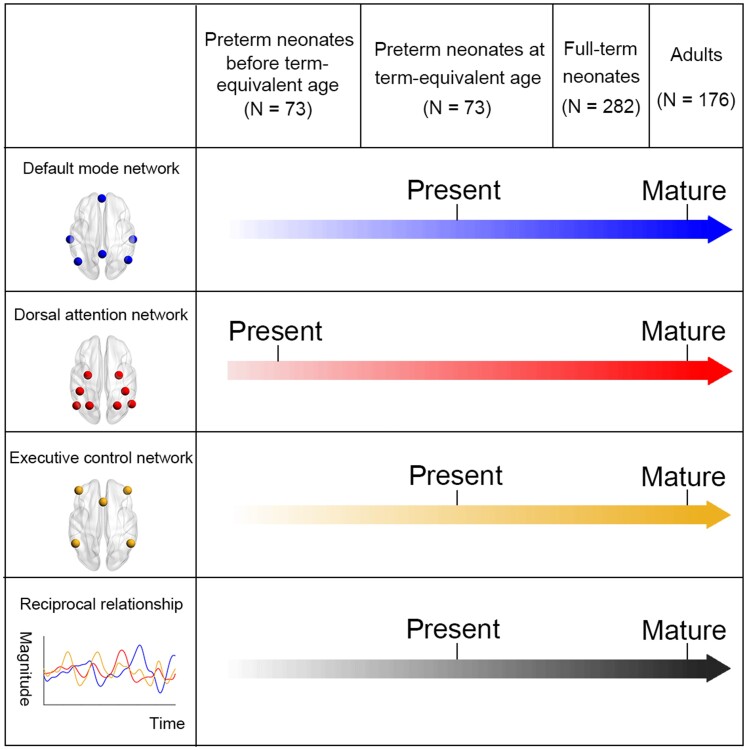
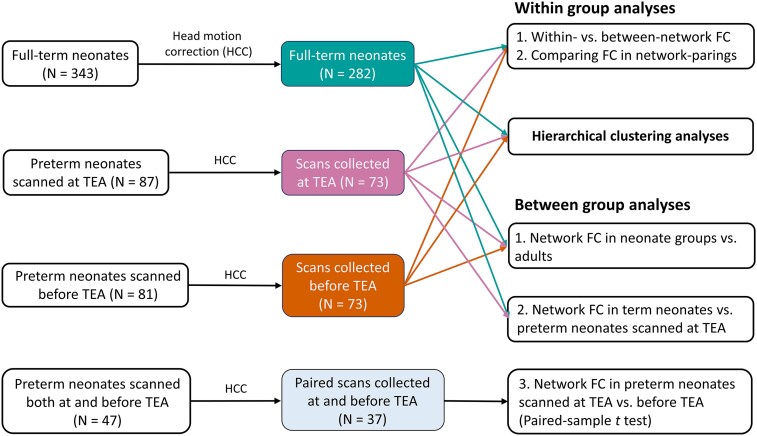
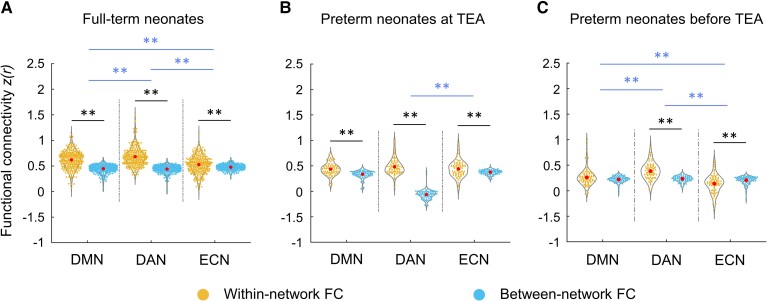
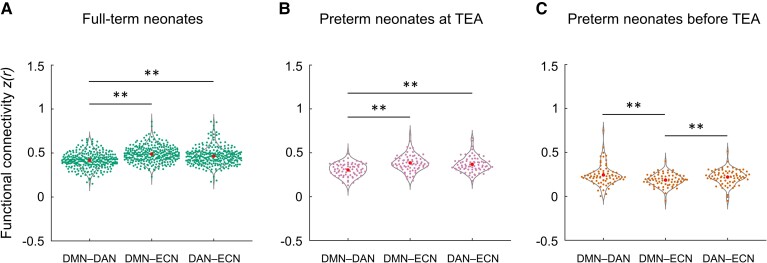
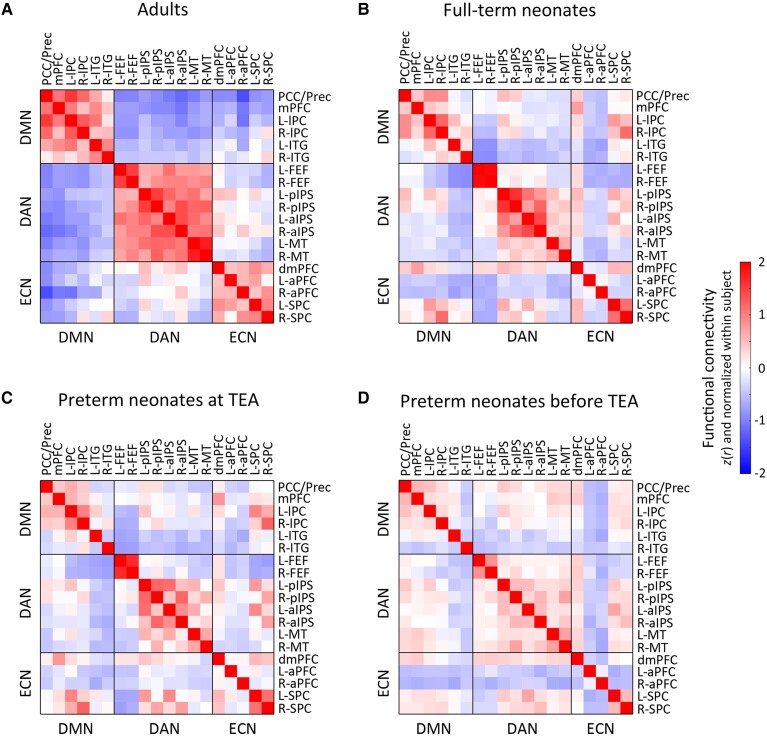
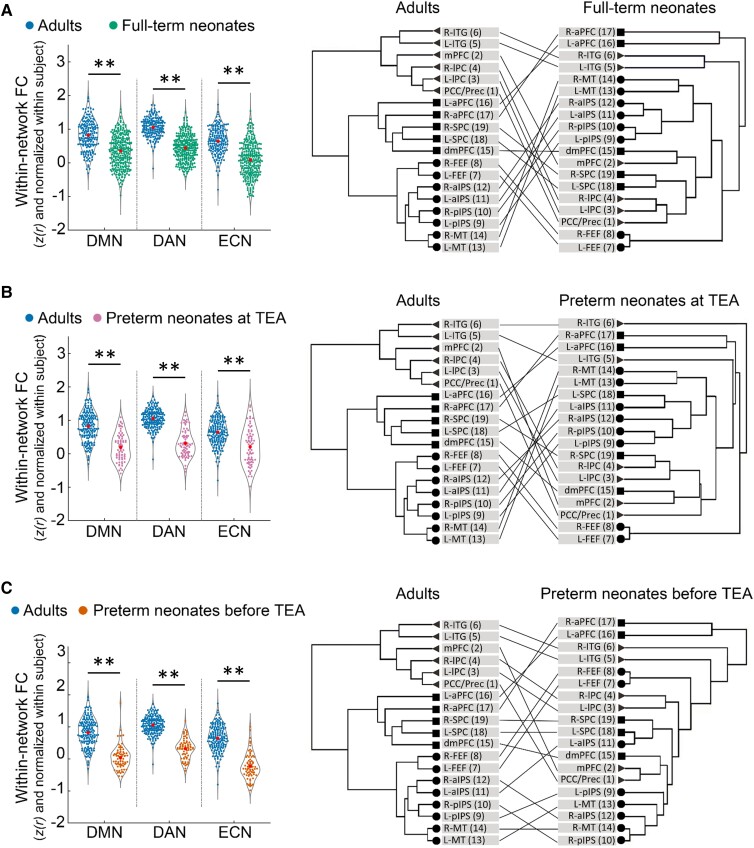
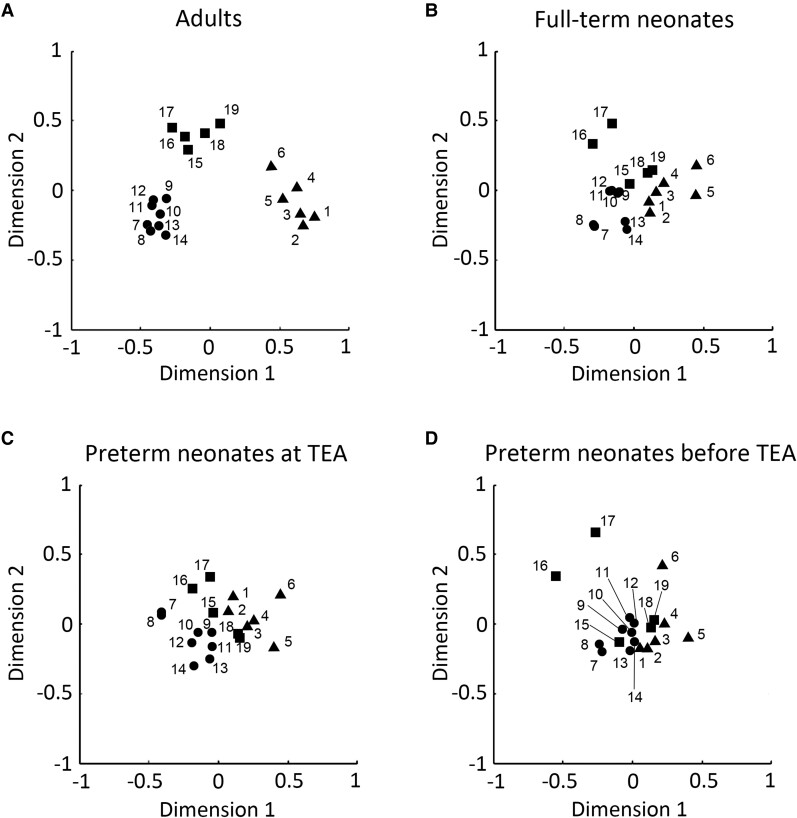
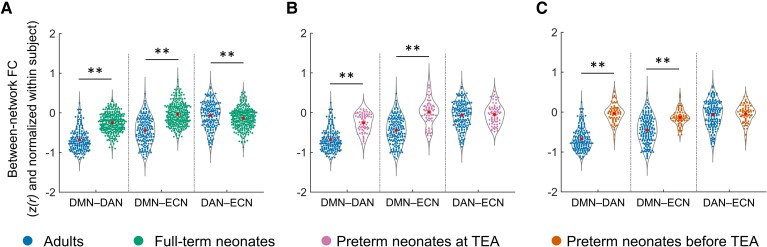
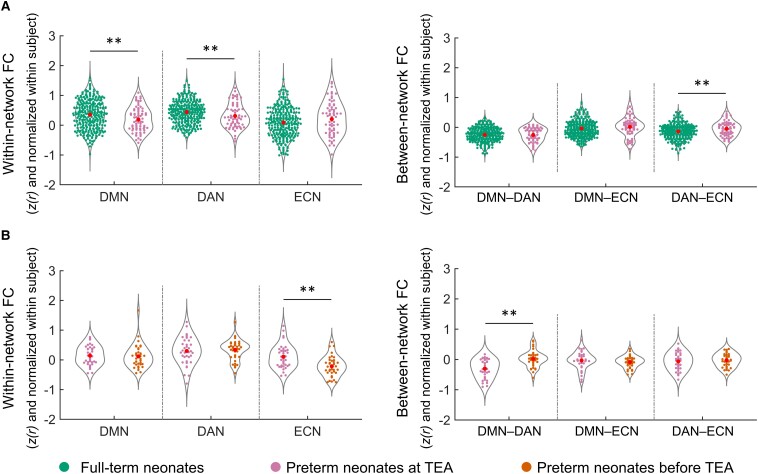
One of the great frontiers of consciousness science is understanding how early consciousness arises in the development of the human infant. The reciprocal relationship between the default mode network and fronto-parietal networks-the dorsal attention and executive control network-is thought to facilitate integration of information across the brain and its availability for a wide set of conscious mental operations. It remains unknown whether the brain mechanism of conscious awareness is instantiated in infants from birth. To address this gap, we investigated the development of the default mode and fronto-parietal networks and of their reciprocal relationship in neonates. To understand the effect of early neonate age on these networks, we also assessed neonates born prematurely or before term-equivalent age. We used the Developing Human Connectome Project, a unique Open Science dataset which provides a large sample of neonatal functional MRI data with high temporal and spatial resolution. Resting state functional MRI data for full-term neonates (n = 282, age 41.2 weeks ± 12 days) and preterm neonates scanned at term-equivalent age (n = 73, 40.9 weeks ± 14.5 days), or before term-equivalent age (n = 73, 34.6 weeks ± 13.4 days), were obtained from the Developing Human Connectome Project, and for a reference adult group (n = 176, 22-36 years), from the Human Connectome Project. For the first time, we show that the reciprocal relationship between the default mode and dorsal attention network was present at full-term birth or term-equivalent age. Although different from the adult networks, the default mode, dorsal attention and executive control networks were present as distinct networks at full-term birth or term-equivalent age, but premature birth was associated with network disruption. By contrast, neonates before term-equivalent age showed dramatic underdevelopment of high-order networks. Only the dorsal attention network was present as a distinct network and the reciprocal network relationship was not yet formed. Our results suggest that, at full-term birth or by term-equivalent age, infants possess key features of the neural circuitry that enables integration of information across diverse sensory and high-order functional modules, giving rise to conscious awareness. Conversely, they suggest that this brain infrastructure is not present before infants reach term-equivalent age. These findings improve understanding of the ontogeny of high-order network dynamics that support conscious awareness and of their disruption by premature birth.
Keywords: brain development; conscious awareness; high-order networks; neonate; premature birth.
© The Author(s) 2022. Published by Oxford University Press on behalf of the Guarantors of Brain.
Figures
Similar articles
-
Typical and disrupted small-world architecture and regional communication in full-term and preterm infants.PNAS Nexus. 2025 Feb 10;4(2):pgaf015. doi: 10.1093/pnasnexus/pgaf015. eCollection 2025 Feb. PNAS Nexus. 2025. PMID: 39931103 Free PMC article.
-
The Developing Human Connectome Project: typical and disrupted perinatal functional connectivity.Brain. 2021 Aug 17;144(7):2199-2213. doi: 10.1093/brain/awab118. Brain. 2021. PMID: 33734321 Free PMC article.
-
Altered Functional Brain Network Integration, Segregation, and Modularity in Infants Born Very Preterm at Term-Equivalent Age.J Pediatr. 2019 Oct;213:13-21.e1. doi: 10.1016/j.jpeds.2019.06.030. Epub 2019 Jul 26. J Pediatr. 2019. PMID: 31358292 Free PMC article.
-
Neural correlates of consciousness and related disorders: From phenotypic descriptors of behavioral and relative consciousness to cortico-subcortical circuitry.Neurochirurgie. 2022 Feb;68(2):212-222. doi: 10.1016/j.neuchi.2021.05.003. Epub 2021 May 26. Neurochirurgie. 2022. PMID: 34051246 Review.
-
The fetal pain paradox.Front Pain Res (Lausanne). 2023 Mar 21;4:1128530. doi: 10.3389/fpain.2023.1128530. eCollection 2023. Front Pain Res (Lausanne). 2023. PMID: 37025166 Free PMC article. Review.
Cited by
-
Proceedings of the First Pediatric Coma and Disorders of Consciousness Symposium by the Curing Coma Campaign, Pediatric Neurocritical Care Research Group, and NINDS: Gearing for Success in Coma Advancements for Children and Neonates.Neurocrit Care. 2023 Apr;38(2):447-469. doi: 10.1007/s12028-023-01673-w. Epub 2023 Feb 9. Neurocrit Care. 2023. PMID: 36759418 Free PMC article. Review.
-
Consciousness in the cradle: on the emergence of infant experience.Trends Cogn Sci. 2023 Dec;27(12):1135-1149. doi: 10.1016/j.tics.2023.08.018. Epub 2023 Oct 12. Trends Cogn Sci. 2023. PMID: 37838614 Free PMC article. Review.
-
The Awakening of the Newborn Human Infant and the Emergence of Consciousness.Acta Paediatr. 2025 May;114(5):823-828. doi: 10.1111/apa.70031. Epub 2025 Feb 15. Acta Paediatr. 2025. PMID: 39953815 Free PMC article. Review.
-
Developmental trajectories of the default mode, frontoparietal, and salience networks from the third trimester through the newborn period.Imaging Neurosci (Camb). 2024 Jul 8;2:imag-2-00201. doi: 10.1162/imag_a_00201. eCollection 2024. Imaging Neurosci (Camb). 2024. PMID: 40800486 Free PMC article.
-
Typical and disrupted small-world architecture and regional communication in full-term and preterm infants.PNAS Nexus. 2025 Feb 10;4(2):pgaf015. doi: 10.1093/pnasnexus/pgaf015. eCollection 2025 Feb. PNAS Nexus. 2025. PMID: 39931103 Free PMC article.
References
Grants and funding
LinkOut - more resources
Full Text Sources
Miscellaneous