. 2022 Aug 5;20(8):1260-1271.
doi: 10.1158/1541-7786.MCR-21-0657.

Multi-omics Profiling Shows BAP1 Loss Is Associated with Upregulated Cell Adhesion Molecules in Uveal Melanoma

Affiliations

Multi-omics Profiling Shows BAP1 Loss Is Associated with Upregulated Cell Adhesion Molecules in Uveal Melanoma

Usman Baqai et al. Mol Cancer Res. .

Abstract

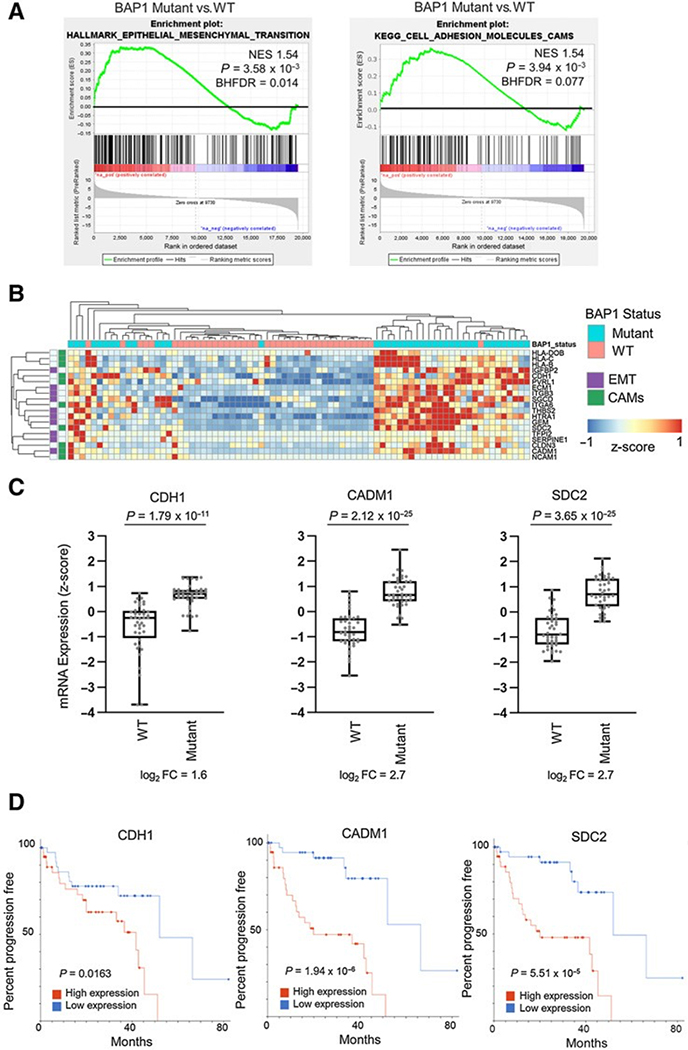
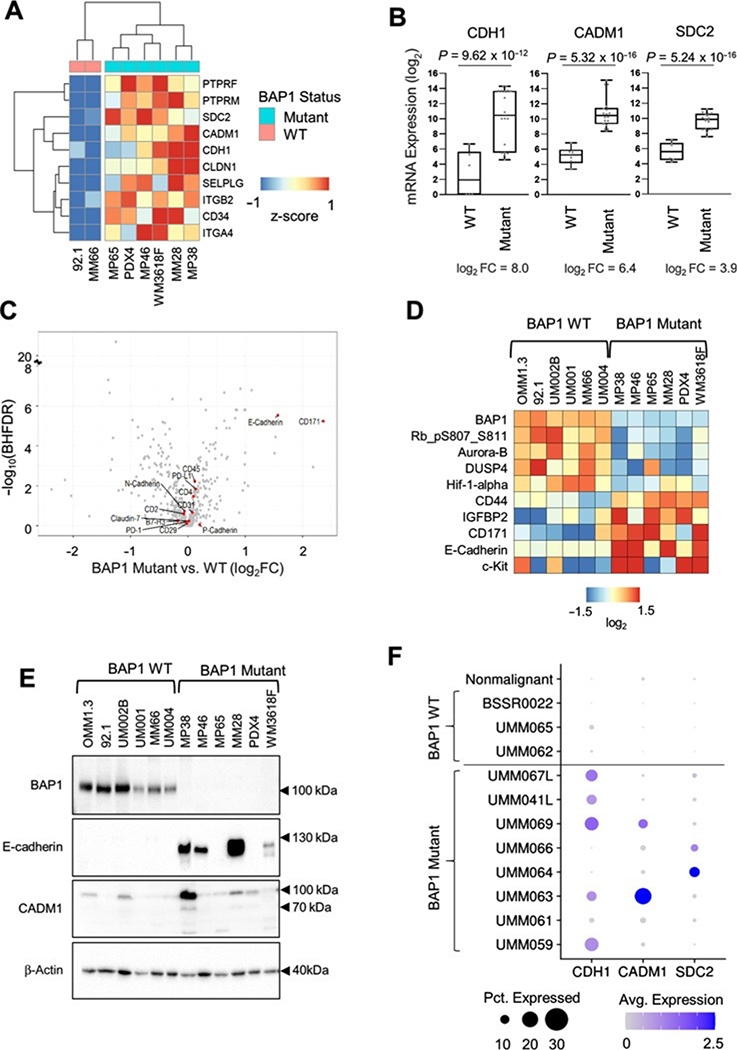
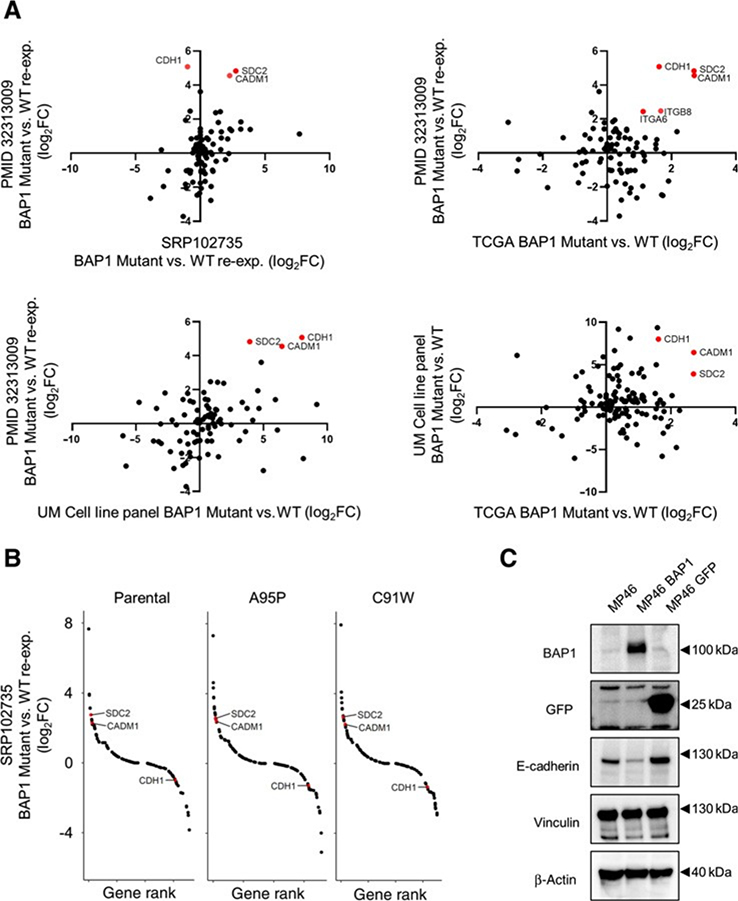
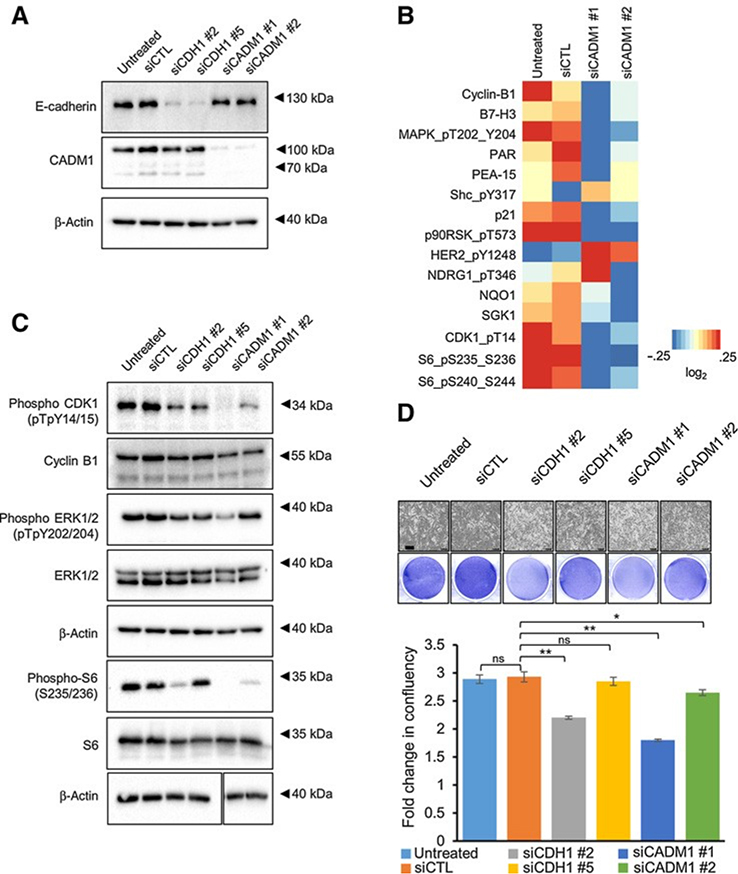
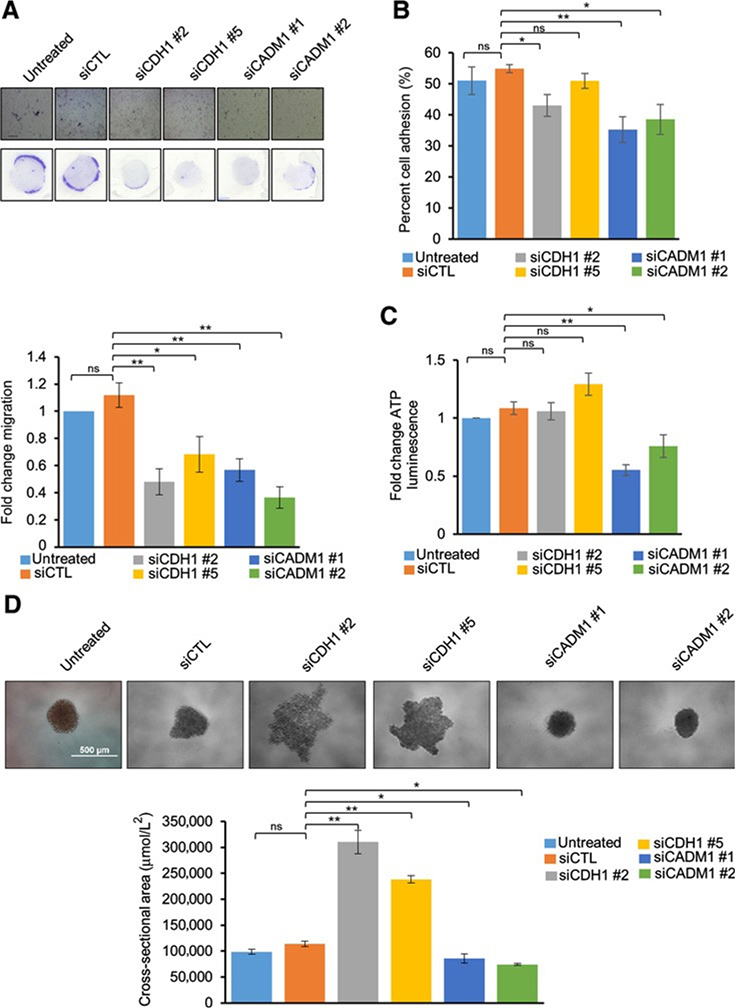
BRCA1-associated protein 1 (BAP1) is a tumor suppressor gene that is mutated in cancer, including uveal melanoma. Loss-of-function BAP1 mutations are associated with uveal melanoma metastasis and poor prognosis, but the mechanisms underlying these effects remain unclear. Upregulation of cell-cell adhesion proteins is involved with collective migration and metastatic seeding of cancer cells. Here, we show that BAP1 loss in uveal melanoma patient samples is associated with upregulated gene expression of multiple cell adhesion molecules (CAM), including E-cadherin (CDH1), cell adhesion molecule 1 (CADM1), and syndecan-2 (SDC2). Similar findings were observed in uveal melanoma cell lines and single-cell RNA-sequencing data from uveal melanoma patient samples. BAP1 reexpression in uveal melanoma cells reduced E-cadherin and CADM1 levels. Functionally, knockdown of E-cadherin decreased spheroid cluster formation and knockdown of CADM1 decreased growth of BAP1-mutant uveal melanoma cells. Together, our findings demonstrate that BAP1 regulates the expression of CAMs which may regulate metastatic traits.

Implications: BAP1 mutations and increased metastasis may be due to upregulation of CAMs.


Figures

Figure 1.
Figure 1.
BAP1 mutations are correlated with increased expression of CAMs CDH1, CADM1, and SDC2. A, On the basis of BAP1 mutation and copy loss, TCGA uveal melanoma samples were stratified into BAP1 mutant and wild-type groups. Differential expression analysis was performed between BAP1 mutant (n ¼ 40) and wild-type (n ¼ 40) samples and used for performing GSEA. GSEA enrichment plots of the Hallmark epithelial to mesenchymal and KEGG CAMs) gene sets in BAP1 mutant versus wild-type groups are shown. B, A heatmap showing z-score values for the top 10 genes from the Hallmark EMT and KEGG CAMs gene sets in TCGA uveal melanoma patient tumor samples. C, CDH1, CADM1, and SDC2 gene expression from TCGA RNA-seq data in BAP1 wild-type (n ¼ 40) and mutant samples (n¼40). D, Analysis of TCGAdata for uveal melanoma patient progression-free survival according to CDH1, CADM1, and SDC2 expression, stratified by high or low median RNA expression. Log-rank test was used to determine the significance of progression-free survival (https://wiki.nci.nih.gov/plugins/servlet/mobile#content/view/24279961).
Figure 2.
Figure 2.
BAP1 mutant and wild-type uveal melanoma cell line panel shows differential expression of CDH1, CADM1, and SDC2. Differential expression analysis of RNA-seq data from triplicates of six BAP1 mutant (MM28, MP38, MP46, MP65, WM3618F, and PDX4) and two BAP1 wild-type cell lines (92.1 and MM66) was performed using DESeq2. A, A heatmap showing average expression of six BAP1 mutant and two wild-type cell lines for the top 10 positively enriched KEGG CAMs pathway genes. B, Box plots of CDH1, CADM1, and SDC2 mRNA expression in BAP1 mutant (n ¼ 18) versus wild-type (n ¼ 6) cell line samples. C, A volcano plot showing antibodies targeting genes from the KEGG CAM pathway from the RPPA data. D, A heatmap of median-centered, log2-transformed RPPA data for the top and bottom five proteins ranked by the product of the fold change and log10(Benjamini–Hochberg FDR), when comparing BAP1 mutant versus wild-type cell lines. Each cell line was done in triplicate. Proteins are ordered on the basis of hierarchical clustering. E, Uveal melanoma cell line panel showing expression of E-cadherin and CADM1 in BAP1 wild-type versus mutant cell lines. F, Dot plot showing the average expression and percent of cells expressing CDH1, CADM1, and SDC2 from patient tumor scRNA-seq data. Cells were separated into on malignant and tumor-specific malignant cell groups.
Figure 3.
Figure 3.
Changes in CAMs gene expression due to BAP1 reexpression. A, Scatter plots showing fold change mRNA expression values for BAP1 mutant versus BAP1 reexpression or BAP1 mutant versus BAP1 wild-type comparisons from four independent datasets (14, 53) for the KEGG CAMs gene set. Red dots indicate genes with log2 fold changes greater than 1 and BHFDR value of less than 0.05. B, A BAP1-mutant uveal melanoma cell line (53) was transfected with wild-type or mutant BAP1 to produce proficient and deficient reexpressing samples, respectively. Each of the mutant reexpressing and parental samples were compared against the wild-type reexpressing samples. Rank list plots showing the fold change values for genes in the KEGG CAMs pathway for parental (left), mutant A95P reexpressing (middle), and mutant C91W reexpressing (right) samples compared against BAP1 wild-type reexpressing samples. C, Expression of BAP1 in BAP1 mutant cell cline, MP46, was confirmed by Western blot analysis, and protein expression of E-cadherin decreased in MP46-BAP1 cells. MP46-GFP was used as a control. Representative Western blots from triplicate experiments are shown.
Figure 4.
Figure 4.
Knockdown of CDH1 and CADM1 decreases cell cycle– and cell growth–associated protein expression. A, Western blot analysis was used to validate E-cadherin and CADM1 expression levels with either control, CDH1, or CADM1 siRNAs in MP38 cells. B, A heatmap of median-centered, log2-transformed RPPA data for the top proteins (P < 0.05, log2fc > 0.32193) when comparing siCADM1 cells with untreated and siCTL. Each lysate was collected in triplicate (n 3). C, Representative Western blot analysis showing the effect of E-cadherin and CADM1 knockdown on cell-cycle and cell growth proteins. Identical lysates from A were used for the first four blots (phosphoCDK1, cyclin B1, phosphoERK1/2, and ERK1/2), and so the top b-actin loading control was duplicated from A. D, Effect of siCDH1 and siCADM1 on MP38 cell growth was analyzed using the IncuCyte Live Cell Analysis Imaging System. Scale bars, 300 mmol/L. Fold change was calculated as percent confluency compared with day 0, % inhibition was calculated as fold change difference as compared with control, P < 0.05, and P < 0.01 as determined by t test, and error bars are ±SEM.
Figure 5.
Figure 5.
Functional effects of CDH1 and CADM1 knockdown on MP38 cells: Migration of MP38 cells after treatment with CDH1 and CADM1 siRNAs for 72 hours (A). Cells were trypsinized and subjected to Boyden chamber-based, serum-directed migration assays. Quantification of migrated cells and representative images are shown. Scale bars, 250 mmol/L. Data are graphed as fold change in cell migration compared with untreated cells from at least five independent experiments, P < 0.05, and P < 0.01 as determined by t test, and error bars are SEM. B, Effect of siCDH1 and siCADM1 knockdown on cell adhesion. Percent cell adhesion is calculated as (adherent cell fluorescence)/(total cell fluorescence) from four independent experiments, P < 0.05, and P < 0.01 as determined by t test, and error bars are SEM. C, Cell viability as measured by ATP luminescence (Cell Titer Glo) was studied after siCDH1 and siCADM1. Cells were treated with CDH1 and CADM1 siRNAs for 72 hours, trypsinized, and cultured for 72 hours in low attachment conditions. Fold change compared with control was calculated for each replicate, P < 0.05, and P < 0.01 as determined by t test, and error bars are SEM. Data were collected from three independent experiments. D, Effect of siCDH1 and siCADM1 on spheroid size and cluster formation after being cultured on low attachment conditions for 72 hours. Representative microscopy images of MP38 spheroids from six independent biological replicates were taken after 72 hours. Quantitation of spheroid size was determined by Image J, P < 0.05, and P < 0.01 as determined by t test, and error bars are SEM. Scale bars, 500mmol/L.

References

    1. Jensen DE, Proctor M, Marquis ST, Gardner HP, Ha SI, Chodosh LA, et al. BAP1: a novel ubiquitin hydrolase which binds to the BRCA1 RING finger and enhances BRCA1-mediated cell growth suppression. Oncogene 1998;16: 1097–112. - PubMed
    1. Ventii KH, Devi NS, Friedrich KL, Chernova TA, Tighiouart M, Van Meir EG, et al. BRCA1-associated protein-1 is a tumor suppressor that requires deubiquitinating activity and nuclear localization. Cancer Res 2008;68:6953–62. - PMC - PubMed
    1. Campagne A, Lee M, Zielinski D, Michaud A, Le Corre S, Dingli F, et al. BAP1 complex promotes transcription by opposing PRC1-mediated H2A ubiquitylation. Nat Commun 2019;10:348. - PMC - PubMed
    1. Machida YJ, Machida Y, Vashisht AA, Wohlschlegel JA, Dutta A. The deubiquitinating enzyme BAP1 regulates cell growth via interaction with HCF-1. J Biol Chem 2009;284:34179–88. - PMC - PubMed
    1. Bononi A, Giorgi C, Patergnani S, Larson D, Verbruggen K, Tanji M, et al. BAP1 regulates IP3R3-mediated Ca2þ flux to mitochondria suppressing cell transformation. Nature 2017;546:549–53. - PMC - PubMed

Publication types