

Benchmark Dose Modeling Approaches for Volatile Organic Chemicals Using a Novel Air-Liquid Interface In Vitro Exposure System
- PMID: 35426944
- PMCID: PMC9704371
- DOI: 10.1093/toxsci/kfac040
Benchmark Dose Modeling Approaches for Volatile Organic Chemicals Using a Novel Air-Liquid Interface In Vitro Exposure System
Abstract
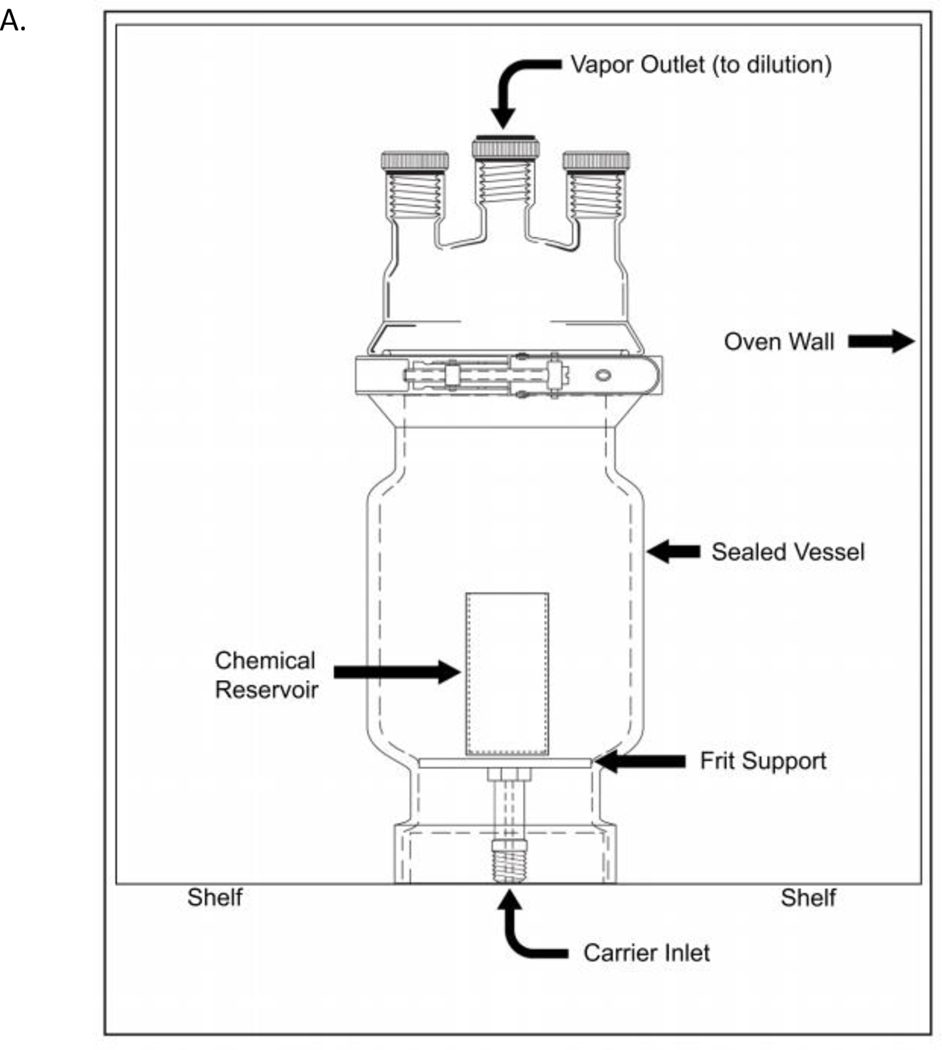
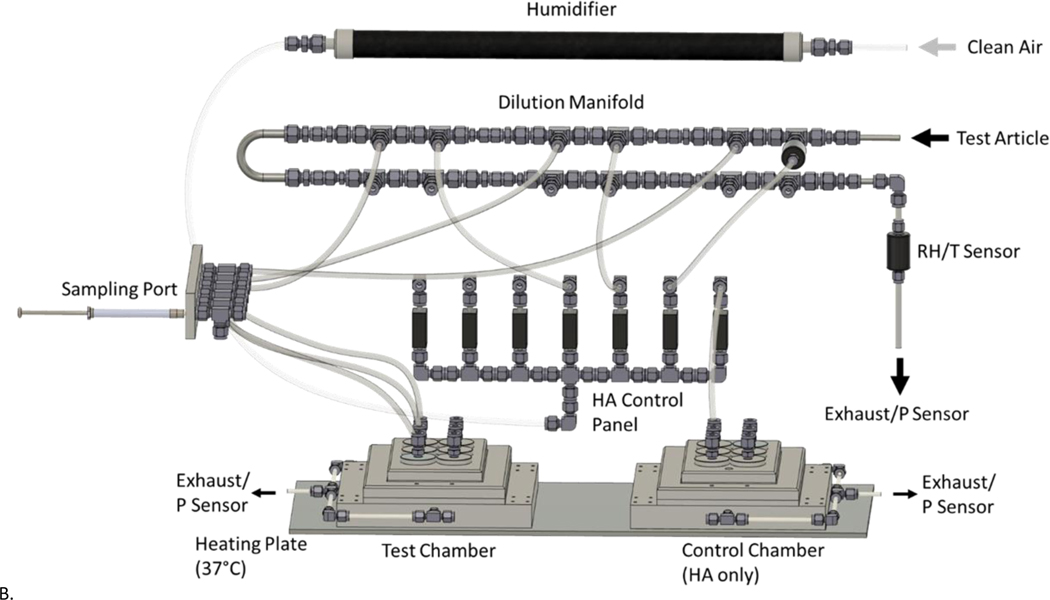
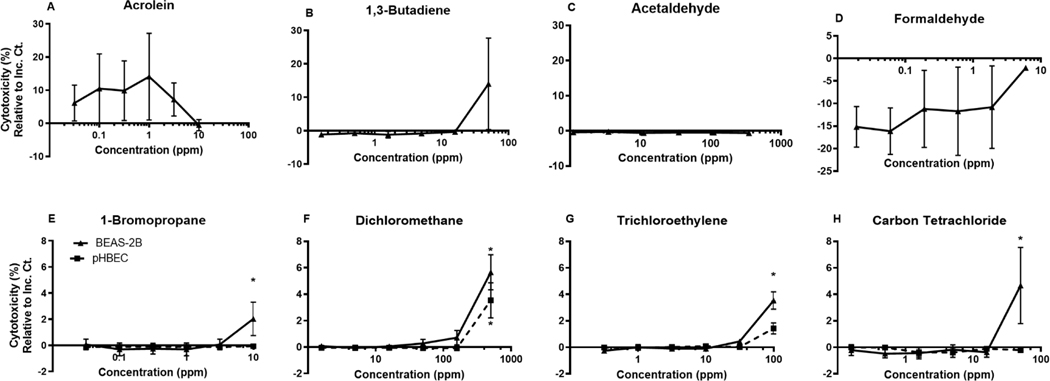
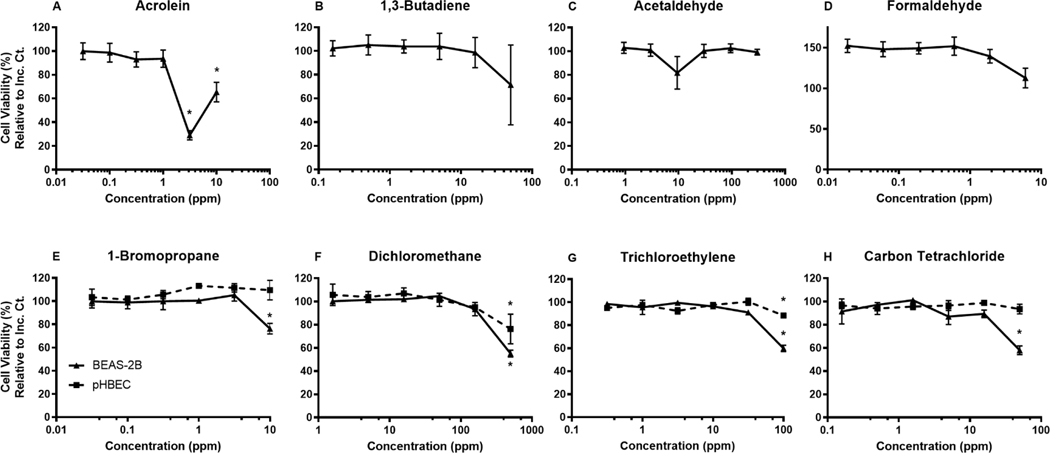
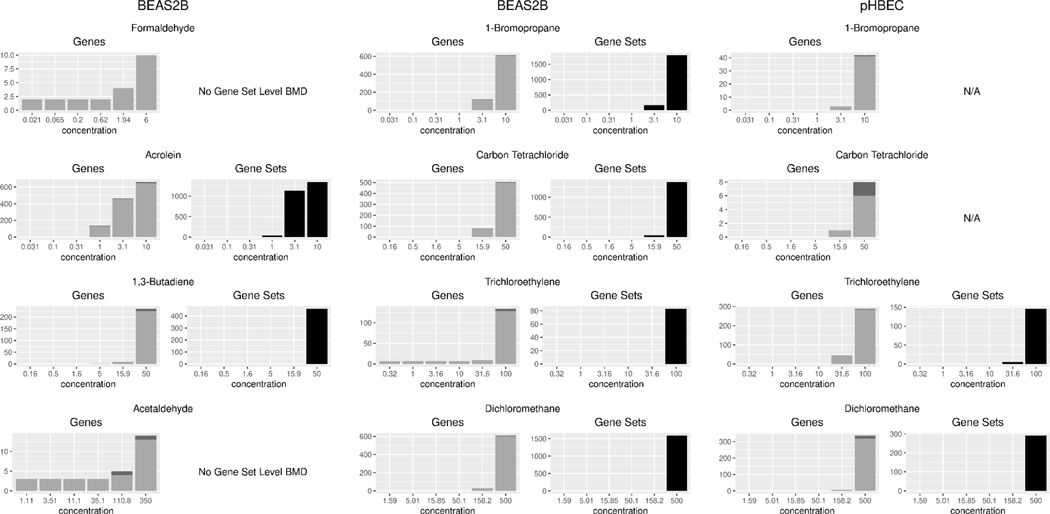
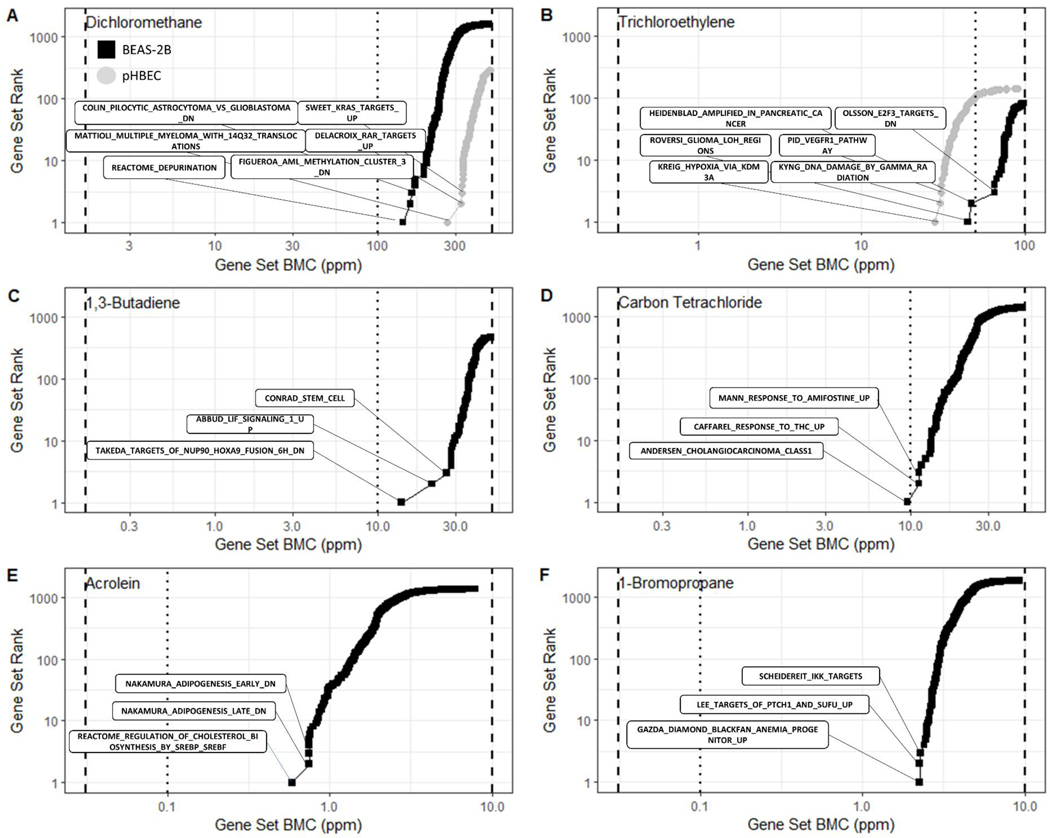
Inhalation is the most relevant route of volatile organic chemical (VOC) exposure; however, due to unique challenges posed by their chemical properties and poor solubility in aqueous solutions, in vitro chemical safety testing is predominantly performed using direct application dosing/submerged exposures. To address the difficulties in screening toxic effects of VOCs, our cell culture exposure system permits cells to be exposed to multiple concentrations at air-liquid interface (ALI) in a 24-well format. ALI exposure methods permit direct chemical-to-cell interaction with the test article at physiological conditions. In the present study, BEAS-2B and primary normal human bronchial epithelial cells (pHBEC) are used to assess gene expression, cytotoxicity, and cell viability responses to a variety of volatile chemicals including acrolein, formaldehyde, 1,3-butadiene, acetaldehyde, 1-bromopropane, carbon tetrachloride, dichloromethane, and trichloroethylene. BEAS-2B cells were exposed to all the test agents, whereas pHBECs were only exposed to the latter 4 listed above. The VOC concentrations tested elicited only slight cell viability changes in both cell types. Gene expression changes were analyzed using benchmark dose (BMD) modeling. The BMD for the most sensitive gene set was within one order of magnitude of the threshold-limit value reported by the American Conference of Governmental Industrial Hygienists, and the most sensitive gene sets impacted by exposure correlate to known adverse health effects recorded in epidemiologic and in vivo exposure studies. Overall, our study outlines a novel in vitro approach for evaluating molecular-based points-of-departure in human airway epithelial cell exposure to volatile chemicals.
Keywords: in vitro; VOC; benchmark dose; cell culture exposure system; inhalation; transcriptomics.
Published by Oxford University Press on behalf of the Society of Toxicology 2022.
Conflict of interest statement
Conflict of Interest/Disclosure
The authors declare no conflict of interest. This manuscript has been reviewed by the Center for Public Health & Environmental Assessment, U.S. Environmental Protection Agency, and approved for publication. Approval does not signify that the contents reflect the views of the Agency, nor does mention of trade names or commercial products constitute endorsement or recommendation for use.
Competing financial interests: The authors declare they have no actual or potential competing financial interests
Figures
References
-
- ACGIH. 2018. 2018 tlvs® and beis® : Based on the documentation of the threshold limit values for chemical substances and physical agents & biological exposure indices. ACGIH.
-
- Adams EM, Spencer HC, Rowe VK, Mc CD, Irish DD. 1952. Vapor toxicity of carbon tetrachloride determined by experiments on laboratory animals. AMA Arch Ind Hyg Occup Med. 6(1):50–66. - PubMed
-
- Akaike H. 1974. New look at statistical-model identification. Ieee Transactions on Automatic Control. Ac19(6):716–723.
-
- Alabdulhadi A, Ramadan A, Devey P, Boggess M, Guest M. 2019. Inhalation exposure to volatile organic compounds in the printing industry. J Air Waste Manag Assoc. 69(10):1142–1169. - PubMed
-
- Albert RE, Sellakumar AR, Laskin S, Kuschner M, Nelson N, Snyder CA. 1982. Gaseous formaldehyde and hydrogen chloride induction of nasal cancer in the rat. J Natl Cancer Inst. 68(4):597–603. - PubMed
Publication types
MeSH terms
Substances
Grants and funding
LinkOut - more resources
Full Text Sources
Molecular Biology Databases
