. 2022 Apr 15;7(70):eabl9165.
doi: 10.1126/sciimmunol.abl9165. Epub 2022 Apr 15.

Classification of human chronic inflammatory skin disease based on single-cell immune profiling

Affiliations

Classification of human chronic inflammatory skin disease based on single-cell immune profiling

Yale Liu et al. Sci Immunol. .

Abstract

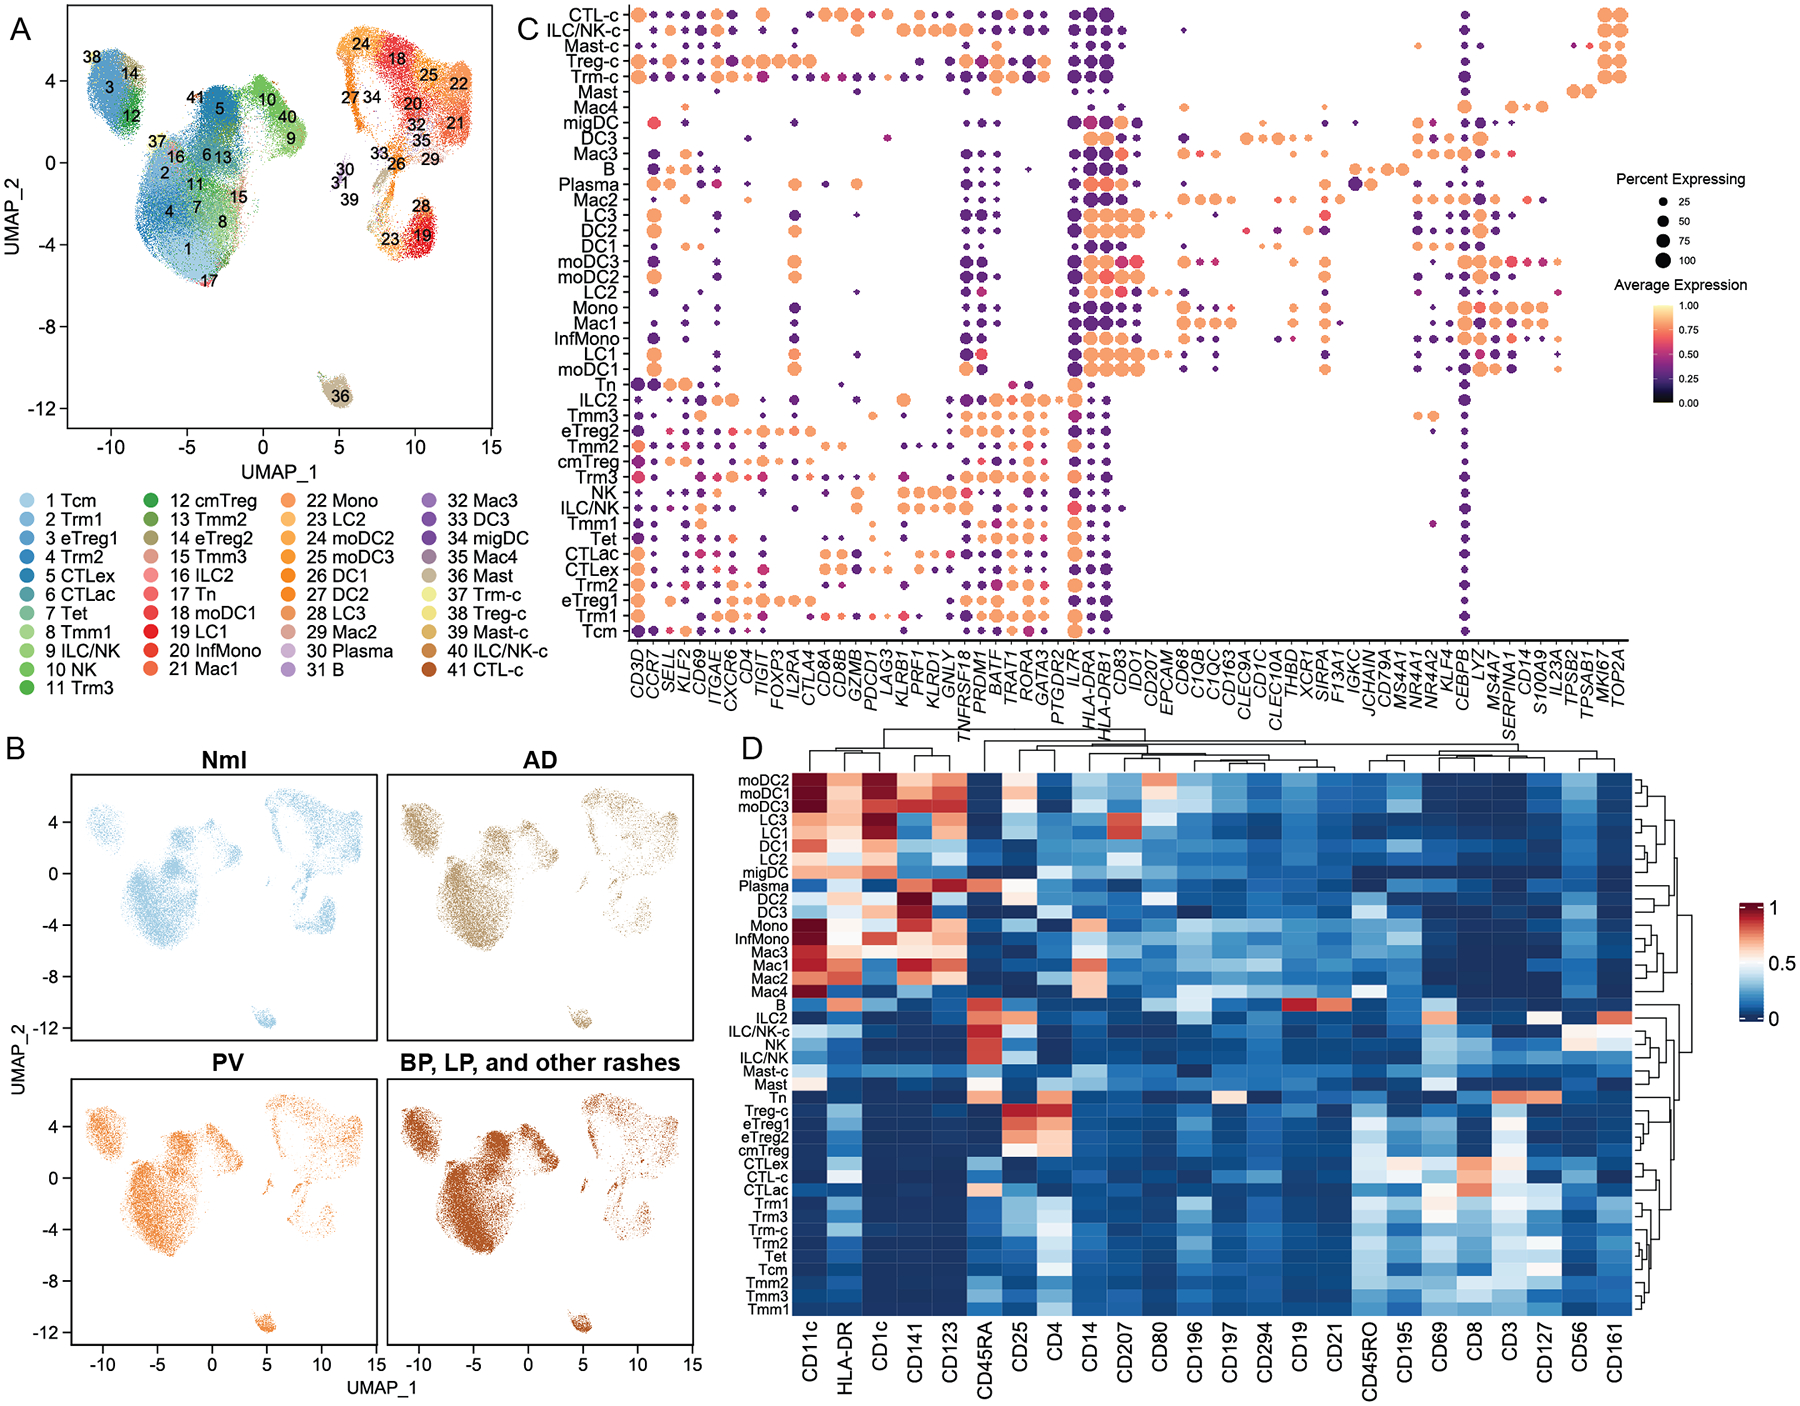
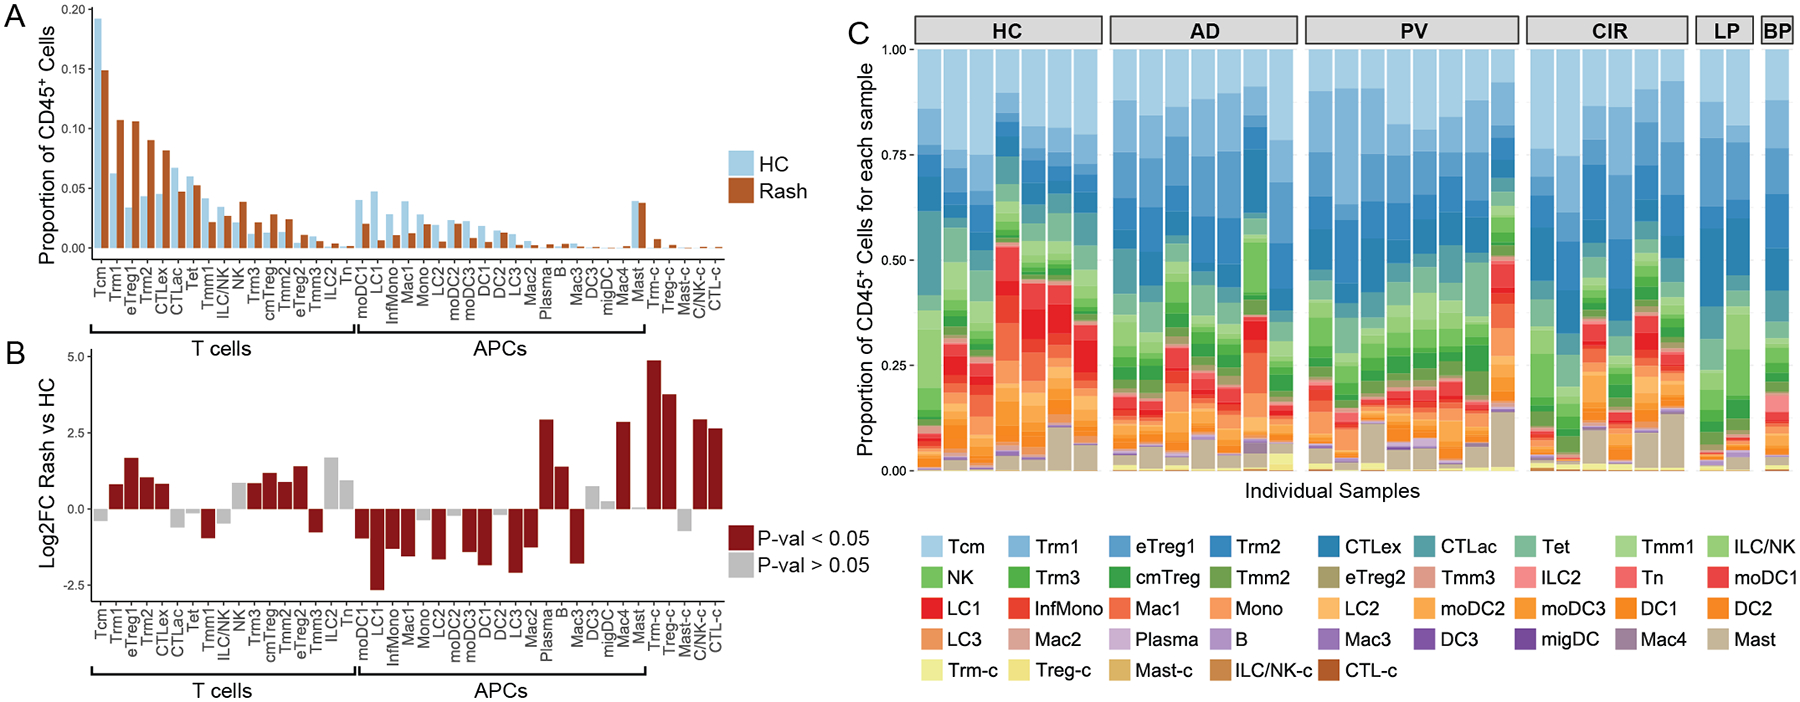
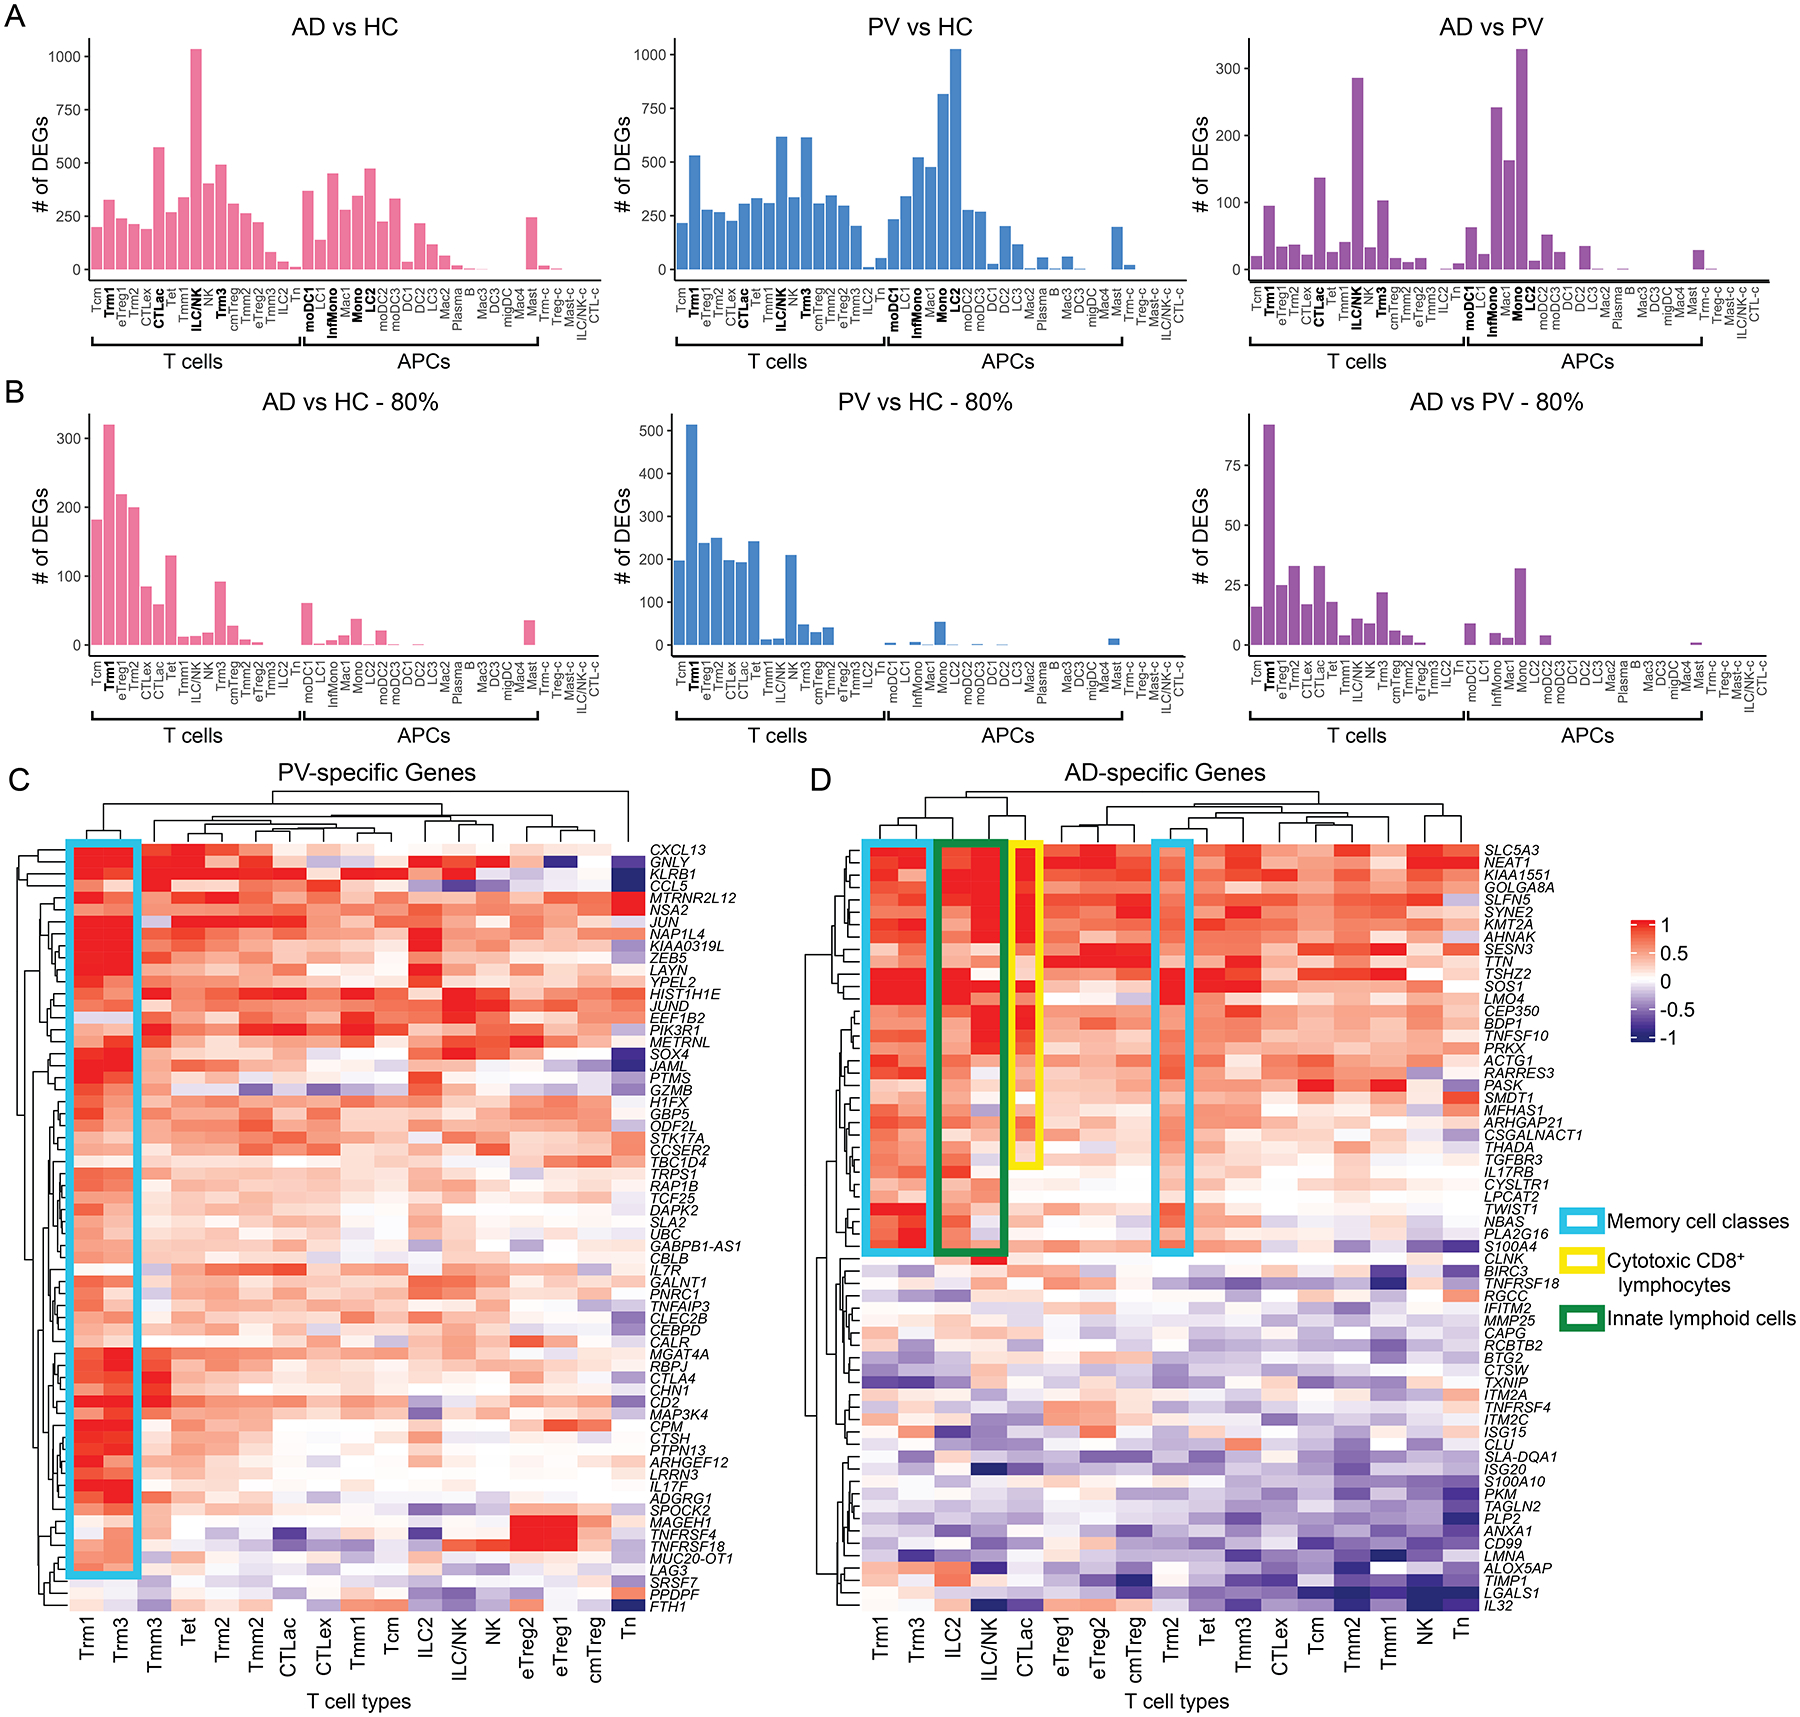
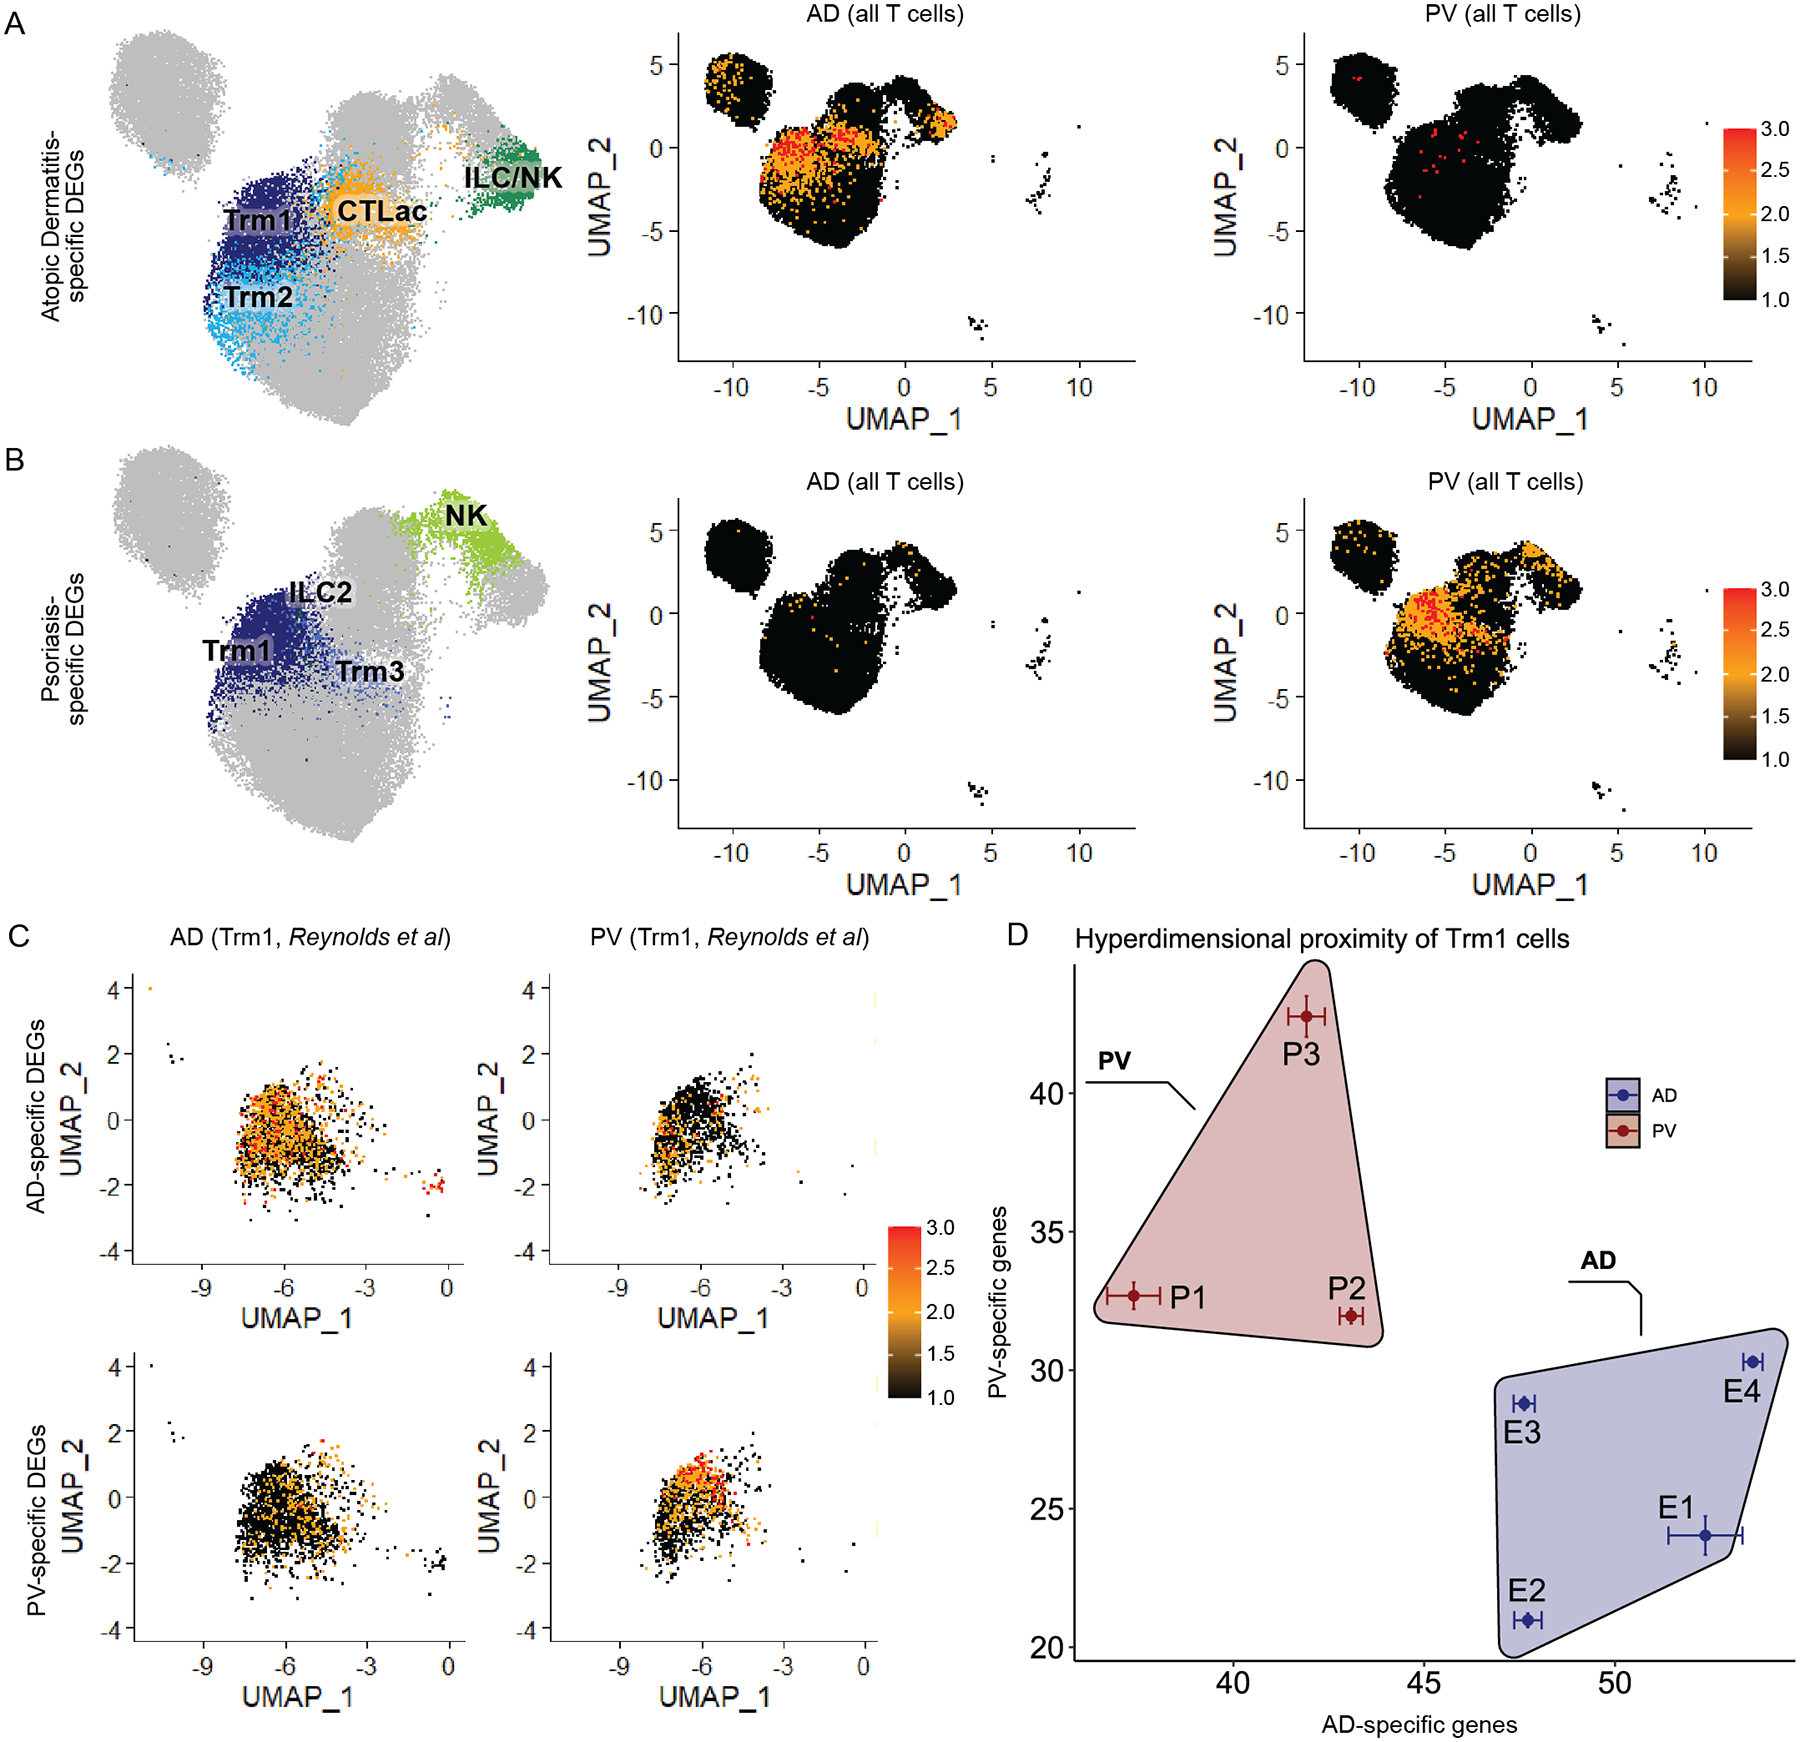
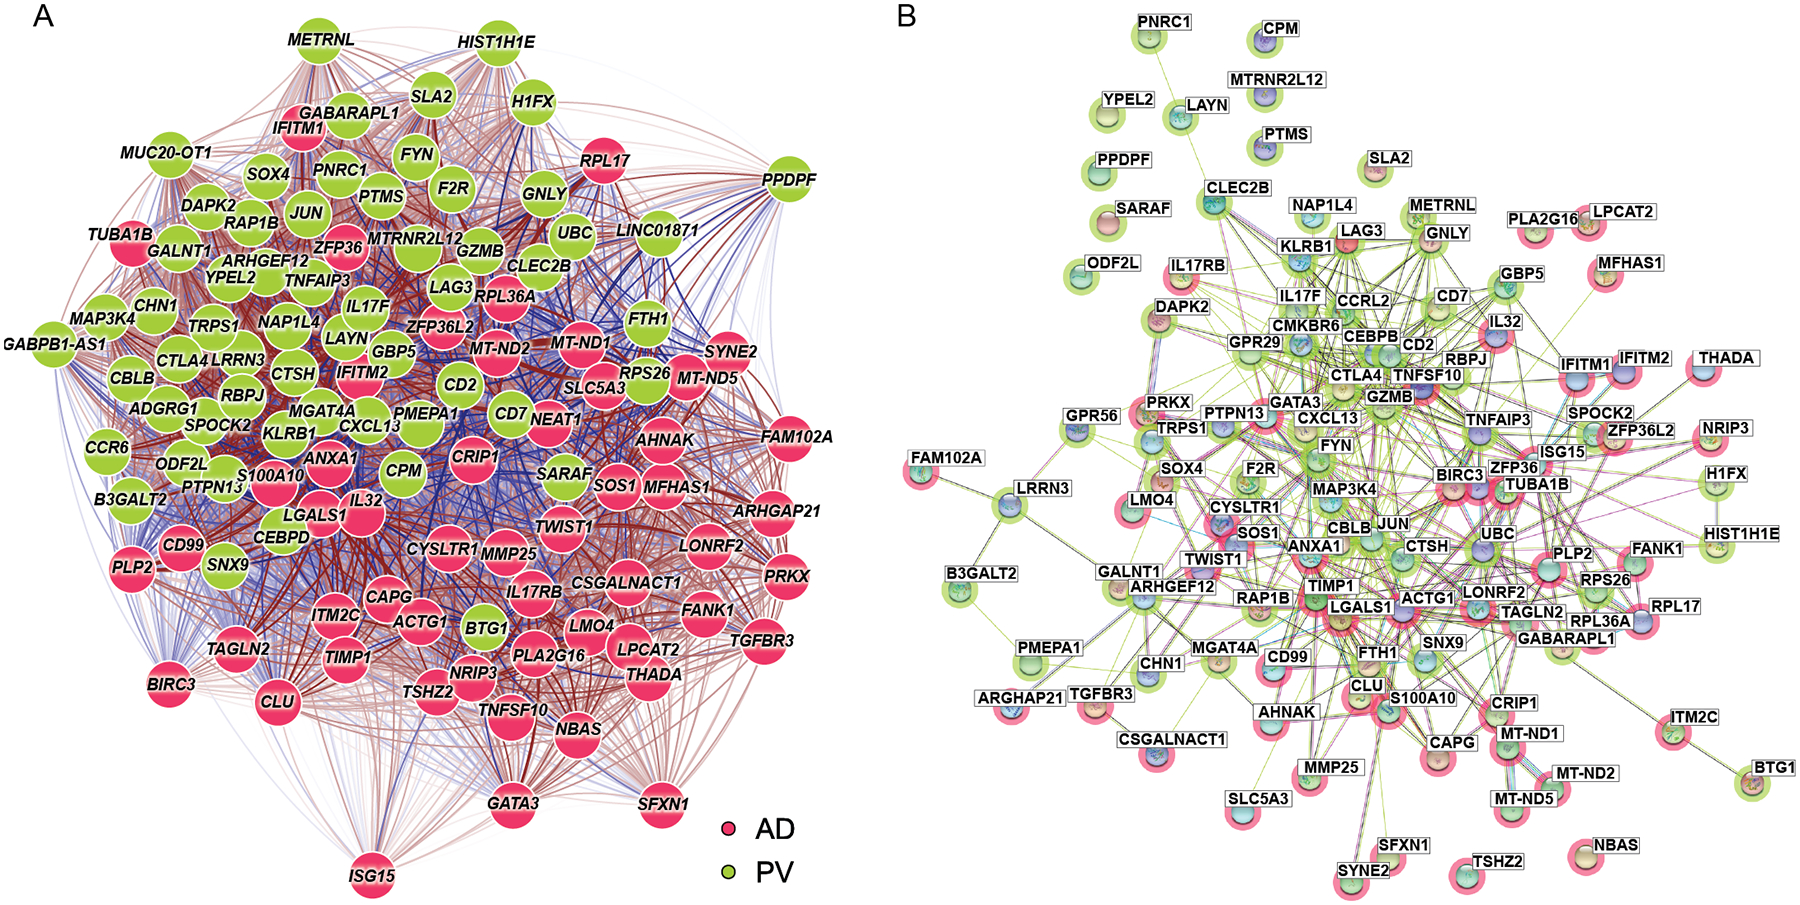
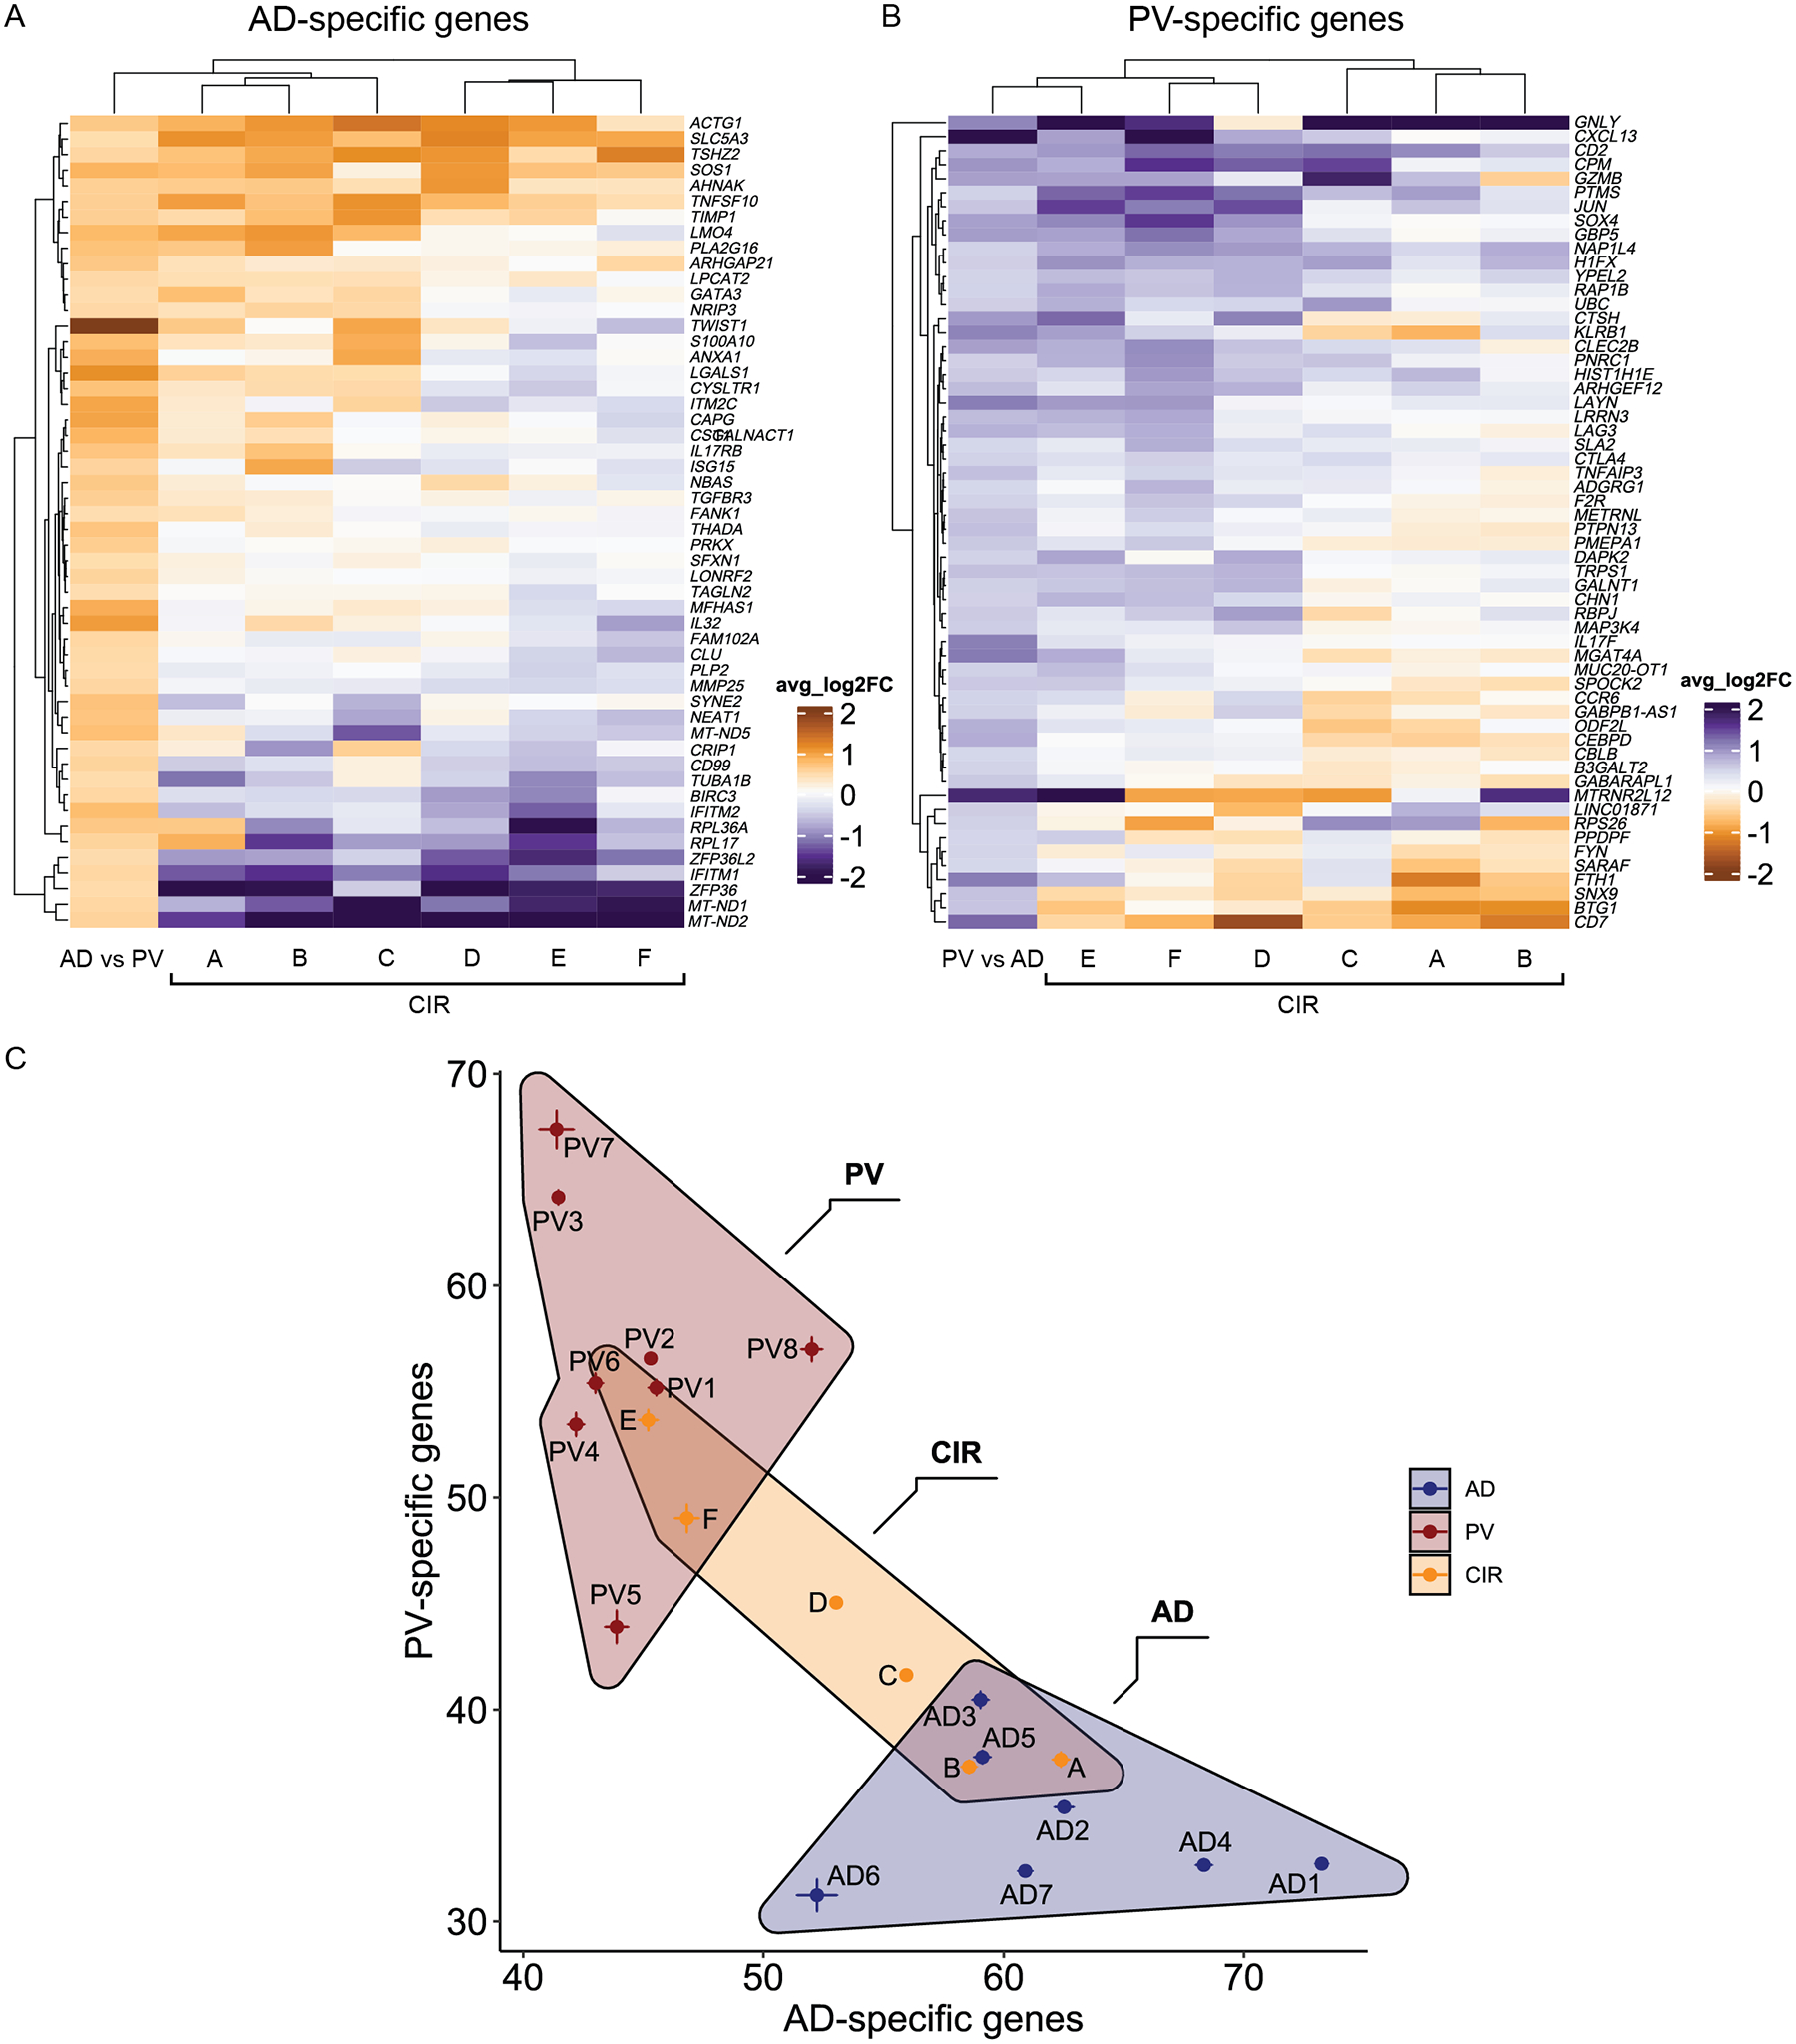
Inflammatory conditions represent the largest class of chronic skin disease, but the molecular dysregulation underlying many individual cases remains unclear. Single-cell RNA sequencing (scRNA-seq) has increased precision in dissecting the complex mixture of immune and stromal cell perturbations in inflammatory skin disease states. We single-cell-profiled CD45+ immune cell transcriptomes from skin samples of 31 patients (7 atopic dermatitis, 8 psoriasis vulgaris, 2 lichen planus (LP), 1 bullous pemphigoid (BP), 6 clinical/histopathologically indeterminate rashes, and 7 healthy controls). Our data revealed active proliferative expansion of the Treg and Trm components and universal T cell exhaustion in human rashes, with a relative attenuation of antigen-presenting cells. Skin-resident memory T cells showed the greatest transcriptional dysregulation in both atopic dermatitis and psoriasis, whereas atopic dermatitis also demonstrated recurrent abnormalities in ILC and CD8+ cytotoxic lymphocytes. Transcript signatures differentiating these rash types included genes previously implicated in T helper cell (TH2)/TH17 diatheses, segregated in unbiased functional networks, and accurately identified disease class in untrained validation data sets. These gene signatures were able to classify clinicopathologically ambiguous rashes with diagnoses consistent with therapeutic response. Thus, we have defined major classes of human inflammatory skin disease at the molecular level and described a quantitative method to classify indeterminate instances of pathologic inflammation. To make this approach accessible to the scientific community, we created a proof-of-principle web interface (RashX), where scientists and clinicians can visualize their patient-level rash scRNA-seq-derived data in the context of our TH2/TH17 transcriptional framework.


Figures

Fig. 1.
Fig. 1.. Immune single cell landscape of rash-affected and normal human skin (31 samples).
A) UMAP representation of 41 single cell RNA-sequencing (scRNA-seq) defined immune cell classes. B) UMAP representation of cell distribution across immune cell classes for disease classes and healthy control skin. C) Expression of critical marker transcripts (columns) distinguishing immune cell classes (rows). Size of dots represents the fraction of cells expressing a particular marker, and color intensity indicates mean normalized scaled expression levels. D) Expression of protein epitope (CITE-seq) markers for the 41 transcript-based immune cell clusters. Color intensity represents fraction of cells expressing a given marker.
Fig. 2.
Fig. 2.. Enrichment of Treg, Trm, and exhausted CD8+T cell populations in rash-affected skin.
A) Distribution of immune cell populations for 7 healthy control (HC) and 24 rash-affected (Rash) skin samples. X-axis represents different immune cell populations. Y-axis represents proportion of CD45+ immune cells for each immune cell population in either rash-affected or normal skin. B) Quasi-binomial model Log2 fold change for rash-affected versus healthy control skin (Y-axis). X-axis represents different immune cell populations. Unpaired two sample t-test was used. Red colored bars indicate statistically significant changes (p-value < 0.05). C) Proportion of cells in each CD45+ immune cell population for each individual sample.
Fig. 3.
Fig. 3.. Conservatively selected transcriptional abnormalities discriminating psoriasis and atopic dermatitis demonstrate cell-type specific patterning.
A) Number of DEGs per immune cell population for atopic dermatitis (AD) and psoriasis (PV) based on MAST statistical framework. Number of DEGs (adjust-p-val < 0.001, absolute log2FC > 0.425; on y-axis) for each immune cell population (x-axis) for 7 AD versus 7 healthy control (HC) sample comparisons (left), 8 PV versus 7 HC samples (middle), and 7 AD versus 8 PV samples (right). B) Number of DEGs per immune cell population for AD and PV comparisons as in A but for DEGs present in 80% of samples from a disease class. C and D) Heatmap showing immune cell population-specific transcriptional patterns for PV-specific genes (C) and AD-specific genes (D) (Table S7) across lymphocyte subtypes (columns). Color key reflects the avg_log2FC for 8 PV versus 7 HC samples (C) or 7 AD versus 7 HC samples (D).
Fig. 4.
Fig. 4.. Atopic dermatitis and Psoriasis vulgaris -specific gene module scores are elevated for their respective disease classes and classify samples from an external dataset.
A) AD- and B) PV-specific lymphocyte DEG gene set (Table S7) expression scores (calculated by Seurat AddModuleScore) displayed for lymphocytes on a single cell level from 7 AD samples (middle panels) and 8 PV samples (right panels) in pseudocolored feature plots. Left panels label cell populations that corresponded to high scoring AD and PV gene set scores. C) AD- and PV- specific Trm1 DEG gene set (Table S7) scores displayed on a single cell level for Trm1 cells in pseudocolored feature plots for four atopic dermatitis (left) or three psoriasis (right) samples from the Reynolds et al dataset. D) Hyperdimensionality plot classification of Reynolds et al. AD and PV validation cohort using AD- and PV- specific Trm1 DEG gene set modules (Table S7).
Fig. 5.
Fig. 5.. Atopic dermatitis and Psoriasis vulgaris -specific DEGs segregate discretely based on unbiased pathway and network analysis.
A) Transcriptional network (qgraph) for Trm1 AD- and PV- specific genes (Table S7). The Fruchterman-Reingold algorithm was used to determine the network layout. Color shading of the gene nodes denotes AD (green) or psoriasis (red)–upregulated genes. Red lines represent positive correlation while blue lines represent negative correlation. Edges and links are shown for the correlation values from scRNA-seq data, with stronger edge intensity or thicker connecting links signifying higher correlation. B) STRING protein-protein network analysis for the same Trm1 AD- and PV- specific genes. Color shading of the nodes denotes AD (green) or psoriasis (red)–specific genes.
Fig. 6.
Fig. 6.. Clinical/histopathologically Indeterminate Rashes (CIRs) show molecular stratification with atopic dermatitis or psoriasis-specific DEGs.
A) Heatmap showing relative expression levels (avg_log2FC) for each CIR Trm1 cell population relative to Trm 1 cells from all 7 healthy controls. Column 1 shows avg_log2FC values for Trm1 cells from 7 AD versus 8 PV samples. Genes depicted are Trm1 AD-specific genes (Table S7). B) Same as A except genes depicted are Trm1 PV-specific genes (Table S7). Column 1 shows avg_log2FC values for Trm1 cells from all PV versus all AD samples. C) Hyperdimensionality plot showing stratification of CIR samples relative to AD and PV samples. Each AD, PV, and CIR sample is mapped based on aggregate gene score of Trm1 population AD-specific genes (x-axis) and PV-specific genes (y-axis). One-sided Mann-Whitney tests used to calculate significance and p-values shown in Table S8.

References

    1. Rachakonda TD, Schupp CW, Armstrong AW, Psoriasis prevalence among adults in the United States. J Am Acad Dermatol 70, 512–516 (2014). - PubMed
    1. Shaw TE, Currie GP, Koudelka CW, Simpson EL, Eczema prevalence in the United States: data from the 2003 National Survey of Children’s Health. J Invest Dermatol 131, 67–73 (2011). - PMC - PubMed
    1. Chiesa Fuxench ZC, Block JK, Boguniewicz M, Boyle J, Fonacier L, Gelfand JM, Grayson MH, Margolis DJ, Mitchell L, Silverberg JI, Schwartz L, Simpson EL, Ong PY, Atopic Dermatitis in America Study: A Cross-Sectional Study Examining the Prevalence and Disease Burden of Atopic Dermatitis in the US Adult Population. J Invest Dermatol 139, 583–590 (2019). - PubMed
    1. Simpson EL, Bieber T, Guttman-Yassky E, Beck LA, Blauvelt A, Cork MJ, Silverberg JI, Deleuran M, Kataoka Y, Lacour J-P, Kingo K, Worm M, Poulin Y, Wollenberg A, Soo Y, Graham NMH, Pirozzi G, Akinlade B, Staudinger H, Mastey V, Eckert L, Gadkari A, Stahl N, Yancopoulos GD, Ardeleanu M, Two Phase 3 Trials of Dupilumab versus Placebo in Atopic Dermatitis. N Engl J Med 375, 2335–2348 (2016). - PubMed
    1. Ferreira S, Guttman-Yassky E, Torres T, Selective JAK1 Inhibitors for the Treatment of Atopic Dermatitis: Focus on Upadacitinib and Abrocitinib. Am J Clin Dermatol 21, 783–798 (2020). - PubMed

Publication types