. 2022 Apr 15;7(70):eabl7482.
doi: 10.1126/sciimmunol.abl7482. Epub 2022 Apr 15.

A common framework of monocyte-derived macrophage activation

Affiliations

A common framework of monocyte-derived macrophage activation

David E Sanin et al. Sci Immunol. .

Abstract

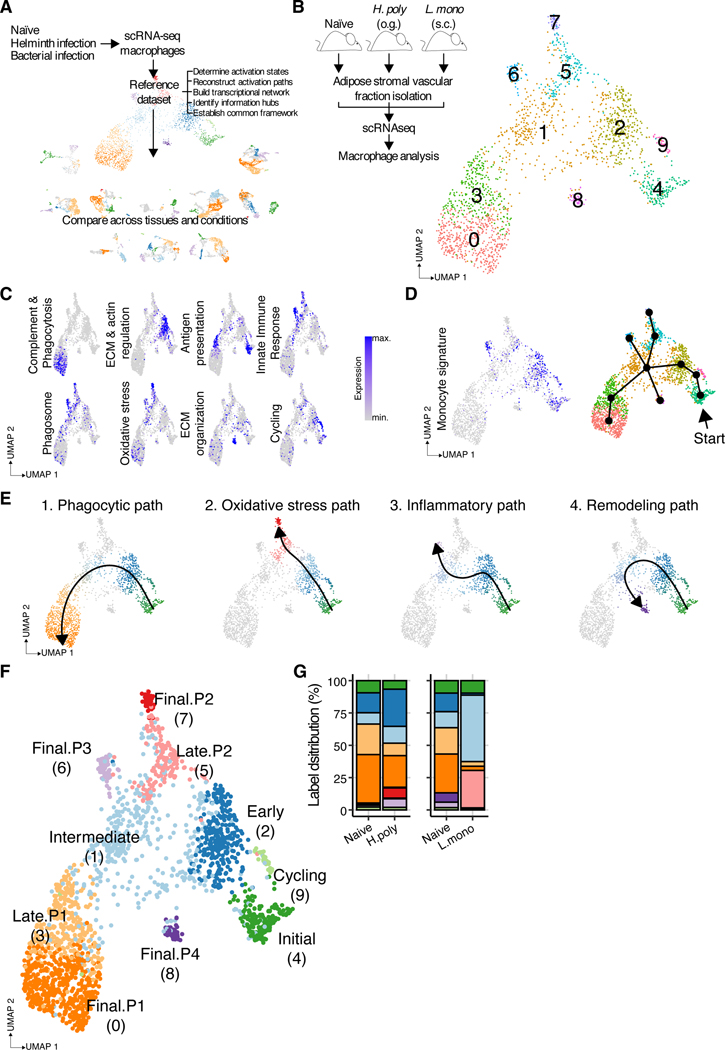
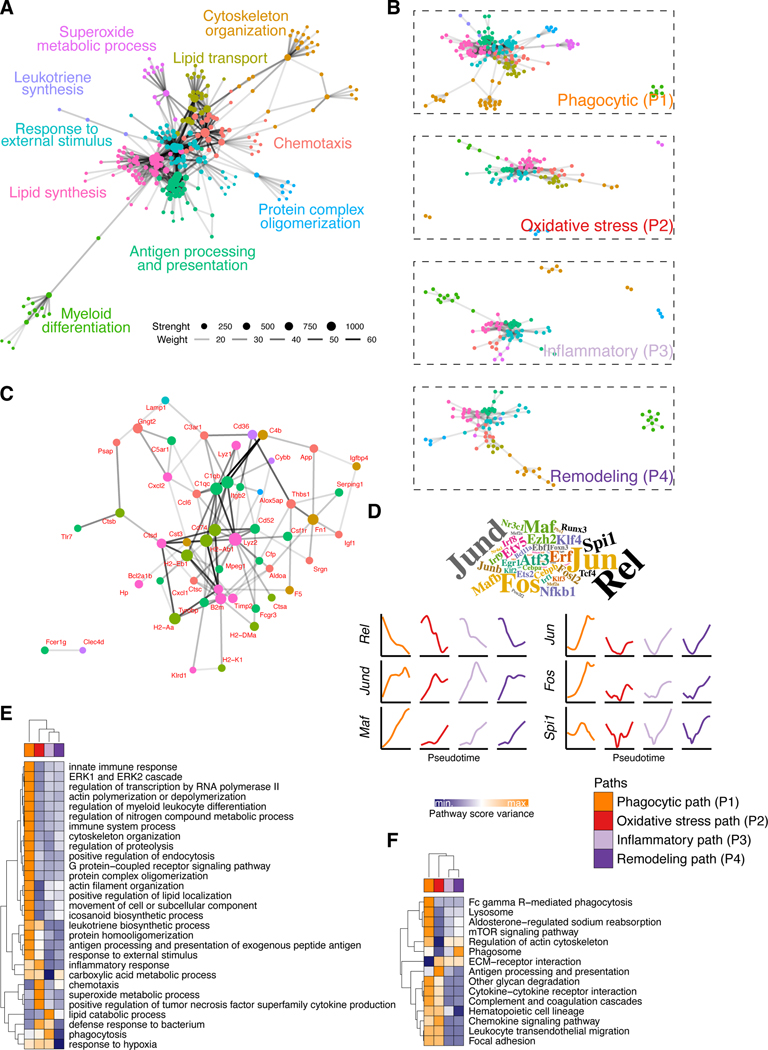
Macrophages populate every organ during homeostasis and disease, displaying features of tissue imprinting and heterogeneous activation. The disconnected picture of macrophage biology that has emerged from these observations is a barrier for integration across models or with in vitro macrophage activation paradigms. We set out to contextualize macrophage heterogeneity across mouse tissues and inflammatory conditions, specifically aiming to define a common framework of macrophage activation. We built a predictive model with which we mapped the activation of macrophages across 12 tissues and 25 biological conditions, finding a notable commonality and finite number of transcriptional profiles, in particular among infiltrating macrophages, which we modeled as defined stages along four conserved activation paths. These activation paths include a "phagocytic" regulatory path, an "inflammatory" cytokine-producing path, an "oxidative stress" antimicrobial path, or a "remodeling" extracellular matrix deposition path. We verified this model with adoptive cell transfer experiments and identified transient RELMɑ expression as a feature of monocyte-derived macrophage tissue engraftment. We propose that this integrative approach of macrophage classification allows the establishment of a common predictive framework of monocyte-derived macrophage activation in inflammation and homeostasis.


Conflict of interest statement

Competing interests: The remaining authors declare no competing interests.

Figures

Fig. 1.
Fig. 1.. Macrophage activation in inflamed tissues follows predefined paths.
(A) Schematic depiction of reference dataset construction, outlining overall goals of strategy. (B) scRNA-seq analysis of macrophages (cells = 2000) from the stromal vascular fraction (SVF) of adipose tissue from naïve, H. poly or L. mono infected animals (n = 1–8 per group) shown as a UMAP, highlighting identified clusters. (C) Relative levels (low - gray; high - blue) of gene set scores associated with identified clusters. (D) Relative levels (low - gray; high - blue) of gene set scores associated with Monocyte signature (left) and predicted lineage breaking points (right). (E) Lineage and pseudotime calculation showing activation trajectories. Cells assigned to identified paths are colored to match stage labels. Non-participating cells are shown in gray. (F) UMAP labeled according to path progression indicating shared (Initial > Early > Intermediate) and path specific (Phagocytic: Late.P1 > Final.P1; Oxidative stress: Late.P2 > Final.P2; Inflammatory: Final.P3; Remodeling: Final.P4) macrophage activation-stages. Cluster number indicated in brackets. (G) Activation-stage distribution shown as a percentage of total cells per biological condition.
Fig. 2.
Fig. 2.. Macrophage gene expression can be modeled as a function of activation, revealing a transitory stage of RELMɑ expressing cells.
(A) Macrophage activation-stage UMAP, showing an example of a fitted general additive model (GAM) for gene expression as a function of pseudotime. (B) Top most significant GAM fits for genes associated with identified paths, showing single cells gene expression (dots - color matching activation-stage) as a function of pseudotime (x axis) for each activation path, with fitted models (black lines) and associated adjusted p values also shown. (C) Fitted GAM models (colored lines matching activation paths) of gene expression of macrophage activation markers (y axis - fixed across all paths for each gene) as a function of pseudotime (x axis - specific to each path). (D) Relative expression of RELMɑ coding gene Retnla and Ear2 shown as violin plots for each activation-stage (left) or as a fitted GAM models specifically for each activation path (right). (E) Schematic view of experimental set up for adoptive bone marrow monocyte transfer from donor (CD45.1+) mice into the peritoneal cavity of naïve recipients (CD45.2+). (F) Representative density flow cytometry plots (left) and quantification of percentage cells (right) expressing RELMɑ protein and mRNA (Retnla) in adoptively transferred bone marrow monocytes recovered from the peritoneal cavity of recipient mice at indicated times. Individual dots represent biological replicates from combined experiments (n = 10 across 2 repeats). Significant differences at each stage compared to day 2 are indicated (****: p value < 0.0001) based on single factor ANOVA analysis followed by Tukey Honest Significant Differences test. (G) Quantification of percentage macrophages expressing RELMɑ 4 days post-adoptive cell transfer within host large peritoneal macrophages, adoptively transferred IL-4Rɑ sufficient (IL-4Rɑ+/+) or deficient (IL-4Rɑ−/−) monocytes (left), or in adoptively transferred large peritoneal macrophages (right). Individual dots represent biological replicates (n = 4–18). Significant differences at each stage compared to host macrophages are indicated (**: p value < 0.01; *: p value < 0.05; ns: p value > 0.05) or between transferred cells (ns: p value > 0.05) based on single factor ANOVA analysis followed by Tukey Honest Significant Differences test. (H) Quantification of transferred RELMɑ sufficient (RELMɑ+/+) or deficient (RELMɑ−/−) macrophages 8 days post-adoptive cell transfer (top). Representative flow cytometry dot plots of indicated markers and quantification of proportion CD115+F4/80+ cells within adoptively transferred cells (bottom). Individual dots represent biological replicates (n = 5). Significant differences are indicated (***: p value < 0.001; *: p value < 0.05) based on Tukey Honest Significant Differences test.
Fig. 3.
Fig. 3.. Macrophage activation-stages are conserved across tissues and inflammatory conditions.
(A-I) Top left - UMAP of macrophages from indicated tissue and condition labelled according to predicted activation-stage, including “Not classified” cells (gray). Top right - Label probability distribution from indicated tissue and condition, showing confidence threshold (dashed blue line) for label assignment. Bottom right - Stage distribution shown as a percentage of total cells per biological condition, colored to match predicted labels. Bottom left - UMAP of relative expression (low - gray; high - blue) of Retnla and Ear2. Cell numbers: Lamina propria - 332; Sciatic nerve - 1500; Breast tumor - 1000; Atherosclerotic plaque - 1000; Liver - 1800; Lung - 1000; Heart - 773; Retina - 897; Skeletal muscle - 1000.
Fig. 4.
Fig. 4.. Dysregulation of path-associated gene expression results in pathological macrophage activation stalling.
(A) Label probability distribution of microglial datasets obtained from mice at indicated developmental stages. (B) UMAP with stage labels from macrophages obtained from atherosclerotic plaque regressing (black) and progressing (dark pink) lesions. (C, H) Percentage of Late.P1 cells per biological condition. (D) Significantly (adjusted p value < 0.01) regulated genes (log fold change > 0.25) in Progressing compared to Regressing lesion macrophages. (E, J) Fitted GAM models for expression of differentially regulated genes (y axis) as a function of Phagocytic path pseudotime (x axis) indicating Late.P1 stage (dashed vertical lines). (F) UMAP with stage labels from macrophages obtained from spontaneous breast cancer tumors in animals with a macrophage specific Dab2 deletion (Dab2 KO - light blue) and wild type littermates (WT - orange). (G) Violin plot of relative Dab2 expression across activation-stages. (I) Significantly (adjusted p value < 0.01) regulated genes (log fold change > 0.25) in Dab2 KO compared to WT macrophages.
Fig. 5.
Fig. 5.. Wound macrophage recruitment confirms activation path model.
(A) UMAP with stage labels from macrophages (cells = 1061) obtained from wounded skin biopsies 4 and 14 days post-wounding (n = 5–9). (B) Schematic overview of experimental set up for adoptive tdRFP+ monocyte transfer into wounded animals. (C) Label probability distribution showing confidence threshold (dashed blue line) for label assignment. (D) Stage distribution shown as a percentage of total cells per biological condition, colored to match predicted labels. (E) UMAP with tdRFP+ monocytes labeled in red. (F) tdRFP+ fluorescence intensity (FI) in all cells across predicted labels. FI threshold for transferred cell detection is indicated as a dashed line. (G) Stage distribution shown as a percentage of total tdRFP+ cells per biological condition, colored to match predicted labels. (H) Relative expression (low - gray; high - blue) in tdRFP+ cells of Retnla and Ear2 shown as UMAPs (left) and as violin plots for each activation-stage (right). (I-K) UMAP calculated based on indexed flow cytometry data, labeled with predicted activation-stages (I), k means clustering (J) or tdRFP+ monocytes (K). (L) Stage distribution shown as a percentage of total cells per flow cytometry cluster, colored to match predicted labels. (M) Relative mean fluorescence intensity (MFI; low - blue; high - orange) in flow cytometry clusters.
Fig. 6.
Fig. 6.. Cross-condition data integration reveals stage-specific marker genes.
(A) Activation-stage distribution shown as percentages of total cells per biological condition and tissue. Scale was modified with a square-root transformation for ease of visualization. (B) Schematic overview of data reprocessing strategy. (C-D) Integrated UMAP of macrophages (cells = 2843) across conditions and tissues labeled with identified clusters (C) or previously assigned activation-stages (D). (E) Dot plot of top significantly (adjusted p value < 0.01) regulated genes (log fold change > 0.25) across activation-stages. (F) Dot plot of top significantly regulated genes associated with GO term “Cell surface” (GO:0009986) across activation-stages selected for flow cytometry analysis. Gene (bottom) and protein (top) names are shown. (G) Schematic view of experimental peritonitis. (H) UMAP calculated based on spectral flow cytometry data for macrophages from naive mice, or after 1, 4 and 8 days of L. mono i.p. injection. Cells are colored according to assigned stage (top), sample group (middle) or RELMɑ fluorescence intensity (bottom). Proposed gating markers for each assigned stage are infected (right). Data was concatenated from 10.000 macrophages per independent biological replicate (n = 11). (I) Population dynamics across samples indicated as a mean percentage of total macrophages (left) or scaled for each population ().
Fig. 7.
Fig. 7.. Macrophage transcriptional network across activation paths.
(A) Transcriptional network of protein-protein interactions, depicting genes (n = 242) as nodes and interactions as edges (n = 716). Node size corresponds to calculated strength. Node color is associated with the assigned network cluster. Edge opacity corresponds to calculated weight of interaction. The most enriched GO term associated with each cluster is indicated. (B) Transcriptional network as in A, but split along activation paths, with arbitrary node size and edge opacity. (C) Transcriptional network as in A, limited to nodes with high betweenness (75% quantile) that connect 2 or more clusters. Gene names indicated in red. (D) Top - Transcription factor enrichment analysis shown as a word cloud where size of name is proportional to the number of gene sets in transcriptional network clusters associated with the specific transcription factor. Bottom - Fitted GAM models (colored lines matching activation paths) of gene expression of enriched transcription factors (y axis - fixed across all paths for each gene) as a function of pseudotime (x axis - specific to each path). (E-F) Heatmap showing relative gene set score variance (low - blue; high - orange) of enriched GO terms (E) or KEGG pathways (F).

Comment in

References

    1. Lavin Y, Winter D, Blecher-Gonen R, David E, Keren-Shaul H, Merad M, Jung S, Amit I, Tissue-resident macrophage enhancer landscapes are shaped by the local microenvironment. Cell. 159, 1312–1326 (2014). - PMC - PubMed
    1. Gautier EL, Shay T, Miller J, Greter M, Jakubzick C, Ivanov S, Helft J, Chow A, Elpek KG, Gordonov S, Mazloom AR, Ma’ayan A, Chua W-J, Hansen TH, Turley SJ, Merad M, Randolph GJ, Immunological Genome Consortium, Gene-expression profiles and transcriptional regulatory pathways that underlie the identity and diversity of mouse tissue macrophages. Nat. Immunol 13, 1118–1128 (2012). - PMC - PubMed
    1. Wynn TA, Chawla A, Pollard JW, Macrophage biology in development, homeostasis and disease. Nature. 496, 445–455 (2013). - PMC - PubMed
    1. Hoeffel G, Ginhoux F, Fetal monocytes and the origins of tissue-resident macrophages. Cell. Immunol 330, 5–15 (2018). - PubMed
    1. Mass E, Ballesteros I, Farlik M, Halbritter F, Günther P, Crozet L, Jacome-Galarza CE, Händler K, Klughammer J, Kobayashi Y, Gomez-Perdiguero E, Schultze JL, Beyer M, Bock C, Geissmann F, Specification of tissue-resident macrophages during organogenesis. Science. 353 (2016), doi: 10.1126/science.aaf4238. - DOI - PMC - PubMed

Publication types

LinkOut - more resources