. 2022 Apr 28;185(9):1549-1555.e11.
doi: 10.1016/j.cell.2022.03.024. Epub 2022 Mar 17.

Vaccine protection against the SARS-CoV-2 Omicron variant in macaques

Affiliations

Vaccine protection against the SARS-CoV-2 Omicron variant in macaques

Abishek Chandrashekar et al. Cell. .

Abstract

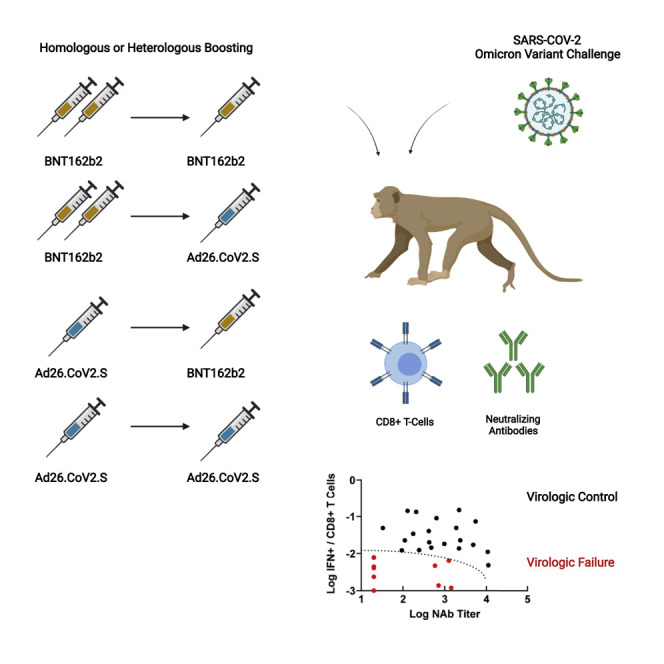
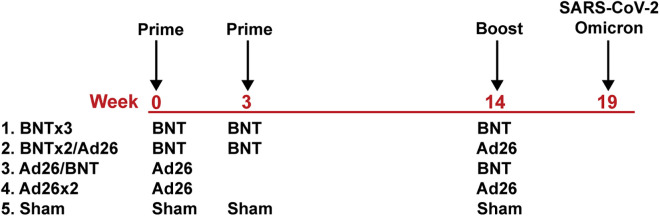
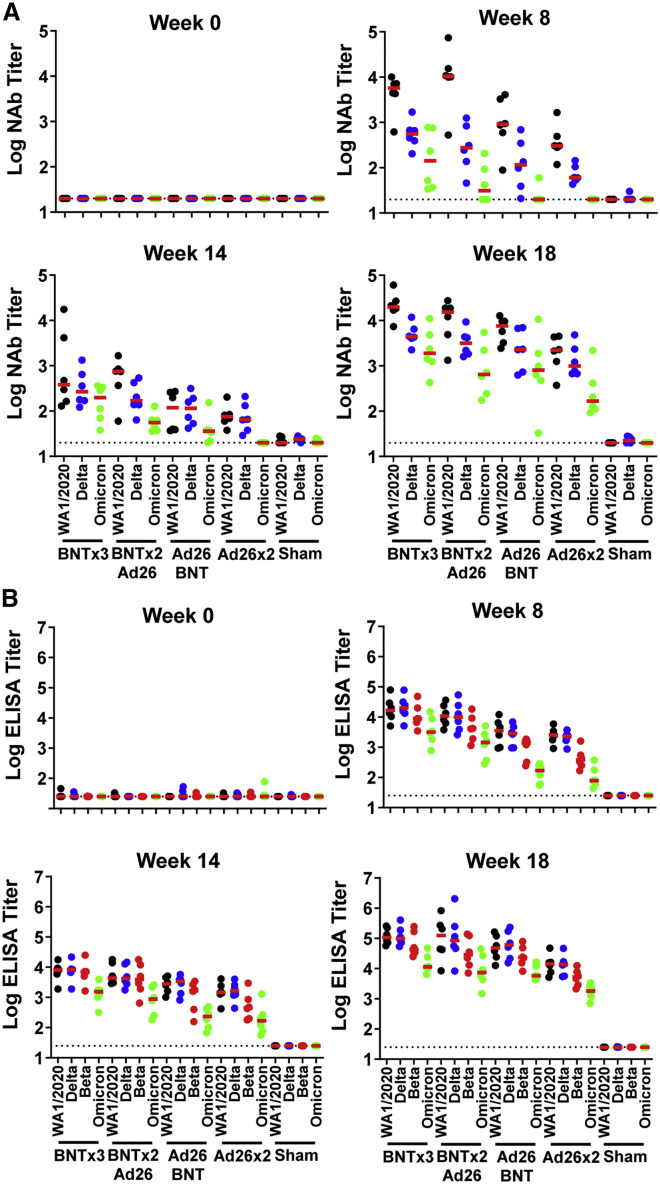
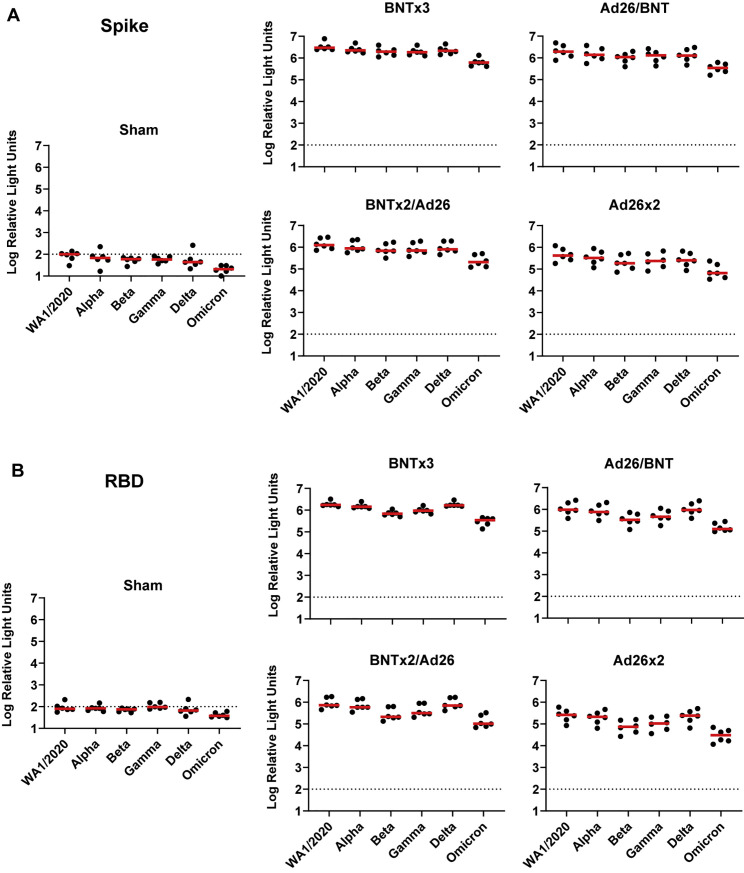
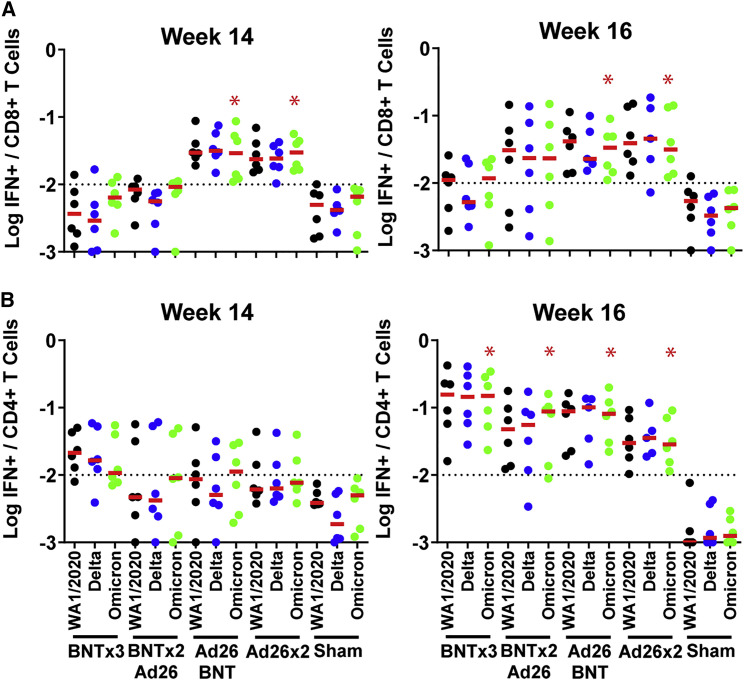
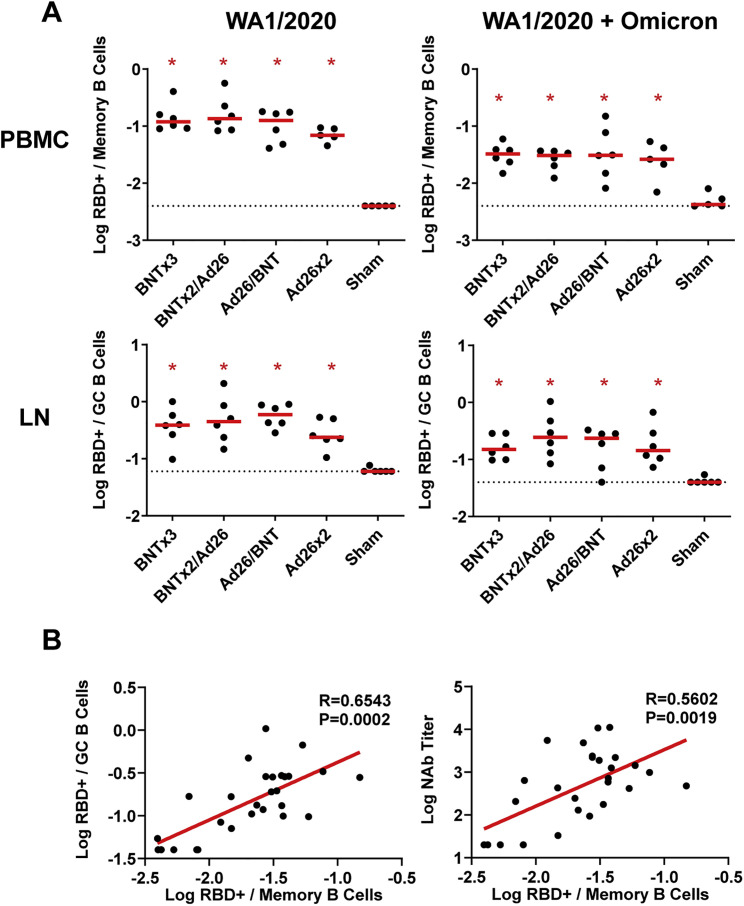
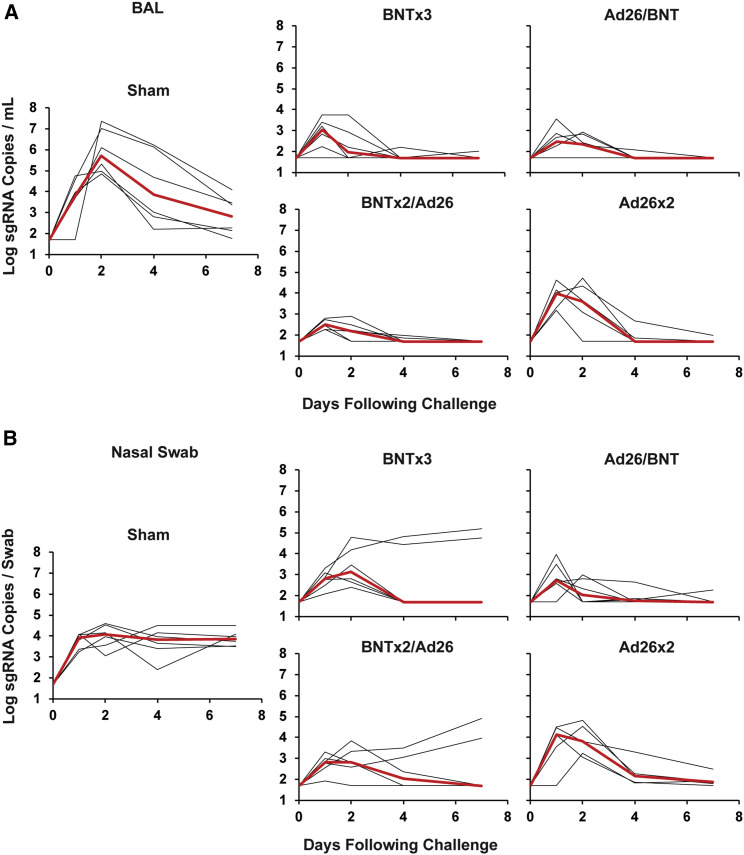
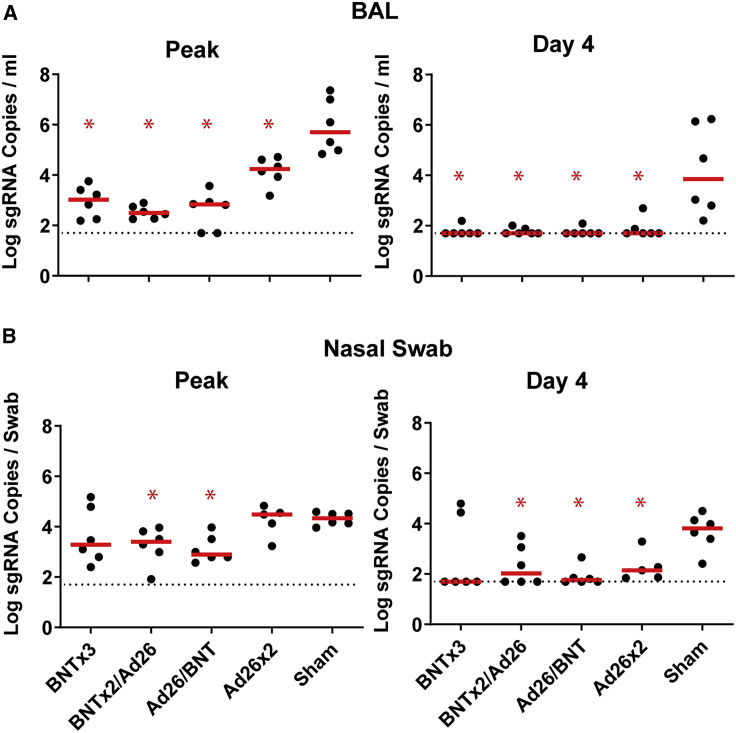
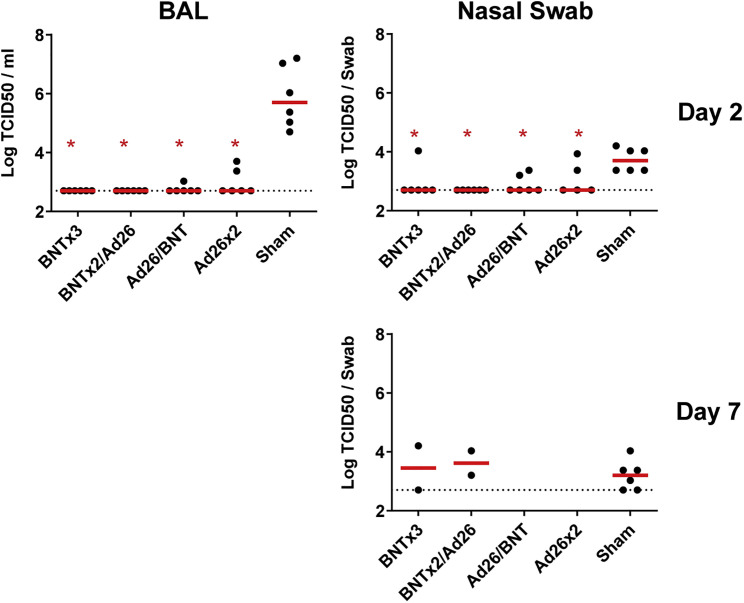
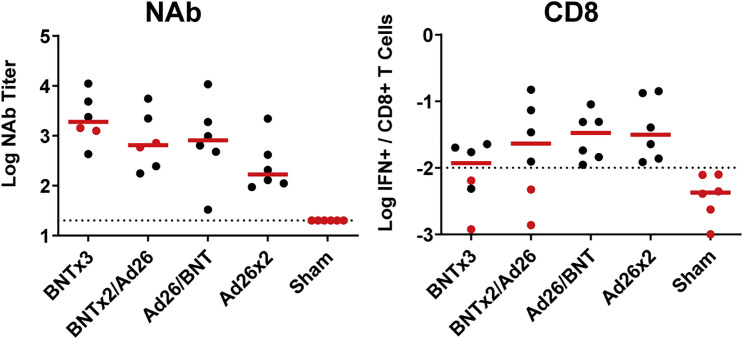
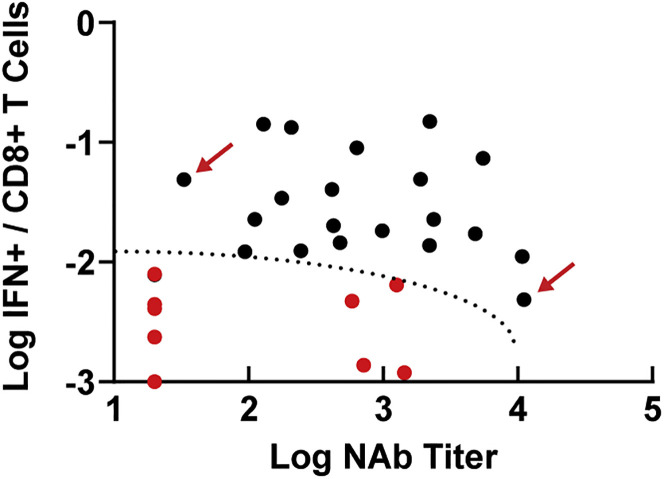
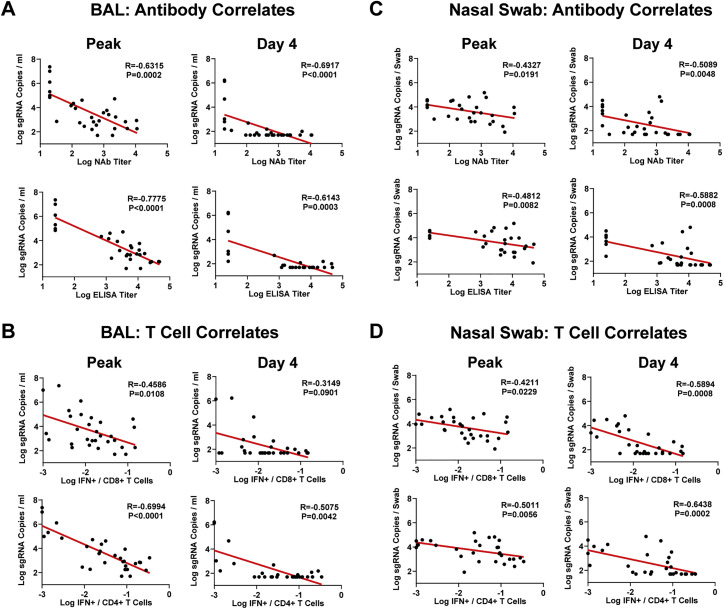
The rapid spread of the SARS-CoV-2 Omicron (B.1.1.529) variant, including in highly vaccinated populations, has raised important questions about the efficacy of current vaccines. In this study, we show that the mRNA-based BNT162b2 vaccine and the adenovirus-vector-based Ad26.COV2.S vaccine provide robust protection against high-dose challenge with the SARS-CoV-2 Omicron variant in cynomolgus macaques. We vaccinated 30 macaques with homologous and heterologous prime-boost regimens with BNT162b2 and Ad26.COV2.S. Following Omicron challenge, vaccinated macaques demonstrated rapid control of virus in bronchoalveolar lavage, and most vaccinated animals also controlled virus in nasal swabs. However, 4 vaccinated animals that had moderate Omicron-neutralizing antibody titers and undetectable Omicron CD8+ T cell responses failed to control virus in the upper respiratory tract. Moreover, virologic control correlated with both antibody and T cell responses. These data suggest that both humoral and cellular immune responses contribute to vaccine protection against a highly mutated SARS-CoV-2 variant.

Keywords: Omicron; SARS-CoV-2; macaque.


Conflict of interest statement

Declaration of interests D.H.B. is a co-inventor on provisional vaccine patents licensed to Janssen (63/121,482; 63/133,969; 63/135,182) and serves as a consultant to Pfizer. The authors report no other conflict of interest. A.C.M.B. has received funding from Abbvie for the commercial development of SARS-CoV-2 mAbs.

Figures

None
Graphical abstract
Figure 1
Figure 1
Study schema Vaccine groups and timing of immunization and challenge are shown.
Figure 2
Figure 2
Humoral immune responses following vaccination Antibody responses at weeks 0 (baseline), 8 (post-prime), 14 (pre-boost), and 18 (post-boost) following vaccination with BNTx3, BNTx2/Ad26, Ad26/BNT, Ad26x2, or sham (N = 30; N = 6/group). (A) Neutralizing antibody (NAb) titers by a luciferase-based pseudovirus neutralization assay. (B) Receptor-binding domain (RBD)-specific binding antibody titers by ELISA. Responses were measured against the SARS-CoV-2 WA1/2020 (black), B.1.617.2 (Delta; blue), B.1.351 (Beta; red), and B.1.1.529 (Omicron; green) variants. Dotted lines represent limits of quantitation. Medians (red bars) are shown. Omicron-specific NAbs in the vaccinated groups were compared with the sham controls by two-sided Mann-Whitney tests. p < 0.05.
Figure S1
Figure S1
Spike- and RBD-specific binding antibody responses following vaccination, related to Figure 1 (A and B) Spike-specific (A) and RBD-specific (B) antibody responses against multiple variants are shown at week 18 (post-boost) following vaccination with BNTx3, BNTx2/Ad26, Ad26/BNT, Ad26x2, or sham (N = 30; N = 6/group) with the Meso-Scale Discovery electrochemiluminescence assay (ECLA). Dotted lines represent limits of quantitation. Medians (red bars) are shown.
Figure 3
Figure 3
Cellular immune responses following vaccination T cell responses at weeks 14 (pre-boost) and 18 (post-boost) following vaccination with BNTx3, BNTx2/Ad26, Ad26/BNT, Ad26x2, or sham (N = 30; N = 6/group). (A and B) Pooled peptide spike-specific IFN-γ (A) CD8+ T cell responses and (B) CD4+ T cell responses by intracellular cytokine staining assays. Responses were measured against the SARS-CoV-2 WA1/2020 (black), B.1.617.2 (Delta; blue), and B.1.1.529 (Omicron; green) variants. Dotted lines represent limits of quantitation. Medians (red bars) are shown. Omicron-specific CD8+ and CD4+ T cell responses in the vaccinated groups were compared with the sham controls by two-sided Mann-Whitney tests. p < 0.05.
Figure S2
Figure S2
RBD-specific B cell responses following vaccination, related to Figure 1 (A) Total WA1/2020 and cross-reactive WA1/2020 and Omicron RBD-specific memory B cell responses in peripheral blood mononuclear cells (PBMC) and germinal center B cell responses in lymph nodes (LN) are shown at week 16 (post-boost) following vaccination with BNTx3, BNTx2/Ad26, Ad26/BNT, Ad26x2, or sham (N = 30; N = 6/group). Dotted lines represent limits of quantitation. Medians (red bars) are shown. Vaccinated groups were compared with the sham controls by two-sided Mann-Whitney tests. p < 0.05. (B) Correlations of Omicron-RBD-specific memory B cell responses in peripheral blood mononuclear cells (PBMC) with Omicron germinal center B cell responses in lymph nodes (LN) (left) and Omicron serum NAb titers are shown at week 16 (post-boost) (right). Correlations were assessed by two-sided Spearman rank-correlation tests. R and p values and a regression line of best fit are shown.
Figure 4
Figure 4
Viral loads following SARS-CoV-2 Omicron challenge (A) Log subgenomic RNA (sgRNA) copies/mL in bronchoalveolar lavage (BAL) following SARS-CoV-2 Omicron challenge. (B) Log subgenomic RNA (sgRNA) copies/swab in nasal swabs (NS) following SARS-CoV-2 Omicron challenge. Medians (red lines) are shown.
Figure 5
Figure 5
Comparison of peak and day 4 viral loads (A) Log subgenomic RNA (sgRNA) copies/mL in bronchoalveolar lavage (BAL) at peak and on day 4 following SARS-CoV-2 Omicron challenge. (B) Log subgenomic RNA (sgRNA) copies/swab in nasal swabs (NS) at peak and on day 4 following SARS-CoV-2 Omicron challenge. Dotted lines represent limits of quantitation. Medians (red bars) are shown. Vaccinated groups were compared with the sham controls by two-sided Mann-Whitney tests. p < 0.05.
Figure S3
Figure S3
TCID50 titers, related to Figure 3 Log TCID50/mL in bronchoalveolar lavage (BAL) and nasal swabs on day 2 following SARS-CoV-2 Omicron challenge (top). Log TCID50/mL is also shown in nasal swabs on day 7 following SARS-CoV-2 Omicron challenge in the 4 vaccinated animals in the BNTx3 and BNTx2/Ad26 groups and in the 6 sham controls with persistently positive sgRNA levels on day 7 (bottom). Dotted lines represent limits of quantitation. Medians (red bars) are shown. Vaccinated groups were compared with the sham controls by two-sided Mann-Whitney tests. p < 0.05.
Figure S4
Figure S4
Omicron-specific NAb and CD8+ T cell responses following the boost immunization, related to Figures 1 and 2 The 4 animals that failed to show virologic control in NS are highlighted in red (2 in the BNTx3 group, 2 in the BNTx2/Ad26 group).
Figure 6
Figure 6
Immunologic space defined by Omicron NAb titer and Omicron CD8+ T cell responses Plot of all 30 animals by their post-boost Omicron NAb titer and Omicron CD8+ T cell responses. Red dots represent the 10 animals that failed to control virus by day 7 in NS (6 controls, 4 vaccinated animals). The dotted line represents the region of immunologic space, defined post-hoc, which was associated with failure of virologic control. Red arrows show representative animals with low NAb titers but high CD8+ T cell responses, or high NAb titers but low CD8+ cell responses, which showed rapid virologic control.
Figure S5
Figure S5
Correlates of protection, related to Figure 5 (A and B) Correlations of week 18 NAb and ELISA titers (A) and week 16 CD8+ and CD4+ T cell responses (B) with peak and day 4 sgRNA copies/mL in BAL are shown. (C and D) Correlations of week 18 NAb and ELISA titers (C) and week 16 CD8+ and CD4+ T cell responses (D) with peak and day 4 sgRNA copies/swab in NS are also shown. Correlations were assessed by two-sided Spearman rank-correlation tests. R and p values and a regression line of best fit are shown.
Figure S6
Figure S6
Histopathology and immunohistochemistry of Omicron infection, related to Figure 1 (A–K) (A–C) Pharynx and (D–K) lungs from macaques on day 2 following Omicron infection demonstrated lymphoid hyperplasia of the pharynx (A and B), SARS-N positive ciliated epithelial cells in the pharynx (C), foamy macrophages and degenerating neutrophils in bronchiole lumen (D), cellular necrotic debris adhering to bronchiolar ciliated epithelium (E), alveolar syncytia (F), SARS-N-positive ciliated epithelial cells in the pulmonary interstitium (G), neutrophilic bronchitis (H), hyaline membranes (I), endothelialitis (J), and type II pneumocyte hyperplasia (K). Scoring involved assessment of the following lesions: interstitial inflammation and septal thickening, interstitial infiltrate (eosinophils), interstitial infiltrate (neutrophils), hyaline membranes, interstitial fibrosis, alveolar infiltrate (macrophages), bronchoalveolar infiltrate (neutrophils), epithelial syncytia, type II pneumocyte hyperplasia, bronchi infiltrate (macrophages), bronchi infiltrate (neutrophils), bronchi (hyperplasia of bronchus-associated lymphoid tissue), bronchiolar or peribronchiolar infiltrate (mononuclear cells), perivascular infiltrate (mononuclear cells), and endothelialitis. Each feature assessed was assigned a score of: 0, no substantial findings; 1, minimal; 2, mild; 3, moderate; 4, moderate to severe; 5, marked or severe. Scores were added for all lesions across all lung lobes for each macaque, for a maximum possible score of 600 for each macaque. (L) Summary of lung pathology scores from SARS-CoV-2 WA1/2020- and Omicron-infected macaques. Medians (red bars) are shown. Dotted line represents no pathology. Lung pathology scores were compared in macaques infected with Omicron versus WA1/2020 by two-sided Mann-Whitney tests. p < 0.05.

Update of

References

    1. Alter G., Yu J., Liu J., Chandrashekar A., Borducchi E.N., Tostanoski L.H., McMahan K., Jacob-Dolan C., Martinez D.R., Chang A., et al. Immunogenicity of Ad26.COV2.S vaccine against SARS-CoV-2 variants in humans. Nature. 2021;596:268–272. - PMC - PubMed
    1. Atmar R.L., Lyke K.E., Deming M.E., Jackson L.A., Branche A.R., El Sahly H.M., Rostad C.A., Martin J.M., Johnston C., Rupp R.E., et al. Homologous and heterologous Covid-19 booster vaccinations. N. Engl. J. Med. 2022;386:1046–1057. - PMC - PubMed
    1. Carreño J.M., Alshammary H., Tcheou J., Singh G., Raskin A.J., Kawabata H., Sominsky L.A., Clark J.J., Adelsberg D.C., Bielak D.A., et al. Activity of convalescent and vaccine serum against SARS-CoV-2 Omicron. Nature. 2022;602:682–688. - PubMed
    1. Cele S., Jackson L., Khoury D.S., Khan K., Moyo-Gwete T., Tegally H., San J.E., Cromer D., Scheepers C., Amoako D.G., et al. Omicron extensively but incompletely escapes Pfizer BNT162b2 neutralization. Nature. 2022;602:654–656. - PMC - PubMed
    1. Chandrashekar A., Liu J., Martinot A.J., McMahan K., Mercado N.B., Peter L., Tostanoski L.H., Yu J., Maliga Z., Nekorchuk M., et al. SARS-CoV-2 infection protects against rechallenge in rhesus macaques. Science. 2020;369:812–817. - PMC - PubMed

Publication types

Supplementary concepts