. 2022 May 9;40(5):545-557.e13.
doi: 10.1016/j.ccell.2022.03.008. Epub 2022 Apr 14.

Ovarian cancer immunogenicity is governed by a narrow subset of progenitor tissue-resident memory T cells

Affiliations

Ovarian cancer immunogenicity is governed by a narrow subset of progenitor tissue-resident memory T cells

Carmen M Anadon et al. Cancer Cell. .

Abstract

Despite repeated associations between T cell infiltration and outcome, human ovarian cancer remains poorly responsive to immunotherapy. We report that the hallmarks of tumor recognition in ovarian cancer-infiltrating T cells are primarily restricted to tissue-resident memory (TRM) cells. Single-cell RNA/TCR/ATAC sequencing of 83,454 CD3+CD8+CD103+CD69+ TRM cells and immunohistochemistry of 122 high-grade serous ovarian cancers shows that only progenitor (TCF1low) tissue-resident T cells (TRMstem cells), but not recirculating TCF1+ T cells, predict ovarian cancer outcome. TRMstem cells arise from transitional recirculating T cells, which depends on antigen affinity/persistence, resulting in oligoclonal, trogocytic, effector lymphocytes that eventually become exhausted. Therefore, ovarian cancer is indeed an immunogenic disease, but that depends on ∼13% of CD8+ tumor-infiltrating T cells (∼3% of CD8+ clonotypes), which are primed against high-affinity antigens and maintain waves of effector TRM-like cells. Our results define the signature of relevant tumor-reactive T cells in human ovarian cancer, which could be applicable to other tumors with unideal mutational burden.

Keywords: immuno-oncology; neoantigen; ovarian cancer; tissue-resident memory-like T cell; tumor-infiltrating lymphocyte.


Conflict of interest statement

Declaration of interests J.R.C.-G. has stock options with Compass Therapeutics, Anixa Biosciences, and Alloy Therapeutics; receives honorarium from Anixa Biosciences, Alloy Therapeutics, and Leidos; and has sponsored research with Anixa Biosciences (all outside the submitted work). B.A.P. has served on the Advisory Board of AstraZeneca and has research support from BMS. J.R.C.-G. is currently an employee of STEMCELL Technologies (all work outside the submitted work). R.M.W. reports grants and personal fees from Merck, personal fees from Tesaro/GSK, personal fees from Genentech, personal fees from Legend Biotech, personal fees from AbbVie, personal fees from Astrazeneca, grants and stock from Ovation Diagnostics, personal fees from Clovis Oncology, and personal fees from Regeneron (all outside the submitted work).

Figures

Figure 1.
Figure 1.. Analysis of trogocytosis in CD8+ TILs from HGSOC.
A) ImageStream multispectral images from a HGSOC showing CD8+TILs including brightfield (BF), EpCAM-PE (yellow), CD8-FITC (green), DRAQ5 (red) and the merge showing the co-localization of CD8-EpCAM. Representative images shown from 200,000 total cells and 1,300 CD8+ analyzed. B) Agarose gel electrophoresis of EPCAM amplicons (150bp) obtained by PCR amplification of cDNA from 4 different sorted CD8+TILs paired to the tumors. GAPDH was used as housekeeping gene. C) Dot plot of EpCAM+CD8+TILs from 18 HGSOC (top; representative image). Dot plot (right) and quantification (bottom) of the proportion of TRM-like CD8+ TILs (red) and re-circulating CD8+ TILs (blue) within EpCAM+ CD8+TILs vs EpCAM TILs from 9 tumors with presence of EpCAM+CD8+ TILs. Data is presented as mean with SEM (standard error of the mean). Statistical analysis performed by paired t-test (n=9). *p<0.05, **p≤0.01, ***p≤0.001. See also Figure S1.
Figure 2.
Figure 2.. Hallmarks of active tumor recognition are found on TRM-like CD8+ TILs, but not in their re-circulating counterparts.
A) Dotplot (left panel) of the proportions of TRM-like and re-circulating CD8+ TILs in HGSOC. Representative dot plot shown from 7 tumors. Histograms (right panel) show the expression of CD49a (MFI shown). B) Heatmap showing differentially expressed genes between TRM-like vs re-circulating CD8+ TILs sorted from 7 HGSOCs. Genes with Log2-FoldChange >1 (fold-change > 2) and false discovery rate (FDR) controlled p-value < 0.05 (N=163) were considered upregulated. Genes with Log2-FoldChange <-1 and FDR controlled p-value < 0.05 (N=124) were considered downregulated. Signature genes are labeled by function. C) Gene Ontology (GO) enrichment analysis for differentially expressed genes in TRM-like vs re-circulating CD8+ TILs from the same tumors. Bar plot shows −log10(p-value) of the pre-ranked Gene Set Enrichment Analysis (see Methods). D) TCR-beta repertoire of sorted TRM-like and re-circulating CD8+ TILs from 12 HGSOCs. Bar plot (left) shows the percentage of unique TCRs and overlapped TCRs in TRM-like vs re-circulating CD8+ TILs in each tumor. Ven diagram (right) shows the average of unique TCRs in TRM-like (red), re-circulating (green) and overlapped TCRs (orange) among the 12 tumors. E) Productive clonality (Shannon Entropy). Data shows mean with SEM. Paired t-test. *p<0.05, **p≤0.01, ***p≤0.001. F) Experimental setting. G) Representative FACS dot plot of TRM-like and re-circulating CD8+ TILs obtained from OVAlow -UPK10 tumors, 7 days after purified CD8+ OT-I T cells were injected intratumorally, ex vivo activated 2 days prior. H) Percentage of recovered TRM-like from UPK10 tumors transduced with OVAlow (red) or empty vector (mock, blue), 7 days after intratumoral injection of purified CD8+ OT-I T cells, activated 2 days prior with SIINFEKL or maintained with IL-2 (control). Pooled from 5 independent experiments. I) Fold change of OVAlow-UPK10 tumor volume 5 days after injection with TRM-like or re-circulating TILs sorted from OVAlow-UPK10 tumors, injected 7 days before with purified, SIINFEKL-activated, CD8+ OT-I cells. Pooled from 3 independent experiments. J) Fold change of gp100-UPK10 tumor volume 5 days after injection with TRM-like or re-circulating TILs sorted from gp100-UPK10 tumors, injected 7 days before with purified Gp100(25-33)-activated CD8+ Pmel cells. Pooled from 3 independent experiments. For H, I and J, data presented shows mean with SEM. Each dot represents one mouse. Unpaired t-test non-parametric (Mann-Whitney test). *p<0.05, **p≤0.01, ***p≤0.001. See also Figure S1 and Table S1.
Figure 3.
Figure 3.. Matched Single Cell gene profile and Single Cell Chromatin accessibility analysis reveal a trajectory of differentiation from TRMstem cells to TRMexh TILs.
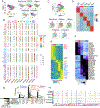
A) Left) Uniform manifold approximation and projection (UMAP) of 24,175 re-circulating TILs and 19.193 TRM-like CD8+ TILs sorted form 4 HGSOC showing 27 colored clusters. CD3+CD8+CD103− vs CD3+CD8+CD103+CD69+CD49a+ TILs were sorted and sequenced separately, and then merged for analysis. Each dot represents one unique cell. Right) cells are colored by 5 major groups. B) Relative expression bubble plot of selected genes known to be associated with different stages of TRM-like differentiation. The color of each dot represents the average normalized expression from high (red) to low (blue). The size of each dot represents the percentage of positive cells for each gene. C) UMAP projection of 4,251 TRM-like and 16,615 re-circulating TILs sorted form 4 HGSOCs showing 22 color-coded cell clusters, using chromatin accessibility and nuclear RNA data (top), or the major 5 cell class annotation (bottom). D-F, Heatmap of class-specific D) peaks, E) gene activity scores, and F) TF motifs enriched in peaks. Each column represents one group of the trajectory of the TRM-like differentiation. Each row represents differentially accessible peak regions (N=57,555); D), E) genes showing differential activity across the major groups (E), and transcription factor motifs (F). For D and E, color represents row-wise z-transformed average scores with values thresholded at −2 and +2 for each peak and gene. For F, the color represents normalized enrichment (−log10(FDR adjusted p-value) of the TF motifs within the differentially accessible peaks of each major group. G) TCR sharing between the 5 major groups obtained by single cell VDJ profiling. Bar on the left shows the number of unique clonotypes in each group. Bar at the top panel shows the number of clonotypes shared for the groups with a black dot under the bar. H) Normalized scATAC-seq-derived pseudo-bulk accessibility tracks of specific genes showing unique chromatin accessibility profiles for each major group. Tracks are normalized to the total number of reads aligned to TSS regions. See also Figures S2, S3, and S4, and Tables S2 and S3.
Figure 4.
Figure 4.. Clonal enrichment of TILs with TCRs shared by TRMstem and downstream TRM-like phenotypes.
A) Left) UMAP of 60,010 TRM-like CD8+ TILs sorted from 8 HGSOC showing 25 clusters according to the gene expression. Right) Cells are colored by 4 major groups. B) Bubble plot of the relative expression emphasizing the same genes highlighted in Figure 3. The color of each dot presents the average expression from high (red) to low (blue). The size of each dot represents the percentage of positive cells for each gene. C) Violin plot showing the normalized gene expression of genes involved in TRM-like differentiation in the 4 major groups. D) TCR sharing between TRMstem, TRMeff, TRMprol and TRMexh. Yellow dots represent clones dominated by TRMstem/TRMeff cells (>60%). Red dots represent clones dominated by TRMprol/TRMexh cells (>60%). Gray dots represent clones shared between TRMstem/TRMeff and TRMprol/TRMexh cells. The size of the dots represents the number of clones with the same number of cells. X-axis denotes the log2-scaled of cell count within each clone. TRMexh/TRMprol have more larger clones and thus higher clonality than other groups. E) Clonal composition of TRM-like CD8+ TILs in the 8 HGSOCs. From top to bottom, panel shows the number of different clones per tumor, the number of TRM-like TILs with productive VDJ sequences colored by group, the distribution of the clones by size (color in the bars show =1, 2-3, 4-10, 11-50, >50 cells), and the pies charts showing the TRM-like group composition of clones stratified by size (color represents the TRM-like group) in each tumor. F) Clonotypes showing different trajectories. Each UMAP contain one unique clonotype and the cells belonging to the clonotype are colored by TRM-like groups. Left) clonotypes only expressed in TRMstem; (middle) clonotypes showing the full trajectory; (right) clonotypes that have lost the TRMstem reservoir. G) TCR sharing between the TRM-like groups obtained by single cell VDJ profiling. Bar on the left shows the number of unique clonotypes in each group. Bar at the top panel shows the number of clonotypes shared by the groups. See also Figure S5 and Table S4.
Figure 5.
Figure 5.. TRMstem cell recognize specific tumor antigens and correlate with better survival.
A) Jurkat76 cells co-transduced with CD3 complex and 5 different TCRs identified from 2 different tumors or with CD3 complex and empty vector (mock) were co-cultured with the corresponding immortalized tumor cells (tumor-sorted CD45EpCAM+ primary HGSOC cells) at a ratio of 1:5 (tumor:Jurkat). IL-2 levels in the supernatant were measured by ELISA after 48h. Jurkat76 co-transduced with CD3 complex and NY-ESO-1-TCR were co-cultured with aAPCs (K32) expressing HLA:A2 and NY-ESO-1 peptide as a positive control (top panel). Representative from 2 independent experiments. Data shows mean with SEM. Statistical analysis performed by unpaired t-test non-parametric (Mann-Whitney test). *p<0.05, **p≤0.01, ***p≤0.001. To increase IL-2 production by Jurkat76, PMA was added at 10ng/mL to the co-culture (bottom panel). B) Representative images from tumor sections (n=122) of multiplex immunohistochemistry shown of combined staining of CD3, CD8, CD69, CD103, TCF1 and DAPI (top left). Magnified images shown of combined staining of same colors (middle) and without CD69 (right) indicating the presence of TRMstem (white arrows) and TCF1+ re-circulating (red arrows) CD8+ TILs. Images of single staining from each marker in the bottom. Scale bar=50μm. C) Overall survival associated with higher ratios of TRM-like/re-circulating CD8+ TILs in HGSOCs, as assessed by multiplex immunofluorescence. D) Distribution (in number of cell counts) of TRM-like (CD3+CD8+CD69+CD103+) and re-circulating CD8+ TILs (CD3+CD8+CD103) in tumor islets and stroma. Data shows mean with SEM of 122 HGSOC. Statistical analysis performed by paired t-test non-parametric (Wilcoxon test). *p<0.05, **p≤0.01, ***p≤0.001. E) Survival outcome associated with the presence of TRMstem (CD3+CD8+CD69+CD103+TCF1+) in 122 HGSOC, from 3 independent TMAs. F) Higher density of stem-like re-circulating (TCF1+CD103CD8+) or G) resting re-circulating TILs (TCF1+CD103CD8+CD69) is not associated with better outcome. H) In sections where TRMstem were not detected, the presence of differentiated TRMs-like (CD69+CD103+TCF1neg) was not significantly associated with improved survival. *p ≤ 0.05, **p ≤ 0.01, two-sided log-rank (Mantel–Cox) test. I) A spatial interaction network was fitted to the spatial distribution of cells, which was subsequently simplified via community detection. Negative values (blue) indicate spatial repulsion while positive values (red) indicate spatial attraction. Grey boxes contain cell types found within the same community. J) Left box) t-SNE rendering showing distribution of the three TMAs using in this analysis. Top) 2D t-SNE rendering showing distinct clusters of TRM-like cells and re-circulating T cells where TRMstem cluster exclusively with another TRM-like cells, while other populations exist as distinct clusters of their own. Bottom) t-SNE image showing the distribution of the four phenotypes, TRMnon-stem (CD3+CD8+CD69+CD103+TCF1), TRMstem (CD3+CD8+CD69+CD103+TCF1+), CD69+ re-circulating (CD3+CD8+CD69+CD103) and CD69 re-circulating (CD3+CD8+CD69CD103) TILs. Color bar from yellow to red indicates distribution depth with red depicting highest distribution of a particular phenotype. See also Figure S6.
Figure 6.
Figure 6.. Strong priming and persistence of the antigen at tumor beds are required for the generation and maintenance of TRMstem CD8+ TILs.
A) Experimental setting. B) FACS analysis of CD45.2+ and TRM-like CD8+ TILs from OVAlow-UPK10 tumors 7 days after intratumoral injection with purified CD8+ OT-I T cells, activated for 2 days with SIINFEKL at 1/0.5/2 μg/mL. C) Percentage of TRMstem (CD45.2+CD3+CD8+CD69+CD103+IL7R+TCF1+) or TRMeff. (CD45.2+CD3+CD8+CD69+CD103+MHC-II+CXCR6+) within TRM-like CD8+ OT-I TILs in OVAlow-UPK10 tumors, 7 days after intratumoral injection with purified, SIINFEKL-activated CD8+ OT-I T cells (1/0.5/2 μg/mL). D) Proportion of intratumoral transferred OT-I T cells, activated 2 days before with SIINFEKL vs incubated with control IL-2. E) Quantification of CD45.2; F) TRM-like OVA-specific CD8+ TILs; G) TRMstem; and H) TRMeff, within TRM-like TILs from OVAlow-UPK10 tumors, after activation with SIINFEKL or lower affinity peptides, Q4H7 (SIIQFEHL) and G4 (SIIGFEKL). I) FACS analysis of CD45.2+ and J) TRMstem and TRMeff cells within OT-I TRM-like TILs sorted from UPK10 tumors transduced with OVAlow (red) or empty vector (mock, blue). SIINFEKL-activated OT-I cells and OT-I cells maintained with IL-2 (control) are shown. Pooled from 3 independent experiments. For E, F, and I, pooled from 5 independent experiments. Data are represented as mean with SEM. Each dot represents one mouse. Unpaired t-test non-parametric (Mann-Whitney test). *p<0.05, **p≤0.01, ***p≤0.001. See also Figure S6.

Comment in

References

    1. Aibar S, González-Blas CB, Moerman T, Huynh-Thu VA, Imrichova H, Hulselmans G, Rambow F, Marine J-C, Geurts P, Aerts J, et al. (2017). SCENIC: single-cell regulatory network inference and clustering. Nature Methods 14, 1083–1086. - PMC - PubMed
    1. Amsen D, van Gisbergen K, Hombrink P, and van Lier RAW (2018). Tissue-resident memory T cells at the center of immunity to solid tumors. Nat Immunol 19, 538–546. - PubMed
    1. Ashburner M, Ball CA, Blake JA, Botstein D, Butler H, Cherry JM, Davis AP, Dolinski K, Dwight SS, Eppig JT, et al. (2000). Gene ontology: tool for the unification of biology. The Gene Ontology Consortium. Nat Genet 25, 25–29. - PMC - PubMed
    1. Baddeley A, and Turner R (2005). spatstat: An R Package for Analyzing Spatial Point Patterns. Journal of Statistical Software 12, 1 – 42.
    1. Baddeley A, and Turner R (2006). Modelling Spatial Point Patterns in R. In Case Studies in Spatial Point Process Modeling, Baddeley A, Gregori P, Mateu J, Stoica R, and Stoyan D, eds. (New York, NY: Springer New York; ), pp. 23–74.

Publication types