. 2022 Apr 15;17(1):27.
doi: 10.1186/s13012-022-01192-w.

Extending analytic methods for economic evaluation in implementation science

Affiliations

Extending analytic methods for economic evaluation in implementation science

Meghan C O'Leary et al. Implement Sci. .

Abstract

Background: Economic evaluations of the implementation of health-related evidence-based interventions (EBIs) are conducted infrequently and, when performed, often use a limited set of quantitative methods to estimate the cost and effectiveness of EBIs. These studies often underestimate the resources required to implement and sustain EBIs in diverse populations and settings, in part due to inadequate scoping of EBI boundaries and underutilization of methods designed to understand the local context. We call for increased use of diverse methods, especially the integration of quantitative and qualitative approaches, for conducting and better using economic evaluations and related insights across all phases of implementation.

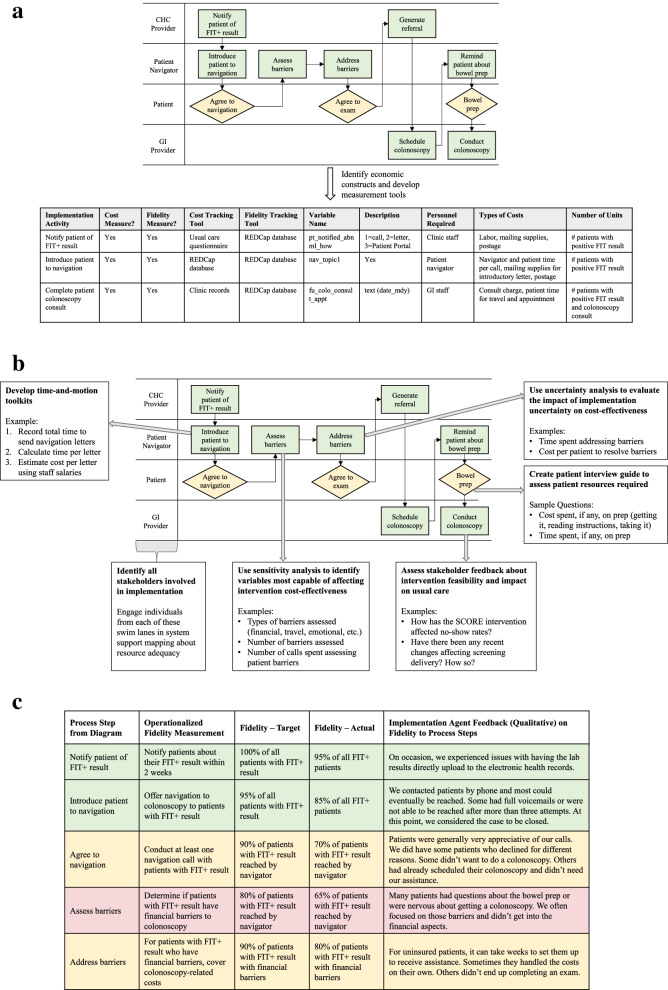
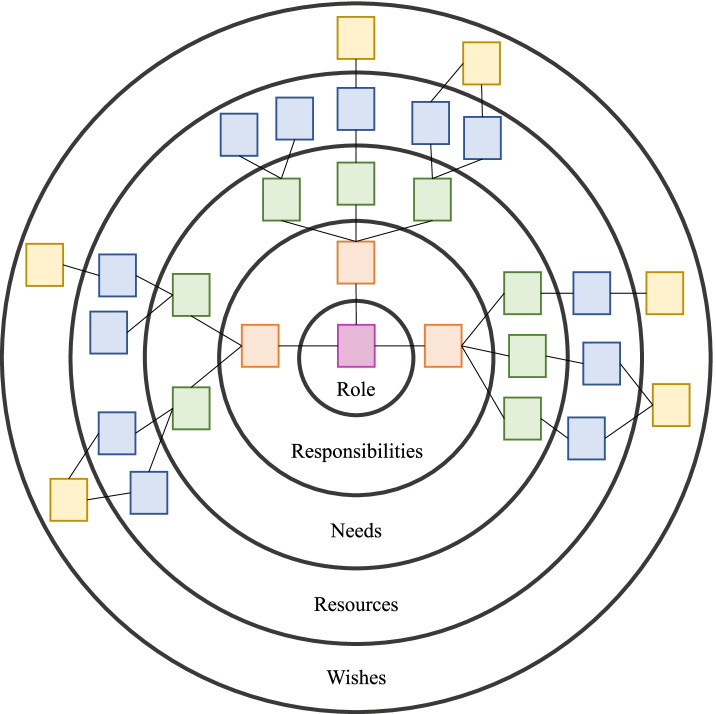
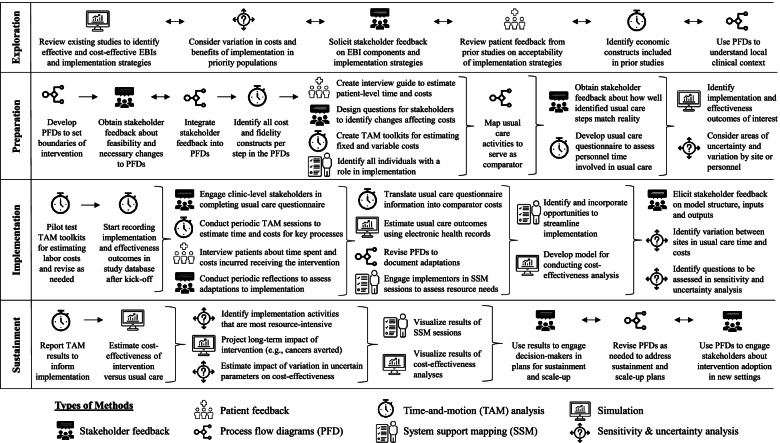
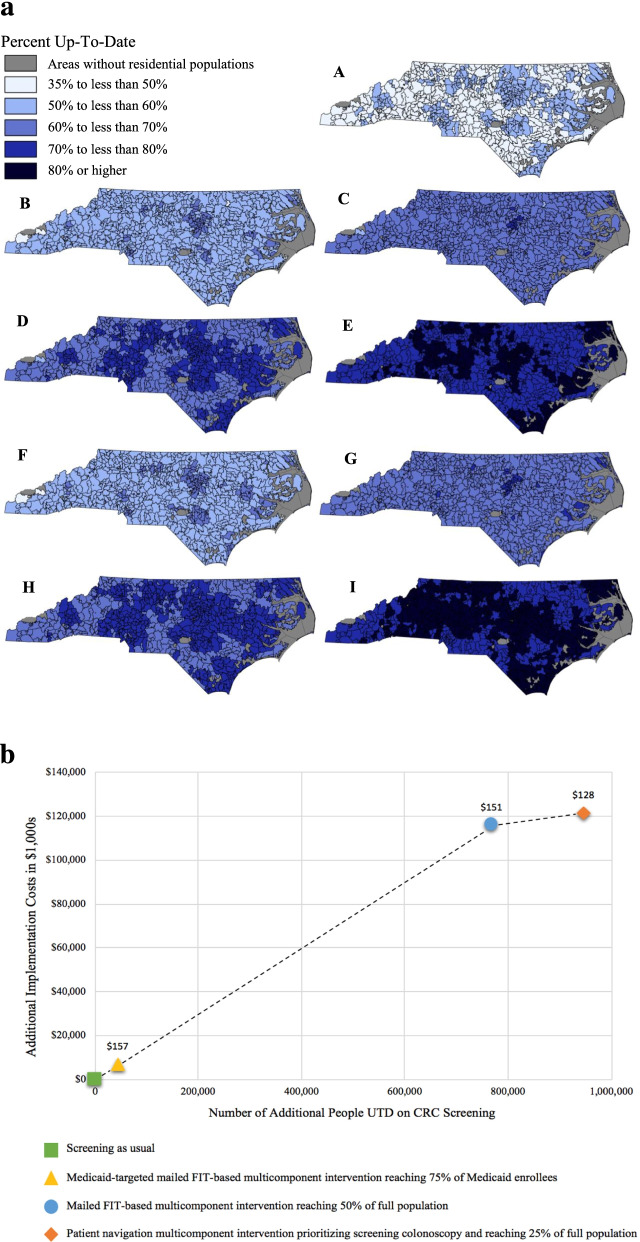
Main body: We describe methodological opportunities by implementation phase to develop more comprehensive and context-specific estimates of implementation costs and downstream impacts of EBI implementation, using the Exploration, Preparation, Implementation, Sustainment (EPIS) framework. We focus specifically on the implementation of complex interventions, which are often multi-level, resource-intensive, multicomponent, heterogeneous across sites and populations, involve many stakeholders and implementation agents, and change over time with respect to costs and outcomes. Using colorectal cancer (CRC) screening EBIs as examples, we outline several approaches to specifying the "boundaries" of EBI implementation and analyzing implementation costs by phase of implementation. We describe how systems mapping and stakeholder engagement methods can be used to clarify EBI implementation costs and guide data collection-particularly important when EBIs are complex. In addition, we discuss the use of simulation modeling with sensitivity/uncertainty analyses within implementation studies for projecting the health and economic impacts of investment in EBIs. Finally, we describe how these results, enhanced by careful data visualization, can inform selection, adoption, adaptation, and sustainment of EBIs.

Conclusion: Health economists and implementation scientists alike should draw from a larger menu of methods for estimating the costs and outcomes associated with complex EBI implementation and employ these methods across the EPIS phases. Our prior experiences using qualitative and systems approaches in addition to traditional quantitative methods provided rich data for informing decision-making about the value of investing in CRC screening EBIs and long-term planning for these health programs. Future work should consider additional opportunities for mixed-method approaches to economic evaluations.

Keywords: Colorectal cancer screening; Costs and cost analysis; Economic evaluation; Implementation science.


Conflict of interest statement

SBW receives funding paid to her institution from Pfizer Foundation and AstraZeneca for unrelated work. The other authors declare that they have no competing interests.

Figures

Fig. 1
Fig. 1
a Use of swimlane diagrams to identify economic and fidelity measures for the SCORE intervention during the Preparation phase. This is a simplified version of a process flow diagram for patient navigation to follow-up colonoscopy provided as part of the SCORE intervention. Examples are provided of how specific process steps are used to develop cost and fidelity measures and appropriate tools for measuring these constructs. CHC community health center, FIT fecal immunochemical test, GI gastrointestinal, SCORE Scaling Colorectal Cancer Screening Through Outreach, Referral, and Engagement. b Use of swimlane diagrams to inform mixed methods approach to estimating costs of implementing the SCORE intervention. This is a simplified version of a process flow diagram for patient navigation to follow-up colonoscopy provided as part of the SCORE intervention. For individual steps involved in implementing the patient navigation intervention, examples are provided for how diverse types of methods can be used to collect and estimate the required resources to implement that step. CHC community health center, FIT fecal immunochemical test, GI gastrointestinal, SCORE Scaling Colorectal Cancer Screening Through Outreach, Referral, and Engagement. c Example integration and presentation of mixed methods results. This is an example using hypothetical data of how we might integrate the quantitative results of our analysis (in this case, the proportion of patients who received each process step) with qualitative data from implementation agents. The color-coding is used to identify process steps from the process flow diagram included in (a and b) with low (< 70% of patients), moderate (between 70 and 84% of patients), and high (85% of patients or higher) fidelity. This structure can also be used to integrate cost estimates per step with qualitative findings
Fig. 2
Fig. 2
System support mapping (SSM) example. This is a stylized version of a system support mapping (SSM) diagram. In SSM sessions, each individual with a role in evidence-based intervention implementation reflects on each of the topics (e.g., role, responsibilities, etc.) listed in the rings. The squares represent individual notes or ideas per topic area and are connected across the rings to tell complete stories about each specific responsibility or task they undertake related to intervention implementation (each on its own orange square). To accomplish each responsibility or task, they are asked to name critical needs (green notes), resources they rely on to support those needs (blue notes), and, reflecting on how well those resources work, identify specific wishes for how they could be better supported in accomplishing that responsibility or task (yellow notes). Lines interconnect notes within a story about each named responsibility or task. The numbers of rings and notes per ring will vary across implementation agents and implementation studies. Maps can be made in person, with sticky notes, or virtually. In any case, each individual should verbally describe their map since this will enrich the documented map
Fig. 3
Fig. 3
Example schematic for clarifying cost-related activities for economic evaluation of SCORE intervention across EPIS phases. This figure depicts how we integrated quantitative, qualitative, and systems approaches to estimate the costs and impact of implementing the SCORE intervention across implementation phases. Economic evaluations of other EBIs may vary considerably in the number and types of methods used, as well as how these methods are integrated, for multiple reasons (e.g., available resources, local context, intervention complexity, etc.). We included a highly detailed version to help inform planning for other economic evaluations. Bidirectional arrows indicate that the methods inform each other in a more cyclical process, and brackets indicate that multiple methods are being used simultaneously
Fig. 4
Fig. 4
a Percent of eligible North Carolina residents up-to-date on CRC screening by zip code assuming different types of interventions, levels of intervention reach, and health insurance policy after 5 years of intervention. A: Status quo scenario (i.e., absence of intervention or health policy change). B: Implementation of mailed FIT-based multicomponent interventions, assuming 25% reach of eligible population and no Medicaid expansion. C: Implementation of multicomponent interventions prioritizing patient navigation to screening colonoscopy, assuming 25% reach of eligible population and no Medicaid expansion. D: Implementation of mailed FIT-based multicomponent interventions, assuming 75% reach of eligible population and no Medicaid expansion. E: Implementation of multicomponent interventions prioritizing patient navigation to screening colonoscopy, assuming 75% reach of eligible population and no Medicaid expansion. F: Implementation of mailed FIT-based multicomponent interventions, assuming 25% reach of eligible population and Medicaid expansion. G: Implementation of multicomponent interventions prioritizing patient navigation to screening colonoscopy, assuming 25% reach of eligible population and Medicaid expansion. H: Implementation of mailed FIT-based multicomponent interventions, assuming 75% reach of eligible population and Medicaid expansion. I: Implementation of multicomponent interventions prioritizing patient navigation to screening colonoscopy, assuming 75% reach of eligible population and Medicaid expansion. Maps can help to guide decision-making about where and how to best invest limited resources to improve health outcomes. These maps can help to assess the potential impact of various combinations of approaches for increasing CRC screening at the population level by region, all of which have important cost and resource implications. b. Value frontier based on multicomponent CRC screening intervention implementation costs over 5 years. This figure, which is shown for illustrative purposes, compares the incremental number of age-eligible North Carolina residents up-to-date (UTD) on CRC screening (x-axis) and the incremental implementation costs (y-axis) for multicomponent intervention scenarios after 5 years. The incremental cost-effectiveness ratios (ICERs) are reported for each scenario above the data point. Cost and effectiveness estimates are based on prior CRC screening intervention studies [, –76]. Costs of screening tests and required follow-up are excluded. We assumed the level of reach that would be feasible for each intervention scenario. The target population for the scenarios includes all age-eligible state residents, except for one scenario which only reaches Medicaid enrollees

Similar articles

Cited by

References

    1. Dopp AR, Mundey P, Beasley LO, Silovsky JF, Eisenberg D. Mixed-method approaches to strengthen economic evaluations in implementation research. Implement Sci. 2019;14(1):2. doi: 10.1186/s13012-018-0850-6. - DOI - PMC - PubMed
    1. Roberts SLE, Healey A, Sevdalis N. Use of health economic evaluation in the implementation and improvement science fields-a systematic literature review. Implement Sci. 2019;14(1):72. doi: 10.1186/s13012-019-0901-7. - DOI - PMC - PubMed
    1. Barnett ML, Dopp AR, Klein C, Ettner SL, Powell BJ, Saldana L. Collaborating with health economists to advance implementation science: a qualitative study. Implement Sci Commun. 2020;1:82. doi: 10.1186/s43058-020-00074-w. - DOI - PMC - PubMed
    1. Saldana L, Chamberlain P, Bradford WD, Campbell M, Landsverk J. The cost of implementing new strategies (COINS): a method for mapping implementation resources using the stages of implementation completion. Child Youth Serv Rev. 2014;39:177–182. doi: 10.1016/j.childyouth.2013.10.006. - DOI - PMC - PubMed
    1. Eisman AB, Kilbourne AM, Dopp AR, Saldana L, Eisenberg D. Economic evaluation in implementation science: Making the business case for implementation strategies. Psychiatry Res. 2020;283:112433. doi: 10.1016/j.psychres.2019.06.008. - DOI - PMC - PubMed

Publication types

LinkOut - more resources